INTRODUCTION
In the lead-up to two mayoral elections in Indonesia, candidates from multiple parties distributed rice, eggs, cooking oil, headscarves, and prayer mats to prospective voters. That vote buying existed in a small Indonesian town was unsurprising, however, two things stood out at the time. First, the people who accepted these items were poor by any reasonable measure, but they weren't the poorest people in the area. Street vendors and stall owners were present, not seasonal workers from the fields (Scott Reference Scott1969, 1148).Footnote 1 Why were the poorest citizens missing? Second, the costs involved for both the campaigns and the citizens were not trivial. Campaigns had to procure and distribute items across villages, even up into the mountainous regions of Java. Once goods were accepted citizens had to transport them home, which can be costly for those who don't have their own private transport. Given this, why didn't they just distribute cash?
The extant literature on campaign targeting doesn't explain this yet. It assumes the cheapest votes to buy are from the poorest citizens, who are targeted as a result. For example, explanations rooted in clientelism focus on the iterated contact between patrons and clients over time (Hicken Reference Hicken2011; Kitschelt and Wilkinson Reference Kitschelt and Wilkinson2007; Auyero Reference Auyero2000). In this framework, the patron learns who to target because they slowly gain knowledge about each client over time, presumably including their financial situation and their preferences for different types of transfers (cash or in-kind). In Indonesia, however, the traditional political structures that might sustain these relationships long enough to obtain individualized information about voters are eroding (Buehler, Reference Buehler2009). When there is discussion about different transfer types, explanations tend to overlook economic explanations in favor of cultural or sociological ones (for example, see Vel Reference Vel2005).
Studies rooted in political economy explain who gets targeted by the ideological positions of voters relative to parties (for example, see Stokes et al. Reference Stokes, Dunning, Nazareno and Brusco2013; Nichter Reference Nichter2008). However, in Indonesia political parties are not easily differentiated along an ideological spectrum nor is attachment to political parties particularly strong (Pratikno 2009; Mujani and Liddle Reference Mujani and Liddle2010). Moreover, these models do not attempt to differentiate between transfer types, they simply assume all transfers are perfect substitutes. How then, does one explain targeting patterns in countries like Indonesia, where many parties are not ideologically distinct and where traditional political networks are eroding? This article argues that there are two forces at play that explain who gets targeted, and together they produce to a curvilinear relationship between a person's income and whether they are targeted, rather than the strictly negative correlation commonly described in the literature.
The first force at play originates from campaigns wanting to reduce the costs of distributing items to voters. In practice this means they distribute items in areas, such as traditional markets, where they can reach a lot of people at once, which minimizes the distribution cost for each transfer made. Street vendors are well positioned to accept transfers from campaigns as they are likely to be working in the market on any given day, but seasonal workers in the fields, maids working in homes, and those whose work is done away from concentrated population areas can be missed if they aren't shopping at that moment. As a result, the campaigns desire to reduce the cost of distributing goods creates an entry barrier to receiving transfers from a campaign, which suppresses vote buying at extreme low end of the income distribution. This force operates at the campaign level.
The second force at play affects targeting patterns at the individual voter level. Specifically, in-kind transfers improve the ability of campaigns to target low-income voters because they impose a small cost on the recipient, which reduces the net value of the transfer to the voter because the transfer is subject to the law of diminishing marginal utility. By placing a small cost on potential voters, higher income voters screen themselves out of accepting in-kind but not cash transfers.
Put together, this article shows that the relationship between incomes and accepting transfers from campaigns is curvilinear, increasing initially as work-related barriers are removed and costs associated with accepting transfers are reduced. The relationship then decreases as the value each voter places on transfers decreases, even as costs also reduce. This contrasts with vote buying literature, which generally finds a strictly decreasing relationship between income and vote buying (for example, see Jensen and Justesen Reference Jensen and Justesen2014).
The empirical part of this article utilizes original survey data collected from two mayoral elections in Central Java by the author. Indonesia is an advantageous place to survey the presence of vote buying, because Southeast Asian democracies tend to report its occurrence in higher numbers than other countries (Schaffer and Schedler Reference Schaffer and Schedler2007). Specifically, one rural and one semi-urban regency in Java that held elections simultaneously and were geographically proximate were surveyed. As a result, the theory and results presented here are limited to rural areas and small towns; they do not extend to large metropolises like Jakarta or Surabaya. Javan regencies were chosen because the island contains almost 60 percent of Indonesia's population (Badan Pusat Statisik 2014).
Regency elections were chosen for a number of reasons. First, this level of government is of interest because more than 25 percent of all public revenues are transferred to and spent by them (Rasyid Reference Rasyid, Aspinall and Fealy2003, 67–8).Footnote 2 Moreover, regencies have a substantial amount of autonomy from the central and provincial governments on how to spend these funds. Also, regency-level elections are generally non-ideological (Pratikno 2009; Buehler Reference Buehler2009; Buehler and Tan Reference Buehler and Tan2007), and finally, the population in this part of Java is relatively homogenous, allowing the study to focus on individual voters, rather than groups of voters separated by visible cleavages, a common factor in vote choice (Lipset and Rokkan Reference Lipset and Rokkan1967). Note that, within the Indonesian government, regencies are the level of government that sit below the central and provincial governments, but above the sub-district and village governments.Footnote 3 The closest comparison in the United States would be to counties and cities, with the caveat that cities are geographically separate from counties—cities did not sit inside counties but next to them.
This article uses a survey because it provided the means to collect disaggregated data capable of examining the theory proposed here as well as alternative theories, and to assess the validity of key variables in the analysis. The results outlined in the following sections should be of interest to political scientists studying vote buying and clientelism because they suggest microeconomic considerations are included in the mental calculus of individuals voters when decide whether to engage in vote buying. For the spatial models found in this literature, the results suggest that a fuller understanding of various parameters often held constant in formal models have interesting variation of their own (Nichter Reference Nichter2008; Stokes et al. Reference Stokes, Dunning, Nazareno and Brusco2013).
The remainder of the article will unfold as follows. First, previous studies of voter targeting in the literature will be discussed, followed by a short discussion of the use of in-kind versus cash transfers in the economics literature. Second, the theory will be laid out, possible alternative explanations will be considered, and empirical implications identified. Third, the case selection and survey will be outlined in detail and its results analysed. Finally, the article concludes with a summary of the study's theory and main findings, and some unanswered questions are identified for future research.
REVIEW OF THE LITERATURE
The research questions presented here deal with two separate, but related topics: who do campaigns target and what benefits do they distribute. The canonical targeting studies in the distributive politics literature often approach the topic from the perspective of the party or candidate. The original debate was concerned with which blocks of voters were targeted by campaigns for redistribution: blocks of core constituents or blocks of swing voters (Cox and McCubbins Reference Cox and McCubbins1986; Dixit and Londregan Reference Dixit and Londregan1996; Lindbeck and Weibull Reference Lindbeck and Weibull1987). Other work analysed targeting by geographic areas, rather than typologies of voters, but also aggregated individual voters to their geographic characteristics for analysis (Calvo and Murillo Reference Ernesto and Murillo2004). In all of these studies the theoretical focus is on targeting blocks of voters with resources in exchange for electoral support, not individuals within those blocks.
More recent work shifts the focus from targeting groups to individual voters. These papers come in two varieties. One set draws on the classical spatial voting framework to explain vote buying dynamics (Stokes et al. Reference Stokes, Dunning, Nazareno and Brusco2013; Nichter Reference Nichter2008; Stokes Reference Stokes2005). The other draws on studies in the behavioral sciences of how reciprocity effects decision-making (Sobel Reference Sobel2005; Finan and Schechter Reference Finan and Schechter2012). Behavioral theories argue local political brokers target those voters who get satisfaction from acts of reciprocity. While reciprocity may be at play in Indonesia to some extent, it fails to explain the microeconomic variation described in this article. And while the theories rooted in spatial voting partially explain the socioeconomic variation, they also identify targeted voters based on their ideological placement, making them incomplete descriptions of targeting patterns. As the reader will see below, however, spatial models do provide a useful foundation from which to build a more complete theory of vote buying.
Political campaigns distribute various types of benefits to voters. To understand distributive politics in its entirety, one has to place individual benefits transfers with this broader context (Kramon and Posner Reference Kramon and Posner2013). Benefits distributed by campaigns can take the shape of public employment (Calvo and Murillo Reference Ernesto and Murillo2004), individualized access to state resources (Auyero Reference Auyero2000), direct cash transfers (Kramon Reference Kramon2016), or tangible goods distributed from campaigns to individuals or groups (Vel Reference Vel2005). The one characteristic uniting these benefit transfers is that campaigns can discriminate or exclude at least some individuals from consuming them. In economic terms, these benefits must be either private or club goods, not public goods (Kitschelt and Wilkerson Reference Kitschelt and Wilkinson2007).
This project focuses on a form of distributive politics immediately preceding an election. During this time, political campaigns visit neighborhoods and busy public places, holding events to solicit support from potential voters, and they distribute targeted benefits to individual voters at each stop. The benefits distributed are private goods and can be either in-kind or cash. This is important because the economics literature suggests that while providing cash is more efficient to distribute and should produce more satisfaction to those voters who receive cash, transferring in-kind goods allows for what economics call “self-targeting.” A mechanism where costs are applied to a broad group of people so only those individuals willing to pay a cost opt into receiving that benefit (Currie and Gahvari Reference Currie and Gahvari2008). Since one's neighbors may have difficulty estimating one's income or consumption (Alatas et al. Reference Alatas, Banarjee, Hanna, Olken and Tobias2012), a political campaign strategy that utilized self-targeting would theoretically put campaign transfers in the hands of those individuals who value the targeted benefit the most.
A THEORY OF MICROECONOMIC TARGETING
Calvo and Murillo (Reference Ernesto and Murillo2004) show that when benefits are set across locations, economic inefficiencies will be present because there will be people who are willing to support the candidate for less than the value of the transfer they are offered. While their study focuses on the distribution of public jobs, the logic also applies in Indonesia because in the elections studied in this article, voters who lived on the same block or attended the same event might all have been given set benefits, for example approximately three dollars in cash or they might have all been given 2.5 kilograms of rice and ten eggs. Generally, one didn't see much variation in the benefit given when they attended the same political event or lived on the same street. As with setting a flat public wage, the distribution of resources using a set benefit for a given location will lead to microeconomic inefficiencies. These inefficiencies, in turn, could generate variation in whether benefits are accepted by individual voters, so campaigns are likely overpaying at least some voters for their votes. If this is true, how might a campaign further differentiate the price of votes below the neighborhood or street level? In other words, how might a campaign distribute goods to reach those who value them the most?
Recall that spatial models in the literature only include one term to represent private transfers. This term can represent the transfer of a private good or simply cash. However, economic theory tells us that cash will be more efficient than in-kind transfers because it is fungible. People can get whatever they want with cash. Therefore, absent perfect information about voters’ individual preferences across different benefits, a set transfer of cash to a group of people will be more efficient in raising their wellbeing because they can use that money for their most desired purpose. There will be individuals who highly prize whatever good is being distributed—including eggs, rice, oil, and prayer mats—but there will also be people who are offered goods that would prefer cash making the private distribution of goods by campaigns to these individual voters inefficient. Given this logic, why would a campaign ever target voters with in-kind goods?
There are a number of possible answers to this question. First, they may get a bulk rate on staple goods or they may procure them from leakage in government programs. If this is the case, however, distributing these goods still leads to the microeconomic inefficiencies described above. Put differently, this explanation only addresses why a campaign might supply in-kind goods, not whether an individual voter would be more willing to accept them from a campaign. If there is empirical variation at the individual voter level, this explanation remains incomplete. If the type of transfer used by campaigns were strictly a supply-side story, campaigns should overwhelming distribute in-kind goods because each in-kind transfer would cost the campaign less than the value placed on the transfer by the voter. Yet they do not: approximately 39 percent of respondents accepted cash in our survey, while 35 percent accepted in-kind goods in the survey data used here (see Appendix 1, Table 2).Footnote 4 This suggests that campaigns do take voter preferences into account. Successful targeting strategies require active participation by those being targeted.
A second explanation is that transferring cash might be seen as a violation of social protocol or undermine norms of reciprocity between voters and the campaign. The logic here is that providing cash to someone in exchange for electoral support has a very formal, transactional feel to it and undermines trust between campaigns and voters. Instead, to maintain the perception that a personal relationship exists between both actors, campaigns provide goods that could be interpreted as a gift. This gift could even generate feelings of reciprocity (Finan and Schechter Reference Finan and Schechter2012). However, if this perspective were pervasive in the elections studied here, then one would expect to see more in-kind goods changing hands than cash, but again, more respondents accepted cash than in-kind goods in these elections. A t-test assuming the difference between these two averages is zero generates a p-value of 0.09 (not shown). While this isn't strong evidence these two means are different, the direction of the difference contradicts this explanation as cash transfers outnumber in-kind transfers. If providing cash to voters violated local norms, one would expect the percentage of citizens who accepted cash to be much lower than those who accepted in-kind goods.
Given this evidence, it appears that campaigns do incorporate voter preferences into targeting strategies. They attempt to distribute what voters themselves prefer, and that these preferences are economic, not just normative, in nature. Given this, how can campaigns leverage the type of goods given out before elections to better target voters?
The overwhelming majority of houses in Indonesia use rice, oil, and eggs on a daily basis so one might assume these items are close to interchangeable with cash transfers. However, there is a cost borne by the person accepting these goods, including the cost of transporting the goods home, possible spoilage or breakage, and differences in preferences between that good and cash, among other things. Even if in-kind goods are perfect replacements for cash, which is only true if that individual was going to buy that good with their next purchase, there remain costs associated with accepting them. While this cost may be small, the benefits involved in vote buying operations are also small in absolute terms—the cost doesn't need to be high for it to be a large enough proportion of the overall benefit to impact an individual's decision to accept the in-kind good or not. The reader should note that buying votes with cash imposes no such costs on the voters accepting it; cash can be transported in one's pocket, it won't spoil, and it allows the voter to buy whatever goods they want with it.
Applying this logic to understand who accepts transfers from campaigns, and thus who can be targeted, requires one more step. If one assumes poorer voters value transfers at higher rates, and that their marginal benefit of those transfers is higher than relatively wealthier voters, then the costs associated with in-kind transfers from campaigns to voters should screen out those relatively wealthy voters when in-kind goods are offered to them, but not when cash is offered. Due to differences in cost between accepting in-kind and cash transfers, the following theory focuses on the microeconomic calculus of accepting in-kind goods.
Figure 1 outlines this logic in simple economic terms using a stylized example of two individuals at different points along a marginal utility graph. The y-axis represents the total utility someone gets from a given transfer, while the x-axis represents the value of that transfer in dollars. Following basic microeconomic theory, the function is increasing overall, but decreasing for each additional unit in net value.
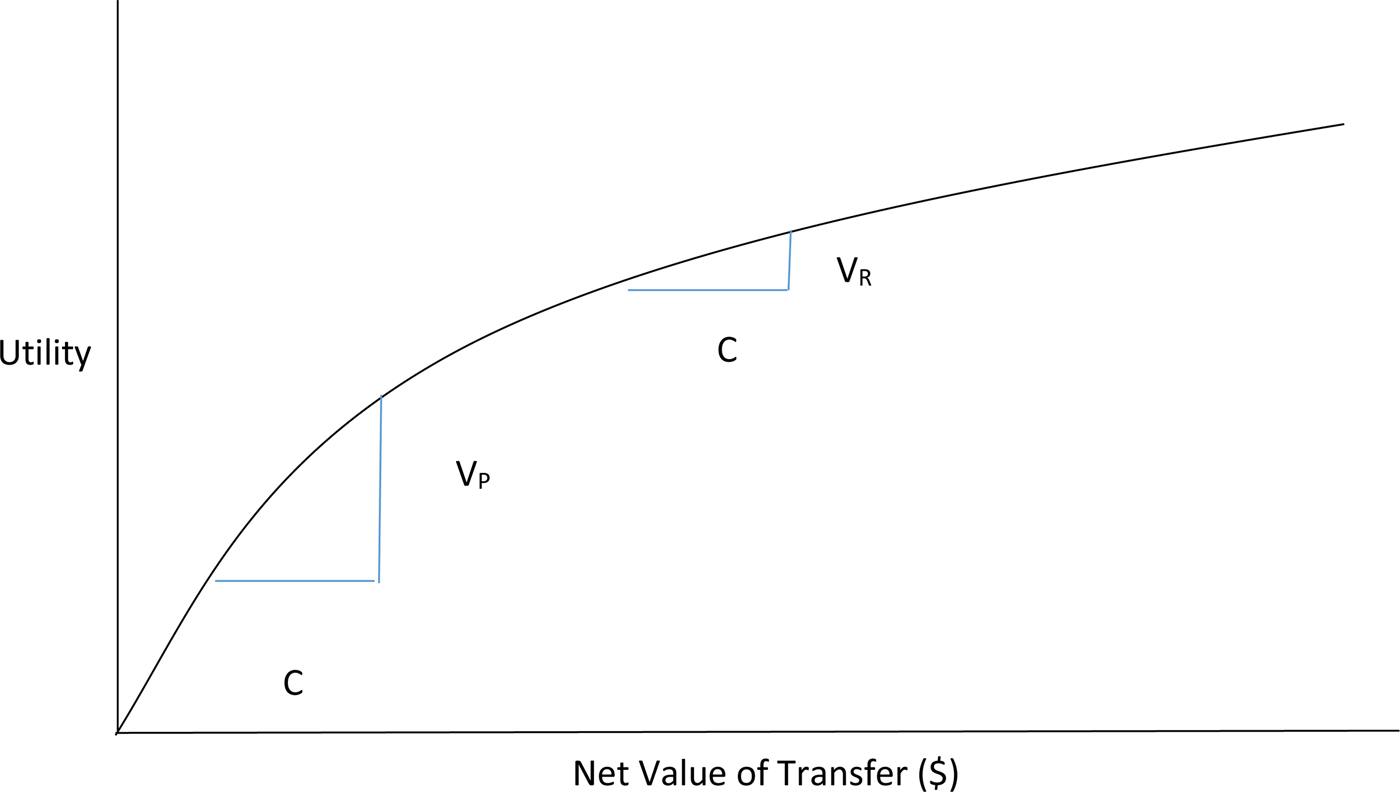
Figure 1 Marginal Utilities for Accepting In-Kind Transfers with Fixed Costs
The vertical line labeled VP and VR represents the value of a cash transfer from a campaign to a poor and rich individual respectively. Consistent with diminishing marginal utility, VP > VR because the transfer if more valuable to the poorer individual. This value is costless in the sense that it requires no additional effort to accept or has no chance of diminishing in value (e.g. unlike food spoilage). However, after adding a constant cost C, one sees that the net utility for the rich person is negative because C > VR, but remains slightly positive for the poor person as C < VP. The decision to accept or reject the goods depends on whether the total utility remains positive after incorporating the cost. This visualization exercise highlights that small costs can produce negative overall utilities for richer voters to accept goods but not necessarily for poorer voters. This remains true even though the absolute loss in utility is much greater for the poorer individual.
Although the example laid out in Figure 1 holds the costs associated with accepting goods constant, the example can be extended to incorporate different types of voters with varying costs. Voters with higher incomes likely have lower costs for transport and have less food spoil given their access to motorbikes, cars, refrigeration, and other amenities. Figure 2 builds on the previous example by adding a middle-class voter whose value placed on the transfer is VM. It also replaces cost C with two different cost terms, CW and CM, which represent the costs associated with accepting an in-kind good when the person must walk and when they own a motorbike, respectively. CW is the thin horizontal line and CM is the thick horizontal line. Note that CM is drawn over CW so CW is approximately twice the length of CM.Footnote 5
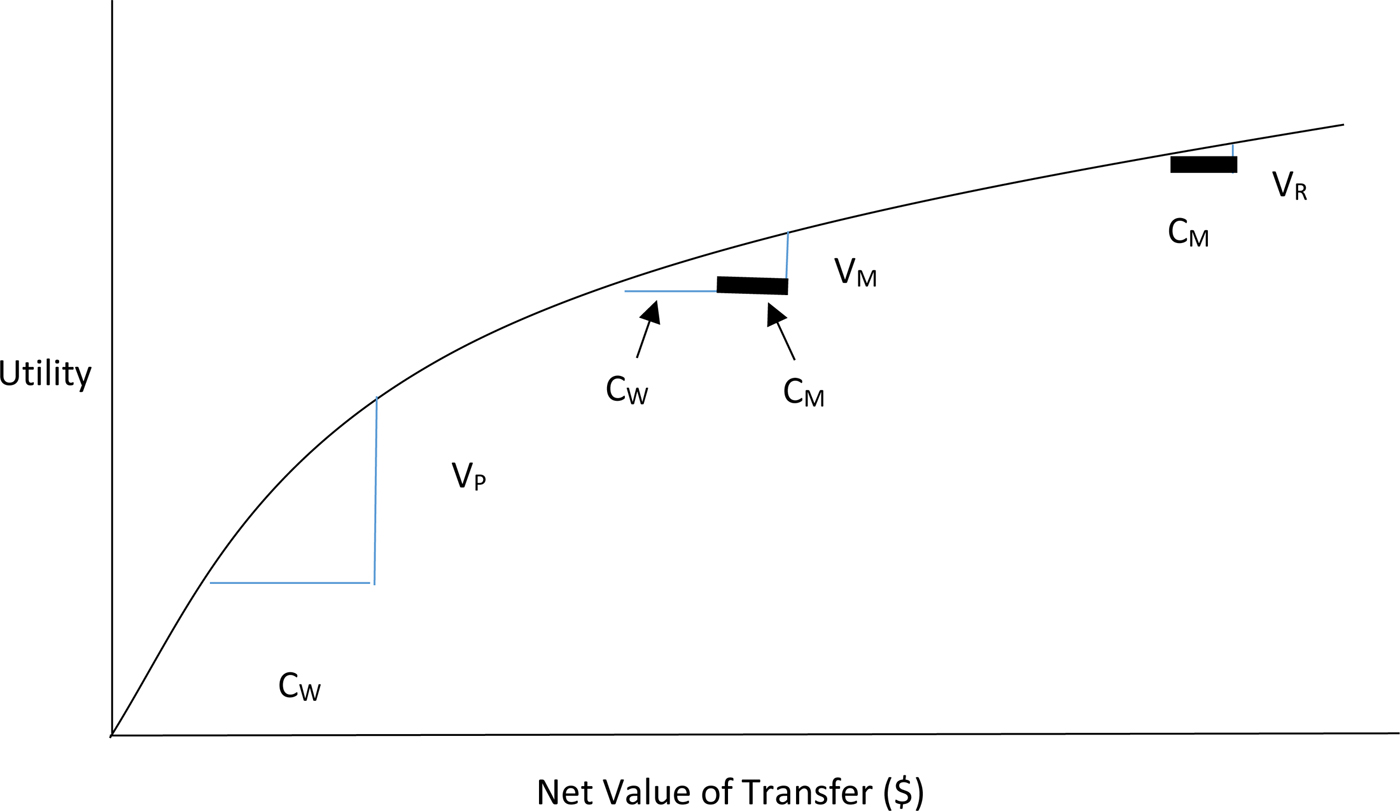
Figure 2 Marginal Utilities for Accepting In-Kind Transfers with Varying Costs
Recall that the purpose of this exercise is to illustrate when a prospective voter decides to accept an in-kind transfer from a campaign. They do this when the costs associated with accepting said transfers are less than the marginal utility (or value) of accepting the good. For the middle-class voter without a motorbike, they accept when VM > CW. Similarly, they reject the in-kind transfer when VM < CW. In Figure 2, the middle-class voter who walks for transportation clearly rejects the goods, however, it is not clear whether the middle-class voter with the motorcycle accepts or rejects the in-kind transfer. This is because Figure 2 was drawn so VM = CM, which means that VM > CM for all voters to the left of the middle-class voter's location, while VM < CM for all voters to the right of the same location. Any voter to the right of VM with a motorbike, no matter how close to that point they are located, will reject the transfer. The opposite is true for any voter to the left of this point. Moreover, the rich voter represented on the right by VR clearly rejects the in-kind transfer because VR < CM, despite owning a motorcycle.
Now, given how far to the right the rich voter is, the obvious question becomes what is the cost of accepting in-kind transfers if one has a car? Surely it is less than for those voters who have motorbikes. For the voter with the car, the same logic applies, but the indifference point moves further right along the marginal utility curve. Theoretically there is still a smaller cost CC (the cost for a voter with a car) for which a new VR would be equal as well. At this indifference point, those voters to the left of it accept the transfer while those to the right reject it. However, this question misses an important point that is implicit in the marginal utility curve itself. As one moves further to the right along the curve, the additional value received from accepting any good approaches zero. If VR ≈ 0, then any cost will lead the rich voter to reject the good, even rich individuals with a car.
These stylized examples are simply meant to demonstrate the underlying dynamic at play when voters either choose to accept or reject transfers from campaigns. The reader should notice these predictions are probabilistic. It is still possible for a rich person to accept an in-kind transfer and for a poor person to reject a similar transfer, but on average the relationship with income should be negative because richer voters will be screened out in this framework, even when their costs of accepting goods is lower than those of their poorer counterparts. It also demonstrates that the spatial models in the current literature to explain vote buying, rather than being discarded, can be further revised to incorporate this channel for targeting. The point of this analysis isn't that each individual voter calculates their individual marginal utilities in their head and decides whether they should accept the transfer or not. It is subtler than that. When someone is offered cash, they can simply accept it, put it into their pocket, and convert into whatever that individual chooses at a later date. However, when someone is offered an in-kind good, such as five kilograms of rice or a prayer mat, the higher income person is more likely to question whether they need more rice at this very moment or whether they need an additional prayer mat to go with the others they have at home. It also leads to one very simple prediction: in-kind transfers should better target poorer individuals because richer voters will screen themselves out.
The reader will note that this prediction is consistent with the state of the current literature. It simply provides micro-foundations to explain why in-kind goods, rather than cash, should drive the association between vote buying and poverty. It also explains the negative slope of the curvilinear relationship between income and vote buying proposed in the opening paragraphs. However, it doesn't completely explain the initial uptick.
Recall that missing from campaign stops were day laborers, seasonal rice field workers, and other citizens at the very bottom of the income distribution. When a campaign stops at a market or some other place with a concentrated population, vendors, rickshaw drivers, and others one would rightfully describe as poor, have the opportunity to interact with a campaign and receive gifts or cash. These people are there every day, so they have a high chance of being present when the campaign stops by. In other words, one can think of having one's vote bought as some probability function of being present when votes are being bought, with day laborers, fieldworkers, and maids the least likely to be present on any given day due to the nature of where their work occurs. This is tied to income because on average, those who work as laborers or seasonal field workers may take home similarly small amounts per day, but they may work fewer days on average than those vendors who own stalls in the local market.
It is important to recognize that this does not mean that agricultural workers or maids will never interact with campaigns or be present when goods are distributed. The argument for this upward swing also relies on a probabilistic logic. For example, maids often visit markets, where a number of campaign events take place. They may even visit the market every day if they have to buy food and other ingredients to cook for their employer.Footnote 6 If a campaign distributed goods in the morning during their trip to the market, maids may be present to accept something from the campaign and do so. At some point, however, they have to return to their employer's house to cook. If that campaign decided to visit the market in the afternoon, however, after the maid returned to cook at their employer's house, the maid would not have been present to accept a transfer from the campaign.
Compare this maid's probability of being present at the market to accept a transfer to a small vendor's probability of accepting goods at the market. That vendor is likely there most—if not all—of the time the market is open. They may go home if their product sells out, but they will generally be present from the time the market opens until it closes in order to increase their income by selling as much of their inventory as possible. Given this, the probability that they will be present when campaigns stop by will be much greater than that of the maid, who only spends an hour at the market. One can even extend this probabilistic logic to variation across different vendors. Since inventory costs money, those vendors with larger inventories will take longer to sell their goods—and thus be less likely to close up shop and go home—than those vendors with smaller stalls selling fewer goods or food. Vendors with more inventory also likely have higher earnings since they can sell more volume so the probability of being present to accept transfers from the campaigns is higher for vendors with higher incomes.
There is one last thing to note about this hypothetical maid. Figure 2 explored how a voter's costs can decrease change as one has more income, but there are additional implications for a maid who returns to cook for her employers. First, she has to bring back the ingredients needed to cook for that employer. Her job depends on this. Even if she is present during a campaign's trip to the market, she has to bring any goods she accepts from the campaign back to her employer's residence while simultaneously carrying the ingredients for her employer's meal. Then she has to carry her campaign goods home at the end of her work day. Therefore, even if she is present, the cost of accepting the goods may be too much at that moment to accept in-kind goods from the campaign. In this scenario, one could imagine increasing the cost CW in Figure 2 for this particular maid at this particular time. However, one could also imagine this same exact maid visiting the market in the afternoon, after she is done with her work, buying something for her own house and accepting an in-kind good from the campaign because she only has to carry the good home and she can choose to buy less at the market for herself if she wishes. An option she doesn't have when shopping for her employer. Therefore, even if she is present, she may still reject the campaign goods while she is working, but not while she is shopping for herself on her own time.
To see whether these stories are plausible, in the following sections I discuss the case selection and context of the elections studied, then analyse and discuss original survey data from two elections in Indonesia where vote buying is prevalent.
INDONESIAN CONTEXT
Java Island contains Indonesia's capital and almost 60 percent of Indonesia's 240 million citizens. Central Java, where this research was done, is the third most populous province in Indonesia, with approximately 32 million residents in 2013; the only two provinces with larger populations are West and East Java (Badan Pusat Statistik 2014). Moreover, Jakarta and Surabaya are Indonesia's two largest cities, located on Java, and they are important generators of economic activity in Indonesia. As a result, Java drives much of Indonesia's political and economic life.
This study chose to select elections in Central Java because it had the highest province-wide poverty rate on the island, at approximately 15 percent in 2013, despite being slightly smaller than West or East Java (Badan Pusat Statistik 2016).Footnote 7 In 2010, the poverty rate for all of Indonesia was slightly lower at 13.3 percent, so Central Java was close to the national average (Suryahadi et al. Reference Suryahadi, Raya, Marburn and Yumma2011, 70). Since poverty remains the most important factor for politics of this type, selecting elections in high poverty regencies ensured sufficient variation across survey respondents’ behavior (Scott Reference Scott1969; Hicken Reference Hicken2011; Jensen and Justesen Reference Jensen and Justesen2014). Moreover, Central Java has education levels nears the Indonesian average. Its secondary school enrolment ratio of approximately 65 percent is relatively close to the national average of 62 percent (Miranti Reference Miranti2011, 101).Footnote 8 In short, Central Java was identified as a prospective location for this research because it is located on Java and has typical education and poverty indicators for an Indonesian province.
Tegal was selected for more practical reasons. Specifically, there were two elections occurring simultaneously in neighboring regencies during the research period, one semi-urban and one rural regency. Tegal was chosen over Magelang Regency, which also had an election during the research period, because it is the home of one of the world's largest Buddhist stupas—Borobudur Temple—making it an outlier as its tourism-based economy is distinct from most regencies in Indonesia except Bali and possibly the western part of Flores Island, where visitors to Komodo National Park stay.
Tegal is a small city on the north coast of Java, located along the Highway 1 between Jakarta and Semarang, the capital city of Central Java and a major port. A second highway branches off at Tegal and leads over one of Java's mountain passes to the southern coast of Java, which connects with another major highway. Due to its location, Tegal sees a large number of trucks and other travelers pass through on a regular basis and there are a number of small factories along Highway 1. Most of the population of Tegal, however, is inland in the rural regency, which consists of rice paddies and vegetable farming in the higher elevations where the temperatures are cooler. Approximately 47 percent of the rural regency's landmass is rice paddies (Badan Pusat Statistik Kabupaten Tegal 2013) while 22 percent of the urban regency's landmass is used for agriculture (Badan Pusat Statistik Kota Tegal 2013).Footnote 9
This article begins with the premise that the current models for vote buying are insufficient to explain targeting in Indonesian elections. This rests on three pieces of evidence. First, in local Indonesian elections there are no major cleavages within localities for parties to form around. While many cleavages exist in Indonesia more broadly, they rarely exist in the small, homogenous jurisdictions where regency elections take place. The elections studied here in Kota Tegal and Kabupaten Tegal fit this profile.
One common cleavage in Indonesia is religion, however these two elections were conducted in areas where the overwhelming majority of the population was both Muslim and ethnically Javanese. This is supported by the survey used in the article, which shows about 99 percent of respondents in the sample are Muslim (see Appendix 1). However, while the Islamic community in Indonesia is diverse in its own right, there are generally two groups recognized as the largest strains of Islam, often referred to as modernist and traditionalist Muslims (Burhani Reference Burhani2013). A political cleavage within Islam remains possible because these two groups are affiliated with two separate political parties. To address this, a question on the survey used in this study asked all respondents who identified themselves as Muslim whether they identified with either of these groups. The overwhelming majority of respondents in the survey who identified as Muslim, approximately 85 percent, said they identified with the traditionalist group, Nahdlatul Ulama, while only 9.5 percent they identified with the modernist group Muhammadiya. The remaining respondents indicated they didn't identify with either.
Second, party ideologies are generally uninformative in Indonesia, especially for local elections. Area studies scholars argue that the relationship between parties and candidates in local elections is mostly pragmatic. The candidate's decision to run under the banner of a given party is based on convenience and on meeting minimum threshold requirements for parties to field a candidate, rather than the candidate's political ideology. Specifically, a political party must hold at least 15 percent of the seats in the regency-level legislature or have received at least 15 percent of the votes in the last election to field a candidate. Parties that do not meet this requirement by themselves they can form coalitions so that the combined number of seats or votes surpasses 15 percent (Buehler Reference Buehler2009; Buehler and Tan Reference Buehler and Tan2007). A voter cannot simply look at the party name next to the candidate's name and know which policies the candidate is likely to implement once in office. Even in national elections where party politics are thought to be stronger, survey data indicate that party identification is becoming weaker over time (Mujani and Liddle Reference Mujani and Liddle2010).
Third, in regency-level elections, Pratikno (2009) finds that the rules for fielding a candidate led to approximately 70 percent of the first 192 elections to be supported by a coalition of parties, rather than a single party. He lays out a two-by-two typology of party ideology—with Islam–Secularism on one axis and Elite–Populist along the other axis—and finds that those coalitions did not follow any inherent logic. He concludes that party coalitions are based on the need to meet the minimum requirements for fielding a candidate, rather than on any ideological beliefs shared by coalition parties.
To reiterate, these pieces of evidence are important contextual factors because the distributive politics targeting literature utilizes a spatial framework to explain behavior, which assumes that voters can place themselves along an ideological spectrum and identify the distance between themselves and the candidates.Footnote 10 However, in the Indonesian context described above, the ideological component effectively disappears, or is too noisy to transmit much information. If a voter cannot identify where the candidate's beliefs sit along some ideological dimension, they cannot assess the distance between their own beliefs and the candidates’ beliefs to decide which candidate best represents them, a key factor in identifying who gets targeted in these models.
SURVEY METHODOLOGY, SOCIAL DESIRABILITY, AND LIST EXPERIMENT
This article uses data from an original survey conducted in two regencies in Indonesia, Kota Tegal and Kabupaten Tegal, both of which are located in the province of Central Java. Respondents were randomly selected from voter lists compiled by Indonesia's General Elections Commission (Komisi Pemiliahn Umum). In each regency, the election commission conducts a door-to-door census in the months prior to an election that captures all of the Indonesian citizens over 17 years of age whose official residence is that address. Those names are added to the official voter rolls, which are kept by poll workers at each polling station on Election Day. This census is a list of all possible voters in each of the elections studied, so a random sample drawn from these lists produces a representative sample of the electorate for that election, which is exactly what was done to generate the sample for this survey. Note that while a similar number of respondents were drawn from each regency, the two regencies have different populations. Therefore, inverse probability weights were constructed and applied to the analysis (See Appendix 2 for more details on the survey methodology).
Although common in Indonesia, vote buying is an illegal activity, so direct survey questions on vote buying may not be valid measures of the phenomenon. In their research in Nicaragua, Gonzales Ocantos et al. (Reference Gonzales Ocantos, de Jong, Melendez, Osorio and Nickerson2012) showed that social desirability bias can impact analysis of this kind. In their survey, less than 5 percent of respondents responded yes to having received gifts from a campaign in their study, however a list experiment revealed that approximately one in four respondents had done so. Given this result, they warn that direct measures of vote buying could be misleading; but is this specific to Latin America?
To assess whether social desirability bias is an issue in this data, a list experiment was also conducted to gauge whether under-reporting was a serious issue here, and if so, what its magnitude was. Respondents were randomly allocated into two groups. The first group was asked to count and report the number of individuals who got involved in politics, whether they discussed with a friend who they planned on voting for, and whether they donated money to a candidate or worked for that candidate without compensation. The treatment group was asked to count and report on these three options plus whether they got money or in-kind goods from a campaign.Footnote 11 By randomly allocating respondents to control and treatment groups, the list experiment allows one to estimate the percentage of people who responded in the affirmative to omitted option in the control group by taking the difference between the two group means. In this case, the omitted response in the control group was whether the respondent got money or in-kind goods from a campaign (see Appendix 4 for more details on the list experiment methodology).
The results from the list experiment can be seen Table 1. The difference in means between the control and treatment groups is 0.51 and significant (t-statistic is -5.3, p < 0.1). Since the other three counts are statically equal across both groups, the experiment estimates that approximately 51 percent of survey respondents accepted either cash or some other good from a campaign before the election, compared to 47 percent of respondents who said so through direct questioning. This comparison shows that receiving cash or goods was underreported as the literature suggests, however, the level of underreporting in this data is only about 4 percent. This result is consistent with the literature that says Southeast Asian democracies tend to report vote buying in higher numbers than other regions (Schaffer and Schedler Reference Schaffer and Schedler2007). To the extent that social desirability bias exists in Indonesia, it is less of an obstacle when studying vote buying than in other regions.
Table 1 Percent of Respondents that Accepted Transfers

EMPIRICAL ANALYSIS
Now that minimal measurement error has been found in the dependent variable, the two principal hypotheses can be tested. There are two dependent variables in this analysis, whether someone accepted money and whether someone accepted in-kind goods from a campaign before the election. The survey was designed to record all types of transfers from each campaign to each respondent. It asked the respondent whether they had any contact with someone from each of the campaigns. Then if the person said yes, they were asked a series of additional questions including whether they accepted cash, and how much, or any in-kind goods from the campaign, and what they were. The dependent variable was then coded twice, once for accepting cash transfers and once for accepting in-kind transfers. In both instances, the variable was coded one when the respondent accepted the transfer and zero if they did not.
The theory presented here makes a few key assumptions that need to be considered in the analysis. First, as one's income goes up, the likelihood of accepting a gift from a campaign increases, due to barriers to entering the market for vote buying. Therefore, one would expect to see a positive coefficient on the variable recording the individual's income. However, the theory also rests on the assumption both these barriers decrease—due to both one's occupation and to lower costs from improved transportation or other amenities—and that there are diminishing marginal returns to private consumption as individuals move up the income ladder. Given this, the theory would also expect that including a squared income variable in the model would better fit the data and that this squared income variable should be negative. Moreover, one should expect to see this relationship between income and the outcome for in-kind transfers, but not for cash transfers. This would suggest that different types of transfers serve an economic, rather than social, function when campaigns distribute goods prior to elections.
One additional variable is included as a control. Hicken (Reference Hicken2011, 299) suggests that formal employment, which is likely correlated with income, could incentivize voters to pay closer attention to, and base their votes upon, policies rather than direct transfers. This is because those voters have a larger stake in public policy outcomes—for example tax policy—since those voters will pay a larger share into public revenues. Since individuals in formal employment are likely to earn more, the relationship between income and vote buying could be the result of this correlation. Including this control allows one to ensure that a negative relationship between income and having accepted any transfers from a campaign, isn't the result of having omitted this variable. Finally, a battery of other individual traits are included as controls to check the robustness of the relationship.
In Table 2 below, the models show the expected sign for the coefficients on both the income and income squared variables. The income variable has a positive coefficient for in-kind outcomes while the income squared variable has a negative coefficient. This implies that predicted probabilities increase at the lowest incomes before peaking, and then decreasing, as the theory outlined here suggests. The relationship between having accepted cash from a campaign and income remains insignificant however, just at the theory predicts.
Table 2 Weighted Probit Regressions

*p < 0.1; **p < 0.05; ***p < 0.01.
Note: The base outcome for these regressions is those voters who didn't accept cash or in-kind goods from any campaign. Employed indicates those respondents formally employed, Savings is measured in thousands of Rupiah, Age and Education are measured in years, and Mosque measures the number of times per week the respondent goes to the mosque.
The second set of models include a dummy variable for those respondents who were employed in a formal sector, which mainly consists of government workers, private factory workers, or someone employed at one of the local malls or chains. They show that formal employment is not driving the relationship between income and having accepted in-kind goods. The coefficients barely change, and they remain significant for all in-kind outcomes but insignificant for the cash outcome. Finally, the last two models include a number of control variables to see whether the relationship is dependent on a number of other factors, such as age, education levels, gender, attendance at religious services, number of children, and the amount of savings. The relationship holds despite including all these controls.
To more clearly see the relationship between income and targeting using in-kind goods, one can plot the predicted probabilities of accepting in-kind transfers by income. This is done to explore at which income-level the predicted probability peaks. Figure 3 shows that it does somewhere around nine million Rupiah per month, well above the sample mean and an income level that would put that resident in the upper quartile of Tegal's income distribution.
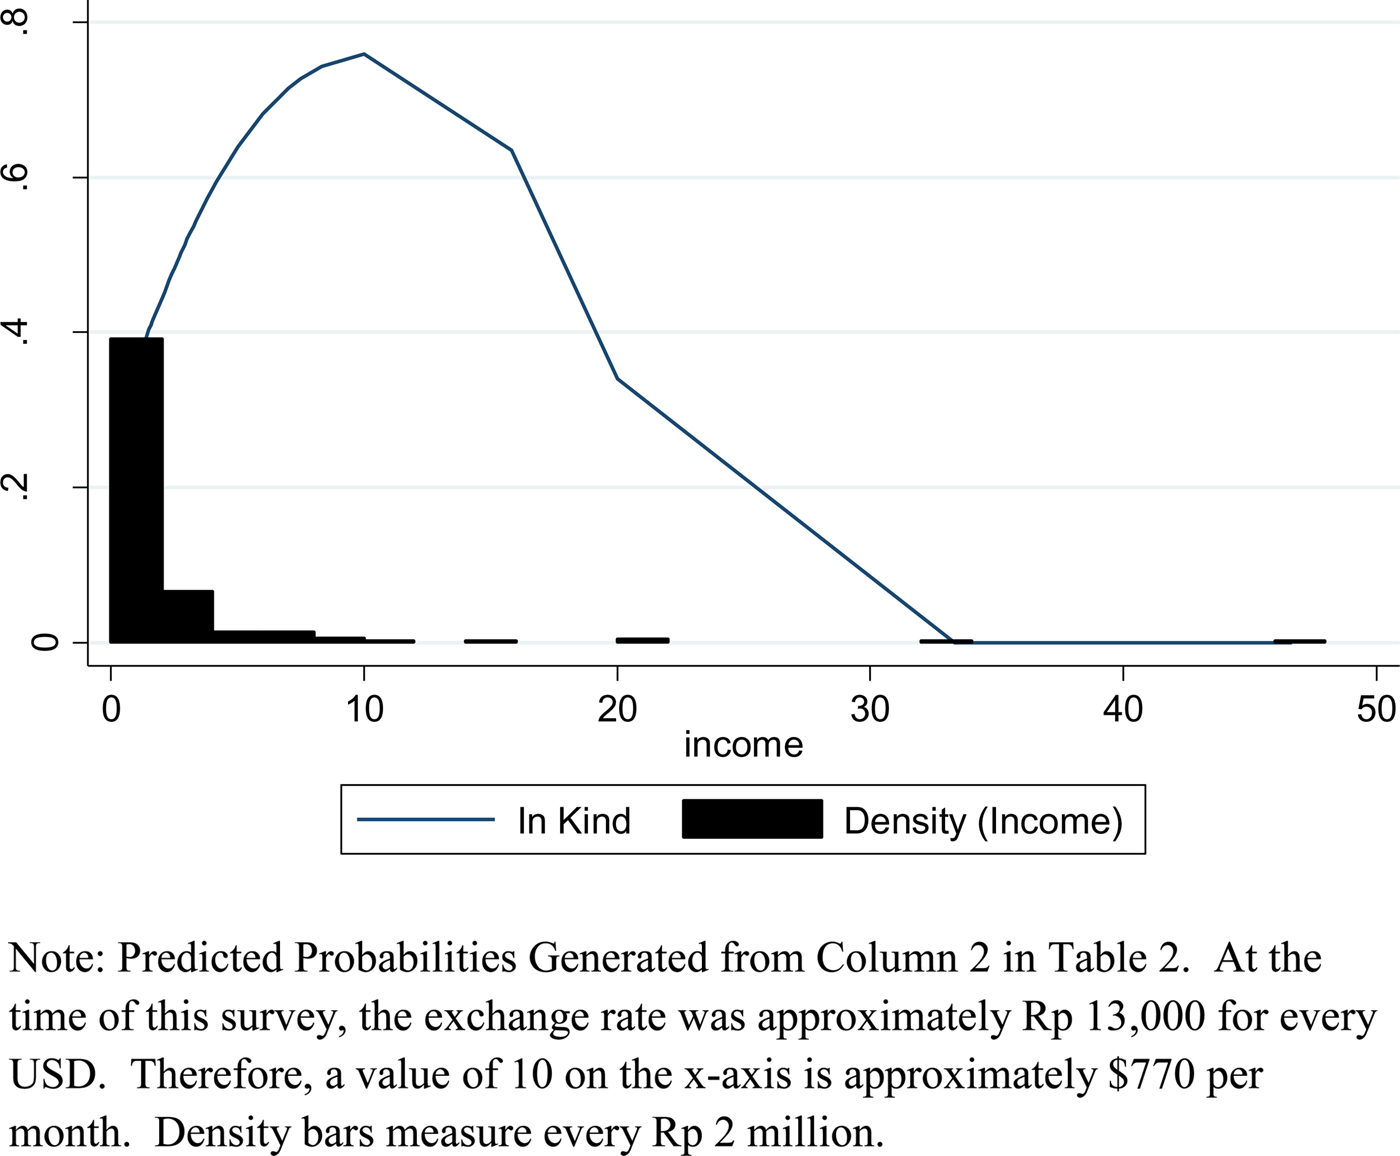
Figure 3 Weighted Predicted Probabilities across Income Levels
Individuals at the very bottom of the income distribution, who are assumed to be the most likely to sell their votes in the literature, do not accept transfers at rates as high as those individuals who had moderate to high incomes. One concern about these results is that they do not account for geographic effects, another is that they are being driven by outliers, especially is one looks at the density of income across the bottom of Figure 3. Each concern will be addressed in turn. If socioeconomic status and the type of benefits distributed cluster in locations, which supply-side explanations discussed earlier would suggest, then income may act as a proxy for geographic location. Recall that the comparative politics literature impresses the importance of macro-level targeting to low-income areas (Lindbeck and Weibull Reference Lindbeck and Weibull1987; Dixit and Londregan Reference Dixit and Londregan1996; Calvo and Murillo Reference Ernesto and Murillo2004). Campaigns therefore might be targeting areas that are generally poor, but missing the poorest residents because of geographic obstacles, such as the poor living in remote areas, rather than those outlined in the theory presented here. In the area studied here, this is generally the case with those living higher up Java's mountainous slopes, being poorer and difficult to reach due to crumbling infrastructure. The sub-districts themselves are quite diverse with concentrated urban areas, coastal fishing areas, agricultural areas with rice paddies, a military base, tea and other industrial factories, as well as high altitude mountainous area. To address this, area dummy variables were included for each of the sub-districts, three of which cover the higher altitudes and two of which cover the coastal fishing areas, in these two regencies. Next, to check whether these results are driven by outliers, the probit procedure is bootstrapped using 50 replications. Table 3 provides the results of two models that include area fixed-effects and two which bootstrap the probit procedure.
Table 3 Robustness Checks

*p < 0.1; **p < 0.05; ***p < 0.01.
Note: Probit regressions with dummy variables for each sub-district. In-kind dependent variable coded 0 for all respondents who accepted in-kind goods and zero otherwise. Cash dependent variable also coded one for all respondents who accepted cash and zero otherwise. Sub-district dummy coefficients not shown for fixed effects models.
Table 3 shows that all coefficients on income and income squared remain significant for the in-kind probit regression, yet none are significant for the cash regression, suggesting the original models are robust to area fixed-effects. In short, the geographic clustering of the poorest in remote areas is not what is driving the principal results in Table 3. When the procedure is bootstrapped, the income squared variable is marginally insignificant, indicating the downward slope of the curvilinear relationship is sensitive to high income outliers.Footnote 12 However, the initial upward slope is robust to this procedure. The reader should note that the cash acceptance coefficients for income in this regression are insignificant, as with all results presented here.
The results are also robust to multinomial regression models where the dependent variable is separated into those who did not receive a transfer, those who only received cash, those who only received in-kind good, and those who received both (Appendix 3, Table 2). The final category—respondents who received both cash and in-kind goods—mimics the results for in-kind goods only.
Note, to this point the dependent variable has included both individuals who did and did not have contact with a campaign in the dependent variables. This could accentuate the curvilinear relationship found between income and having accepted goods. This might be especially problematic if the vast majority of those individuals who did not have contact with the campaign were also at the low end of the income distribution. A simple bivariate probit regression (not shown) predicting campaign contact with income produces a positive and significant coefficient on income suggesting higher income voters were contacted more often (beta = 0.53, z = 2.63). Given this, the analysis is redone using a sample that includes only respondents who had contact with a campaign (see Appendix 5). If the theory is literally true, one would expect a strictly negative relationship between income and accepting goods. What is found however, is that the coefficient moves in this direction—the coefficient is cut in half—but the sign does not completely flip as one might expect in a complete model. Note, restricting the sample to those with contact in the campaign reduces it by about a third so including more independent variables further degrades the sample due to item missingness for individual intendent variables. This result suggests that contact is both related to one's income and that the relationship shifts in the predicted direction once one restricts the sample in this way. The fact that it does not do so completely suggests the presence of an omitted variable (owning a motorbike, for example) and the continued presence of high costs facing low income individuals as highlighted by the example above regarding the maid who accepts a campaign gift while shopping for herself, but not while shopping for her employer.
DISCUSSION OF RESULTS
This article argues that the poorest individuals did not receive cash or goods prior to the elections and that this was due to the nature of their work. Specifically, their work decreases the probability of being present when goods are distributed by campaigns, making them are less likely to receive transfers than citizens better off financially. A number of alternative explanations have been discussed, but others possible explanations remain. For example, farm laborers and other low-wage workers may not have been targeted because they are often from other regencies or it may be that laborers make up a small part of the electorate. If either of these are true, it may simply be inefficient for campaigns to target these workers. Fortunately, there are a number of questions asked in the survey that will help one assess whether either of these explanations seem likely.
Tegal, like many rural areas across the developing world, exports much of its indigenous labor. This is important point because campaigns might choose not to distribute transfers to the lowest end of the income distribution if many of those laborers are unable to vote, not because of the logic outlined in the theory here. Targeting these workers would waste campaign resources on non-voters. A look at Appendix 2, however, shows that survey response rates were adjusted because interviews with local civil servants in Tegal indicated that many of its permanent residents went to major cities for work, and this might push survey response rates downward. To assess whether the survey was getting an accurate representative sample, qualitative information was collected to understand why individual surveys were not completed. Each time an enumerator was unable to complete a survey, they were instructed to write in the comments section at the end why that survey wasn't completed. The responses were grouped into three refusal categories:
(1) Respondents who lived at the residence but whom the enumerators were unable to find at home.
(2) Respondents who worked/lived elsewhere but whose government paperwork—including their voter registration information—remained at the address in Tegal of their family.
(3) Respondents who were present but simply refused to conduct the survey.
Of the 248 respondents where the enumerators were unable to complete surveys, 157 (63 percent) of them fit into Category 2. While it is likely that Tegal receives some workers from outside the regency (there's obviously no way to prevent this), it does suggest that Tegal is a net exporter of its surplus labor into Indonesian cities rather than a large scale-importer of labor that might scare away campaigns from targeting laborers.
This evidence, however, does not address whether there is a sufficient pool of voters to target in the fields or other localities where low-skilled labor might be present. The survey also has a question that asks the respondent to list principal source(s) of income. A substantial minority of respondents, 18.4 percent, marked either farm laborer or day laborer.Footnote 13 Recall that the sample for the survey was generated from the actual voter lists used at polling stations to verify citizens could vote in the election. This means that approximately one fifth of the electorate worked as day or field laborers. While some campaigns may choose not to target this group of voters for various reasons, it seems improbable that such a large group would be overlooked by every single campaign, especially when the winning candidates won with pluralities of between 30 and 40 percent of the vote.
The survey also recorded those individuals who were not in the labor market. If one focuses on just the males in the sample—many women were likely housewives or did not work for other reasons—one sees that over 10 percent of working-age males were unemployed. Although it is likely that there were workers from neighboring regencies in Tegal prior to the election, either working in the fields or as laborers elsewhere, the labor market for actual residents still had substantial slack, lessening the need to find workers from other regencies.
It is also important to note how paddy fields are planted in Tegal. Generally, there are two times when labor is needed: during the planting season and during harvest. The election in Tegal was in late October, just before the rainy season in Java, which lasts from November or December until February. Therefore, the time leading up to the election was when farmers plant their crops. This is notable because planting rice in Java requires less labor than harvesting. If you visit a single sub-village during planting season, you are likely to see one to two pieces of land plowed and planted over the course of a few days. The rice seedlings are often planted in a small corner of a paddy field, then spread out across the rest of the field by a handful of people. This process plays out over a few weeks until the entire sub-village is planted. Harvesting is much different and much more labor intensive. A group of people work one field over the course of one day. The volume of work is much larger, which makes sense, as the seedlings planted grew while in the ground and the rice must also be processed in addition to being cut. It is during this time, that workers are in the fields in large numbers.
Details like this suggest that the lessons one can learn from this election are idiosyncratic, however, the current schedule for mayoral elections in Indonesia show that every election during this year's cycle was scheduled from October through February. In other words, the general election commission has scheduled elections before the conclusion of the rainy season, before the spike in demand for labor occurs for every jurisdiction, not just Tegal.Footnote 14 While none of these pieces of evidence prove directly that all the laborers working in Tegal were from Tegal during the campaign season, they are suggestive that this issue is minimal. In summary, approximately 20 percent of registered voters in Tegal are laborers, Tegal sends a large number of workers elsewhere to earn a living rather than importing labor, and the election did not occur during a time of peak demand for labor.
Another possible objection to the theory presented here may be that the poor are often concentrated in low socio-economic areas. And since they do not have money for transportation, they do not travel far for work. Much of the work done by these laborers, however, is agricultural in nature. This is important to note because agricultural land itself is spread out across space. Therefore, either the areas the poor live in are spread out, or they must walk long distances to reach the fields they work in. Both cannot be true. This may be unique to rural areas on Indonesia, as poverty is certainly concentrated in Jakarta and other large cities. When workers from places like Tegal move to large cities, they are forced to settle in low-income areas, which results in concentrated poverty. In large cities, it can be true both that the poor live in concentrated pockets of poverty and that they do not travel far for work. Urban laborers do not necessarily work on different pieces of land from one day to the next, at least to the same extent, as their rural counterparts.
A final objection to the theory presented here may be that distributing in-kind goods does serve as a screening mechanism, but that mechanism is one where inferior goods are provided so that only the poor accept them. The survey itself did not collect information on the quality of goods received, so there is no way to test this theory directly with the survey data. However, the theory here focuses on costs for a number of reasons. First, the most common goods provided were known locally as Sembako, which is an acronym in Bahasa Indonesia for the nine staples. The most common goods were rice, oil, eggs, and dry noodles. All Indonesian families, regardless of their socioeconomic standing, have these goods in their kitchens and eat them regularly. The reason this article focuses on the costs associated with accepting in-kind goods rather than the quality of those goods is because the cooking oil and dry noodles were common brands—all with yellow packaging—found in both traditional and upscale modern markets across Indonesia. If these two goods were inferior, it would have been for only the highest income individuals in Indonesia, few if any, of whom lived in Tegal.
Rice is different however. There is a wide range of qualities and many are inferior (and thus cheap). The reason this article does not make the argument that the screening mechanism found here is due to inferior goods though is because when the voter accepts the plastic bag, they grab all of the goods at once before then can open the portion of dry rice and examine it. When the see the packages or noodles and cooking oil in the plastic bags being passed out, they can immediately see the brands they know and accept the goods without thinking the bag is filled with inferior goods. However, it isn't until they have already accepted the bag and opened the portion of rice that they can tell whether the rice is of low or high quality. Some voters may in fact accept the bags and upon inspecting the rice, throw it away, but this is after they have already been screened into accepting the goods. This sequence of events does highlight an interesting question for future work. Specifically, what do voters do once they have accepted the goods? Do they consume them and vote for the party that gave them the goods? Or is it conditional upon the quality of the good—and thus the utility the voter receives from its consumption—as to whether the transfer is sufficient to successfully buy one's vote? While interesting, these questions are left to another research article.
This article makes two contributions to the distributive politics literature. First, much of the previous literature considered private transfers as interchangeable, overlooking microeconomic mechanisms used to targeting voters. But the empirical results presented here show that different types of transfers and their associated characteristics do play a role in how voters are targeted during campaigns. The article then presents a plausible mechanism underlying these results. This finding is directly applicable to the literature on spatial models of vote buying as it highlights the presence of additional variation in the transfer term, which is often fixed. Loosening this parameter could give researchers a more realistic approximation of the decision-making calculus internalized by voters.
While this is a small study with limited geographic coverage, it selected a fairly “typical” location in Indonesia for which to collect data. Tegal is a small city in one of Indonesia's largest provinces. Central Java has a poverty rate near the national average and citizens with secondary school enrollment rates near the national average. Moreover, the local nature of the survey allows one to design survey questions specifically to compare different types of transfers. Currently, large cross-national surveys such as Afrobarometer lump all transfers during campaigns into one question, which allows scholars to test broad theories of vote buying cross-nationally but prevents them from examining micro-theories based on individual preferences, such as the one outlined in these pages (for example, see Jensen and Justesen Reference Jensen and Justesen2014, 222).
Second, it samples a disproportionate number of poor people due to the socioeconomic characteristics of Tegal, which in turn allows the analysis to explore variation within the low end of the income distribution, typically the population most often targeted by campaigns. Ironically, the narrow geographic focus is actually what allows the analysis to discern that there are barriers to the poorest voters to being targeted. A much wider area of study, say a national study of Indonesia, would have simply picked up high levels of vote buying in Tegal, since many poor Indonesians live there and vote buying is prevalent. However, it would have missed that the poorest individuals did not receive transfers prior to the elections because the number of Indonesians at the lowest end of the income spectrum would have been insufficient for such an analysis.
On one hand, this explanation is context specific as it requires a local economy where the poorest workers are disbursed relative to slightly wealthier voters. However, this describes many small towns and rural areas across many developing countries. As such, there are some important characteristics present in Tegal that exist elsewhere. Recall that the distribution of income was mostly on the low end and was relatively flat. This characteristic is particularly important because Tegal, although poor in a sense, is relatively income-equal (i.e. it has low income inequality), which makes identifying the poorest difficult for campaigns. A wider local income distribution might have generated the result commonly found in the literature, that is, the likelihood of selling one's vote strictly decreases as their income increases. This tells us that, potentially, these conditions aren't necessarily just interesting caveats but could have broader implications. For example, is the width of the income distribution related to the effectiveness of campaign targeting? In other words, is poverty the factor that drives the effectiveness of vote buying or is the heterogeneity of the economy more important? The current literature tells us that vote buying should decrease as places develop and vote buying becomes too expensive, but could a wider income distribution mitigate these forces—even temporarily—if it makes targeting the low end of the distribution more efficient? While these questions are left for a future research article, they are rooted in the two elections studied in this article.
CONCLUSION
Clientelism studies rooted in political economy explain who gets targeted based on voters’ ideological positions relative to political parties (Stokes et al. Reference Stokes, Dunning, Nazareno and Brusco2013; Nichter Reference Nichter2008). In Indonesia, however, many political parties are not easily placed along an ideological spectrum nor is attachment to political parties particularly strong (Pratikno 2009; Mujani and Liddle Reference Mujani and Liddle2010). Moreover, spatial models in this literature do not attempt to differentiate between transfer types, they simply assume all transfers are perfect substitutes. Economic theory, however, suggests that different transfer types should produce distinct targeting patterns (Currie and Gahvari Reference Currie and Gahvari2008).
This article explores whether targeting patterns in Indonesia can be explained—at least partially—by strictly economic factors, rather than ideological ones. It demonstrates that when the type of transfer is disaggregated into cash and in-kind transfers, there is a curvilinear relationship between a person's income and whether they are successfully targeted by a campaign. This relationship, however, is limited to in-kind transfers: there is no relationship between one's income and accepting cash from a campaign. These findings contrast with the strictly negative correlation commonly described in the literature and suggests that political economy models of clientelism and vote buying would be improved by allowing the type of transfer to vary, loosening the common assumption that all transfers are perfect substitutes.
The article argues this relationship is due to two underlying forces. First, since campaigns want to reduce the costs of distributing items to voters, they distribute transfers in areas—such as traditional markets—where they can reach a lot of people at once. This reduces the cost of distribution for each transfer to the campaign. Street vendors are well positioned to accept transfers as they are likely to be working in the market on any given day, but seasonal workers in the fields, maids working in homes, and those whose work is done away from concentrated population areas can be missed if they aren't shopping at that moment. This desire to minimize costs creates a barrier at the low end of the income distribution. This force operates at the campaign level. Note, this force may be limited to rural areas in Indonesia—like Tegal—where the poor are often engaged in agriculture and spread out geographically. In larger cities, such as Jakarta or Surabaya, it may be more efficient for campaigns to target specific neighborhoods, where the poor tend to be more geographically concentrated.
Second, in-kind transfers—but not cash transfers—improve a campaign's ability to target low-income voters because they impose a small cost on the recipient, which reduces the net value of the transfer to the voter. Since the transfer is subject to the law of diminishing marginal utility, a small cost on voters is sufficient to screen out those with higher incomes from accepting in-kind, but not cash transfers. Put together, the relationship between income and accepting transfers from campaigns is curvilinear, increasing initially as work-related barriers are removed and costs associated with accepting transfers are reduced. The relationship then decreases as the value each voter places on transfers decreases, even as costs also reduce.
This article, however, leaves a number of questions open to future research.Footnote 15 One question is whether the timing of distributions impacts not only what is distributed, but who is present to accept goods. It is possible that campaigns distribute in-kind goods during much of the campaign, then, in the days before and even the morning of Election Day, they distribute cash as quickly as possible to as many voters as possible to ensure that resources are spread widely. The relationship found between in-kind goods and income may thus reflect a careful strategy of targeting, while the non-existent relationship between cash and income may reflect a last-ditch effort to get voters to the polls. This could explain the differences found between cash and in-kind goods and is an important idea that should be explored in future work. Unfortunately, the survey did not ask how many days before the election the respondent received the transfer recorded in the survey data so this remains an open question.
Another open question is whether distributing cash or in-kind goods is more effective at generating votes for the candidate's distributing them. This article finds that distributing in-kind goods is related to one's income, while cash is not, but it does not examine whether voters who accept transfers follow through and vote for the campaign that provided the transfer. Recent work in Kenya suggests it may send a signal about the candidate's intent to follow through with their campaign promises. Kramon (Reference Kramon2016) uses an experiment to gauge how voter's perceptions change when exposed to information that a campaign was providing cash to supporters at rallies and finds a positive impact on one's evaluation of that candidate. He also finds that this effect is largest among the poor. While this study focuses on a different dependent variable—voter's perception and ultimate vote choice—it raises an important question related to this work. Specifically, are in-kind goods more effective at generating votes once they have been distributed? Cash may be less effective at targeting the poor, but does it generate higher satisfaction making it more effective at generating votes once it makes its way into a voter's wallet?
Finally, the findings also raise the question of whether different types of in-kind goods might impact patterns of targeting. For example, are transfer patterns of religious items different than transfer patterns of rice or some other food? One could imagine a scenario where different types of voters are more or less likely to accept a symbolic item, such as a prayer mat, compared to a non-symbolic item,such as food. Further, the decision to accept the symbolic item may be disconnected from one's socioeconomic status while the decision to accept food may be highly correlated with that decision. The answers to these questions are left to future work, but the questions themselves demonstrate how the results found in this article could be used to further other important work in the discipline.
SUPPLEMENTARY MATERIAL
To view supplementary material for this article, please visit https://doi.org/10.1017/jea.2018.7.
CONFLICTS OF INTEREST STATEMENT
The author is not aware of any conflicts of interest related to the research or writing of this article. Fieldwork was funded by the Government Department at the University of Texas at Austin via the MacDonald-Long Dissertation Fellowship.