

Introduction
Social media is a powerful tool for connecting and communicating with a wide variety of individuals. People use smartphones to access social media platforms for the purposes of obtaining and disseminating information, as well as connecting with other people, brands, and organizations in and out of their network [1]. According to current usage data, the average Twitter user in the US tweets twice per month and 47% of US adults report they use Twitter once a day or more [Reference Wojcik and Hughes2]. As such, Twitter is potentially a valuable resource in bridging the gap between the public and translational science.
Many sites funded by the National Institutes of Health (NIH)’s Clinical and Translational Science Award (CTSA) focus on the bulk of their energy on operational aspects of running their hub. As a result, they may not devote enough energy and resources toward branding and effective communication – or they may not have a dedicated person to direct and implement their communications and branding efforts. However, CTSAs have an important mission when it comes to communicating effectively with their stakeholders, which can include the NIH, other CTSAs around the country, investigators and clinicians both locally and across institutions, clinical research professionals and administrators, and active and prospective research participants.
During the past half century, biomedical and clinical research have developed exponentially because of improved scientific knowledge [Reference Leshner3]. Despite the significant developments in clinical research, there are still issues when it comes to translating these findings into solutions for improved public health outcomes. Barriers to translation of research results include long study timelines, regulatory hurdles, lack of financial support and available resources, and study-related issues such as challenges in identifying eligible study participants [Reference Leshner3]. Due to these ongoing issues, clinical researchers need to take a new approach in translating the results of clinical investigations into solutions for better health outcomes.
In recognizing these discrepancies, the NIH created the CTSAs program in 2006 under the National Center for Research Resources (NCRR) with funding for 12 academic health centers [Reference Patel, Rainwater, Trochim, Elworth, Scholl and Dave4]. The NIH designed the CTSA program to conduct original clinical and translational science in collaborative teams across the country, also known as CTSA hubs. Following the creation of the CTSA program, the NIH added 5–14 new sites annually until the program reached a capacity of 61 CTSA hubs in 2012 [Reference Leshner3]. Initial funding for the CTSA program came from redirected funds from the NIH’s previous General Clinical Research Center (GCRC) program and the NIH Common Fund [Reference Leshner3]. Currently, the National Center for Advancing Translational Sciences (NCATS) manages the CTSA program. In addition, NCATS provides about 500 million dollars annually or 80% of its budget to the CTSAs [Reference Patel, Rainwater, Trochim, Elworth, Scholl and Dave4]. Funding for CTSA hubs varies depending on their program goals, affiliated institutions, and size of the program, and funding cycles last for 5 years until CTSAs must reapply for renewal.
CTSA Communications, Dissemination, and Stakeholder Engagement
All CTSA program hubs share a similar mission of translating research findings into innovative strategies for clinical and community settings. However, it takes about 17 years for the evidence gained from conducting research to be implemented into clinical practice [Reference Patten, Albertie and Chamie5]. Once researchers have significant findings to report, dissemination becomes vital. For example, the NIH Collaboratory Living Textbook of Pragmatic Clinical Trials has a chapter with guidelines for how to disseminate research results to patients [Reference Tuzzio, Chambers and Tambor6]. In addition, the National Academies of Sciences, Engineering, and Medicine (NASEM) revised its recommendations to include the return of research results to individual participants on a regular basis, underscoring the importance of timely communication and reporting. In order to accomplish these goals, the NIH recommends using a variety of dissemination methods including patient advocacy groups, government websites (such as ClinicalTrials.gov), study-specific websites (such as personalized study landing pages), newsletters (both physical and digital versions), news media, and social media.
CTSAs have an important role when it comes to using multiple avenues for dissemination, especially social media platforms. Within their mission statement, CTSAs are tasked with “develop[ing] innovative solutions that will improve the efficiency, quality and impact of the process for turning observations in the laboratory, clinic and community into interventions that improve the health of individuals and the public [7].”
Reputational Branding
CTSAs establish themselves as credible sources of information about clinical research across the CTSA through websites geared at prospective research participations. For example, researchers examining the web presence of CTSA hubs found that they included the NIH and/or NCATS branding or language about the grant on each of the 62 main websites and on 18 websites geared toward prospective research participants [Reference Flood-Grady, Paige, Karimipour, Harris, Cottler and Krieger8].
Since the CTSA hubs are sponsored and funded by the NIH, their credibility is quite high in the eyes of the public, as prior research has shown that people tend to generally trust the health recommendations of their federal agencies [Reference Jackson, Peterson, Blake, Coa and Chou9]. Data collected via online surveys suggest that the level of trust between the CTSA institution and the community to be in the “average” range. Overall, research affiliated to a CTSA had higher levels of trust and value when compared to research not affiliated with a CTSA [Reference Skinner, Williams and Richmond10].
Research has shown most Americans have a relatively low level of trust in the American government, with at around 19% of Americans stating that they trust their government “most or all of the time [Reference Kowitt, Schmidt, Hannan and Goldstein11].”
How Americans Find Health Information Online
Americans seek health-related information from a variety of sources including from their healthcare providers, community clinics, books, radio, broadcast media, and social media. In a survey of 1503 respondents aged 18 and older residing in Douglas County, Nebraska, the 2 most frequently reported sources of health information were the Internet and information provided by healthcare professionals [Reference Kelley, Su and Britigan12]. Extant research supports the assertion that the Internet should be used as a tool to communicate health information to various communities.
How CTSAs Use Social Media
Social media can be an effective strategy for participant recruitment, surveillance, data collection, and community engagement. The majority of CTSA hubs use their websites to post information about their services, their research, and publicly available resources such as brochures, educational pamphlets, PowerPoint presentations, and announcements. Since individuals need to purposely access the CTSA website regularly to receive information, they will not receive CTSA updates or information unless they actively check their website or have signed up to be part of their email listserv.
However, social media presence of CTSA hubs have the potential to bridge the communication gap between research findings and community practice by: (a) increasing access to resources; (b) building trust between institutions and communities; and (c) bolstering communication among other CTSA hubs and other stakeholders. In addition, these websites can serve as centralized access points for advertising opportunities for clinical trial participation, dissemination of research results, findings, and timely news of other biomedical research advancements. Serving as a platform for recruitment, events, updates, and promotional content, Twitter offers an interactive forum for engaging stakeholders. Twitter account users can like, retweet, and comment on CTSA messages. Furthermore, Twitter can serve as an open forum for clinical research discussions online, whereby individuals affected by a certain condition or who are interested in a specific type of research can congregate with like-minded people online and obtain credible information from thought leaders affiliated with the CTSAs and NIH. We found that 35 CTSAs had a presence on Twitter, although 33 were posting actively (i.e., once per week or more). Two accounts were private, so we were unable to collect their data.
Materials and Methods
We chose to apply framing theory due to its relevancy and that it has been historically applied to multiple fields such as political communication [Reference Scheufele13], health communication [Reference Borah and Xiao14,Reference Latimer, Salovey and Rothman15], and news analysis [Reference Pan and Kosicki16]. Framing refers to the way in which a message is crafted and presented, and framing analysis is a process by which researchers evaluate media forms, such as news articles and social media. We chose to use framing theory because we wanted to understand the ways in which CTSAs crafted, packaged, and disseminated their tweets.
We used a mixed-methods approach to content analysis to evaluate the collection of tweets (n = 349) from 19 CTSA Twitter accounts. A mixed-methods approach involves the integration of both qualitative and quantitative elements. A qualitative method of analysis involves analyzing content in a systematic, iterative manner [Reference Mayring17], whereas a more quantitative approach involves the use of descriptive statistics such as correlations, mean, and/or standard deviation [Reference Hamad, Savundranayagam, Holmes, Kinsella and Johnson18]. Our approach integrated the use of descriptive statistics to understand which frames were recurring across multiple CTSAs and could, therefore, be thought of as salient or significant. We correlated various aspects (such as type of content with evidence of increased engagement; number of tweets from a CTSA with a higher level of engagement; and hypotheses about a CTSA’s avatar and a higher number of followers). Using qualitative analysis, we examined the deeper meaning behind the strategy employed by each CTSA in terms of what choices they made about the type of content they’d tweet about, use of visual elements like photos, videos, Graphics Interchange Format files (GIFs), and more. Finally, we focused on engagement by examining how the type of content and use of visual content may have led to increased engagement in the form of likes, retweets, follows, and comments.
No research study to date has systematically examined the ways in which CTSAs structure, frame, and disseminate social media messages on social media platforms. Using framing theory as the underpinning, the purpose of this content analysis is to investigate the ways in which CTSAs use Twitter to communicate with their various stakeholders, the type of content they post, and how they leverage tenets of strategic communication.
We began this process by identifying a list of NCATS-awarded CTSA hubs around the country, and then collating their Twitter usernames (n = 37). After compiling a comprehensive list, we sent out a private message from our CTSA hub’s Twitter account (@SoCalCTSI) to each CTSA hub to inquire who was responsible for developing and posting their tweets. We informed them that we would be including their responses in de-identified, aggregate format, but provided them the option to opt out. We received 19 responses via Twitter direct message. Some CTSAs have disabled the direct message feature within Twitter, so we were unable to contact them, and some did not reply despite multiple follow-ups.
Next, we developed a coding sheet and worked on generating relevant codes based on a preliminary review and analysis of some randomly chosen sample tweets. We created a coding book, which one of the coders then programmed into REDCap, an electronic data capture tool hosted at the University of Southern California’s CTSI. REDCap is a secure website for building and managing online surveys, developed in 2004 at Vanderbilt University [19]. The coding book included questions relating to the nature of the content posted in the tweet, whether or not there were other Twitter accounts tagged, use of hashtags and visual content (such as GIFs, emojis, videos, photos), and engagement (such as how many likes, retweets, or comments were on the tweet). We divided the CTSA Twitter accounts into the following regions: the Northeast, the Southeast, the West, and the Midwest. We analyzed tweets for a period of 1 year, from January 2019 to January 2020.
To establish intercoder reliability, the coders analyzed a subset of randomly generated sample tweets (50 tweets) that was used to develop the codebook. After we reviewed the subset of tweets, they came to a consensus regarding the exhaustiveness of the codes within the coding list, and they were not able to generate additional codes. The Krippendorf’s Alpha reliability level among four coders was 0.89, which is considered as a high score. For the remainder of the coding portion, we divided up the tweets evenly among each coder for analysis and each coder completed the coding booklet within REDCap. The alpha reliabilities of the four primary content sections are as follows: (1) nature of the content they were tweeting about: 87%; (2) presence of supplementary visual elements such as photos and videos: 90%; (3) engagement from other Twitter users (in the form of likes and retweets): 91%; and (4) branding elements such as avatars, logo colors, and content of their bios: 91%.
The research team proceeded to code all the tweets from January 2019 to January 2020, and then began the analysis process. We ran descriptive statistics on the collected data using Excel. Using a qualitative approach, we were able to generate a list of common content-related categories across Twitter accounts. Of the total 37 CTSA accounts included in our assessment, data for 35 accounts were accessible to the public. From the pool of 35 CTSA Twitter accounts, CTSA institutions were placed into categories based on region (the Northeast, the Southeast, the West, and the Midwest). This stratification of CTSA institutions by region was to account for potential bias due to location as our analysis aimed to examine an even distribution of CTSAs across the USA. Upon stratification, CTSA Twitter accounts were organized in ascending order of “tweet rate” (total account tweets/months Twitter account had been live). The lower/upper tails of each stratification were removed to eliminate outliers. This method was used to collate the final list of Twitter accounts, which aimed to include only accounts in the inner quartiles surrounding the median of the stratification. In total, 19 accounts were selected for review and 349 (95% CI, P-value < 0.05) tweets tweeted from the 19 accounts were analyzed using the established coding chart shown in Table 1. In parallel to the coding, we privately messaged 37 CTSAs on Twitter to inquire who at their hub handles communications, and 19 replied.
Table 1. Established code and interpretation list used for the content analysis

Research Questions and Hypothesis
To effectively guide our analysis, we generated the following research questions and hypothesis:
RQ1: What content are CTSAs communicating in their tweets?
RQ2: What visual elements are being included in the tweets?
RQ3: What is the average engagement per tweet?
RQ4: What branding elements are featured in CTSA Twitter logos and bios?
RQ5: Who is responsible for the communications efforts within a CTSA hub?
Results
When we examined the content of the tweets, the most commonly occurring content code was event promotion (29.8% of tweets), and the least commonly occurring code of the tweets analyzed was recruitment (2.01% of tweets; Table 1). This shows that most CTSAs publish information relating to events, programs, and conferences within the CTSA hub and/or outside of their institution – and very little about actively recruiting studies. Approximately half (51.29%) of the tweets coded contained at least one hashtag, and the average number of hashtags used per tweet was 1.75 (Table 2). Over half of the tweets (59.31%) contained an uploaded image, while 3.44% of tweets contained a video.
Table 2. Coding analysis summary table

With respect to engagement, tweets contained 4.38 likes and 1.94 retweets on average. We also found that wordier tweets received more engagement in the form of likes and retweets (Fig. 1). The most optimal time for tweets to be sent out was 10 a.m.–12 p.m. Pacific Standard Time, as tweets sent out during that timeframe received the most engagement (560 likes and 279 retweets).
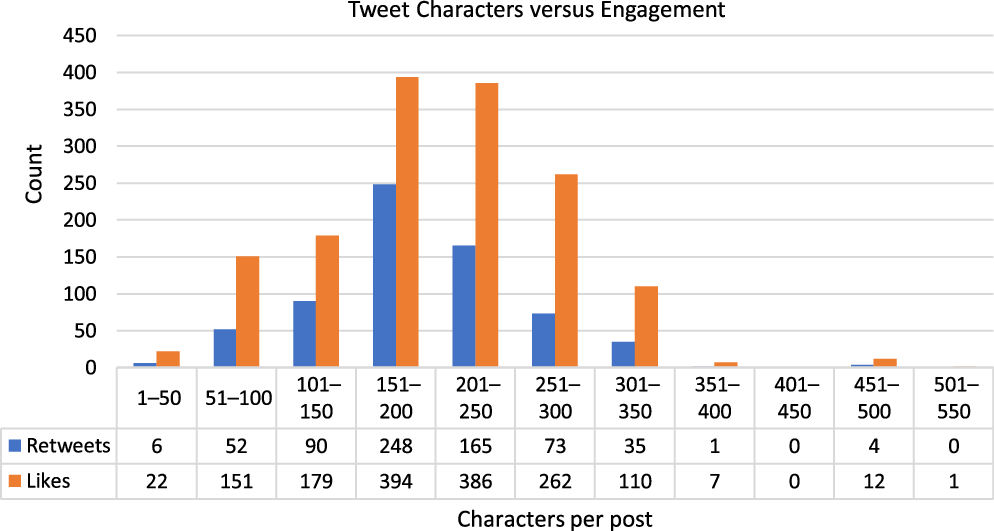
Fig. 1. Number of characters relative to the engagement of the 349 tweets analyzed.
Regarding the branding of the CTSA Twitter accounts, 95.10% contained a logo or symbol (Table 2). This was expected since the CTSA hubs want to be easily identifiable to Twitter users and many want to show their affiliation with the universities of which they are a part. Of the accounts coded, 90.60% of CTSA Twitter accounts contained the colors associated with their institutions in the avatar. The two most used colors in the avatar of the Twitter account were white/beige (57.10%) and gold/yellow (48.80%). The most used shape within the avatar of the Twitter account was a rectangle/cube at 25.6% and the second was circle/sphere at 17.90%.
We also analyzed taglines/mission statements located in the biography (“bio”) section of each Twitter account. Of the accounts coded, the most common word within the Twitter bios was “accelerate” at 17.60% and the words least used were breakthrough, catalyze, and transform (none of these words were used in the Twitter account bios analyzed).
Finally, we examined who was responsible for the tweets from each CTSA and categorized them into three distinct tiers: director, manager, or coordinator/specialist/strategist levels. Of those who replied were 19 communications personnel totally, which meant 1 person dedicated to the role at each CTSA (1 CTSA had a director and a part-time specialist). Five CTSAs had director-level communications personnel, eight had manager-level personnel, and six had coordinator, specialist, or strategist-level personnel. Almost all roles were housed within the Central Administration core (one person was a research manager who also handled hub communications).
Discussion
As part of this project, we systematically collected tweets from 19 CTSA Twitter accounts and reviewed 349 tweets to ascertain the following larger themes: (1) type of content in the tweets; (2) presence of supplementary visual elements such as photos and videos; (3) engagement from other Twitter users (in the form of likes and retweets); (4) branding elements such as avatars, logo colors, and content of their bios; and (5) individual(s) who managed the CTSAs’ Twitter account and their role within the Institute.
Based on our analysis, recruiting participants and/or disseminating tweets about actively enrolling in clinical trials was the least commonly occurring theme within the analyzed tweets, although there continues to be a dearth of information relating to available clinical trial opportunities. This represents a chance for CTSAs to become leaders in normalizing and encouraging research participation, as well as promoting trials happening at their home institution or trials that their staff members are supporting.
Hashtag usage was common, with over 51% of tweets containing one or more hashtags. Hashtags are important because they allow tweets to be publicly searchable (and they appear in search engines such as Google and Bing), as well as allow other Twitter users to search for specific hashtags within Twitter’s search function. If CTSAs began using an agreed-upon set of hashtags, it could bring about some uniformity to the tweets from these CTSA accounts. Examples of a common set of tweets could potentially include #ClinicalResearchEducation, #CTSASpotlights, and #KL2Accomplishments. In addition, CTSAs could come together at the annual meeting to brainstorm around standardized hashtags, common content across hubs, and other strategic approaches for social media communication and dissemination.
The tweets included visuals like uploaded images (59.31%), images linked to a website (14.33%), emojis (8.60%), videos (3.44%), and GIFs (0.86%). Tweets containing visual elements such as photos, emojis, or GIFs garnered more engagement in the form of likes and retweets. The hubs that tweeted the most often had higher levels of engagement in the form of likes and retweets. Indeed, engagement in the single digits is not very notable, when compared to national and international brands and large organizations that have engagement numbers in the hundreds, thousands, and beyond.
When analyzing engagement, it is important to also examine the ratio of retweets and likes to the number of followers. However, even when taking this approach, the engagement numbers are still quite low. This represents an opportunity for CTSA hubs to increase their reach, and in turn, their engagement. Adding standardized hashtags and strategizing common content will make the tweets coming from CTSA hub-affiliated Twitter accounts easier to find and thus easier for Twitter users to engage.
Based on our analysis, we found that the average time of tweets was 10:25 a.m. Pacific Standard Time. Guidelines from social media agencies suggest that healthcare companies or those posting healthcare content should post on weekdays from 10 a.m. until noon [Reference Arens20,Reference Lyle21]. According to our analysis, CTSAs seem to be posting at optimal times and should continue this approach to maximize user engagement.
CTSAs included their home institution’s colors in their avatar photos and had various shapes in their logo including circles/spheres, rectangles, and triangles.
We noticed a disparity in terms of how CTSAs use Twitter, with some of the hubs posting relevant content frequently and using it in a manner that engages followers. Conversely, some hubs tweet very infrequently or do not have any Twitter presence at all. At worst, this lack of brand visibility might hurt their credibility, and at the very least prevent interested followers from getting timely updates about their accomplishments on social media.
The 19 communications personnel who replied to our private Twitter message gave us useful insight into who is handling communications on behalf of the CTSAs: mostly managers, followed by coordinators/specialists/strategists, and five with director-level personnel. All but one CTSA had a single dedicated person handling communication, with one CTSA that had two people. Organizationally, nearly all of these individuals were affiliated with the Central Administration core. Although it is helpful to have dedicated personnel handling communications, our analysis showed greater opportunity for building Twitter presence, engaging followers, and participating in efforts to achieve parity in Twitter strategy and approach among the entire Consortium, which may involve allocating greater resources to supporting communications efforts, especially cross-hub collaborations.
On a larger scale, there is minimal standardization or guidance when it comes to how CTSAs should use Twitter. On the CLIC website, there are toolkits submitted from various hubs outlining best practices when recruiting or engaging with study participants on social media [22]. There are guidance documents on how hubs should use social media to amplify their own accomplishments or represent the overall CTSA and NIH program as funded sites, but these documents focus on explaining how Twitter works and less on recommendations for how to optimally engage users and post exciting content. Only one slide focuses on recommendations [23], and there is an NIH checklist for how to communicate science and health research to the public [24]. To further expand these resources, CTSA hubs should come together with CLIC Communications leadership to expand upon extant guidance documents, share best practices and standardize processes. Involving relevant stakeholders in the process can help guide the development of these documents. Message mapping, audience analysis, and multipronged qualitative approaches such as focus groups can help the hubs identify and test what type of content resonates with investigators, research personnel, and the public.
This project was not without its limitations. For example, some CTSA hubs do not have Twitter accounts at all, their accounts are private, or they do not post tweets regularly, so they were excluded from our analysis. For example, 2 of the 37 were excluded from the analysis because their Twitter accounts were set to private. In addition, some CTSAs don’t garner a lot of engagement to their tweets, which doesn’t give us a good idea of how many people see the tweet and have the potential to interact with it by liking and/or retweeting it. Finally, it would be beneficial if we were able to see the “reach” of each tweet they analyzed (i.e., reach refers to the estimate Twitter provides on how many people potentially saw the tweet). Unfortunately, these analytics are only visible to the account owner, so we are unable to see them. Greater ability for audience analysis will provide clues as to who is seeing these tweets, what their demographics are, and so forth.
Another limitation was that we did not receive a response from every CTSA we reached out to on Twitter about who handles communications at their hub, despite multiple follow-ups. Based on the hubs that responded, they did have at least one dedicated person responsible for handling their communication and social media efforts. Having this workforce who are trained in marketing, communications, advertising, or similar fields will ensure messages are crafted and tailored appropriately, whether these messages are disseminated via email or social media. We found that hubs with dedicated communications personnel tweeted more often had original content that was specific to their hub, and graphics to go along with their tweets. According to our analysis, CTSAs commonly use impactful words like “accelerate,” “innovate,” “discover,” and “translate” in their Twitter bios – but without planned and thoughtful dissemination methods, they will not be able to publicize or amplify their impact in the biomedical research space.
Ensuring your hub’s Twitter presence is thoughtful, strategic, and aligned with the mission of NCATS and the mission/goals of the hub should be the primary goals. Varying the type of written content (combining retweets with original content) and visual content (photos, videos, GIFs, and others) can also keep the content engaging and diverse, as our analysis showed. Finally, engaging with other CTSAs in a systematic manner through targeted posts (highlighting the success stories of other hubs and/or collaborative efforts) and tweeting directly at other CTSAs can help bring greater visibility to a hub’s accomplishments, and foster mutual connections and fuel collaborative efforts.
Future research could focus on investigating how CTSAs engage with members of the community on Twitter, since CTSAs mostly interface with other CTSA hubs, researchers, and federal agencies. Topics of discussion could potentially include obtaining feedback from community members on research studies, willingness to participate, recruitment tools, and recruitment avenues. Developing a comprehensive guidance document for social media could be a potential collaborative exercise for all funded CTSA hubs. Such a document would ensure adherence to rules and policies, as well as create a standardized approach to ensure uniformity when it comes to content and practices for CTSAs on Twitter.
Acknowledgments
This work was supported by grants UL1TR001855 and UL1TR000130 from the National Center for Advancing Translational Science (NCATS) of the US National Institutes of Health. The content is solely the responsibility of the authors and does not necessarily represent the official views of the National Institutes of Health. Dr. Apaydin was supported by the VA Office of Academic Affiliations through the Advanced Fellowship in Health Services Research & Development. The contents of this article do not represent the views of the US Department of Veterans Affairs or the US Government.
Disclosures
The authors have no conflicts of interest to disclose.


 Open access