


Introduction
Body mass index (BMI) has shown a steady increase in many nations over the last 30 years. This trend has been observed in both urban and rural areas and is particularly marked among women in high-income and industrialized countries (McLaren, Reference McLaren2007; NCD Risk Factor Collaboration et al., Reference Bixby and Bentham2019). There is a strong association between BMI and health and developmental outcomes, which is particularly apparent at extremes of the BMI distribution. A low BMI impairs cognitive development and is associated with an increased risk of disease and mortality (Tanner, Reference Tanner1987; Strauss & Thomas, Reference Strauss and Thomas1998). A high BMI increases the probability of disability and premature death in adults. It is associated with poor mental health and educational attainment (Park et al., Reference Park, Falconer, Viner and Kinra2012; Caird et al., Reference Caird, Kavanagh, O’Mara-Eves, Oliver, Oliver, Stansfield and Thomas2014) and higher severity of many diseases, including COVID-19 (Chu et al., Reference Chu, Yang, Shi, Zhang and Wang2020).
Research on nutrition and BMI has often focused on the period from pre-conception to age 5 years (Black et al., Reference Black, Allen, Bhutta, Caulfield, de Onis and Ezzati2008; Stevens et al., Reference Stevens, Singh and Lu2012; Lee et al., Reference Lee, Andrew, Gebremariam, Lumeng and Lee2014). Black et al. (Reference Black, Allen, Bhutta, Caulfield, de Onis and Ezzati2008) reported high rates of undernutrition in mothers and children of low- and middle-income nations, leading to stunting, severe wasting and prenatal growth restriction in children younger than 5 years. Global trends in stunting and underweight in developing countries showed that, in 2011, 314 million children younger than 5 years were stunted and 258 million were underweight (Stevens et al., Reference Stevens, Singh and Lu2012). In high-income countries, socioeconomic status (SES) correlates negatively with the proportion of men and women who are obese (McLaren, Reference McLaren2007; Mackenbach et al., Reference Mackenbach, Stirbu, Roskam, Schaap, Menvielle and Leinsalu2008; Devaux & Sassi, Reference Devaux and Sassi2013). Mekonnen et al. (Reference Mekonnen, Papadopoulou, Arah, Brantsæter, Lien and Gebremariam2021) reported that, in Norwegian children, SES relationships exist between BMI and both maternal and paternal education level and income, emerging early in infancy and remaining until at least the age of eight. A high BMI acquired early in life is particularly stable with subsequent development. Lee et al. (Reference Lee, Andrew, Gebremariam, Lumeng and Lee2014) reported positive correlations between early-life poverty and adolescent obesity (BMI ≥95th percentile) in a US sample of 1150 children from ages 3 to 15.5 years. This pattern of greater BMI ‘tracking’ in lower SES groups has also been reported in the UK, especially in women and at the higher end of the BMI distribution (Norris et al., Reference Norris, Bann, Hardy and Johnson2020). Across high-income nations, there has been an increase in childhood obesity over the past 50 years (Wang & Lobstein, Reference Wang and Lobstein2006; Olds, Reference Olds2009), which appears to have stabilized in the late 1990s (Olds et al., Reference Olds, Maher, Zumin, Sandrine Péneau, Lioret and Castetbon2011). These trends appear to be correlated with temporal changes in income inequality as evidenced by one influential method of measuring inequality, i.e. the Gini coefficient (Gini, Reference Gini1936; Tomkinson et al., Reference Tomkinson, Lang and Tremblay2019).
The present study examines the influences of prenatal sex steroids (as indexed via the digit ratio, or 2D:4D – a suggested proxy for prenatal testosterone (T) and oestrogen (E)) (Manning et al., Reference Manning, Scutt, Wilson and Lewis-Jones1998; Manning, Reference Manning2002) on BMI. Previous studies on 2D:4D and BMI relationships have produced mixed results. Several reports have found no relationship between 2D:4D and BMI in males or females (e.g. Muller et al., Reference Muller, Manning, Hopper, English, Giles and Severi2013; Kalichman et al., Reference Kalichman, Batsevich and Kobyliansky2017). Other studies reported positive relationships in girls (Ranson et al., Reference Ranson, Stratton and Taylor2015), in women (Al-Qattan et al., Reference Al-Qattan, Al-Kharashi, Al-Hindi, Dammas, Kattan and Al-Qattan2019; Munoz et al., Reference Munoz, Garcia, Gallego-Tena and Vivas2020) and men (Bagepally et al., Reference Bagepally, Majumder and Kotadiya2020). Digit ratio correlates negatively with prenatal T and positively with prenatal E (Manning et al., Reference Manning, Scutt, Wilson and Lewis-Jones1998, Manning, Reference Manning2002; Swift-Gallant et al., Reference Swift-Gallant, Johnson, Di Rita and Breedlove2020). It is sexually dimorphic (males<females; Manning et al., Reference Manning, Scutt, Wilson and Lewis-Jones1998; Manning & Fink, Reference Manning and Fink2018) and the ratio and sex difference are thought to be established early in ontogeny (i.e. in the 1st trimester of fetal development; Malas et al., Reference Malas, Dogan, Evcil and Desdicioglu2006; Galis et al., Reference Galis, Ten Broek, Van Dongen and Wijnaendts2010). There are ethnicity and SES effects on 2D:4D. Mean values of 2D:4D are highest in Caucasian populations and lowest in East Asian and Black populations, suggesting the former have experienced low prenatal T and high prenatal E and the latter have been exposed to high T and low E prenatally (Manning, Reference Manning2002). Mothers with below-average income have children with higher 2D:4D than mothers with above-average income. This influence of parental income inequality on children’s 2D:4D is particularly apparent for the 2D:4D of male children (Manning et al., Reference Manning, Fink, Mason and Trivers2021). These effects of income inequality on both 2D:4D (Manning et al., Reference Manning, Fink, Mason and Trivers2021) and BMI (Tomkinson et al., Reference Tomkinson, Lang and Tremblay2019) suggest that all three variables are related in some way.
The current study investigated the relationship between 2D:4D and BMI in a large online survey (i.e. the BBC Internet Study). If such a relationship exists, BMI should be sexually dimorphic and influenced by parental income inequality. Also, the associations between 2D:4D and BMI among males and females, separately, and controlled for parental income inequality, were examined. Previous studies have reported positive associations of 2D:4D and BMI, particularly among females. Thus, positive relationships between 2D:4D and BMI and higher effect sizes for females than for males were predicted. In addition to the analysis at the individual level, the study considered the mean national values of 2D:4D and BMI in assessing the relationship between these variables. If the associations at the individual level can be transferred to the national level, positive associations are predicted with larger effect sizes in women.
Methods
Participants and procedure
The BBC Internet Study was a multi-ethnic and multi-national survey hosted by the BBC Science and Nature website in 2005. It comprised cognitive and behavioural tests and obtained demographic, personality, sexual behaviour and several physical characteristics from participants (for details see Reimers, Reference Reimers2007). A sample of 255,116 participants completed all study tasks. Participants provided information about their age (integer 0 to 99 years), sex (male or female), where they lived (the United Kingdom, then 240 other countries) and their ethnicity. The predominant ethnicity was White (reported by 84.1% of participants), and the most commonly represented nationalities were the United Kingdom (46.9%), the United States (27.7%), Canada (5.2%) and Australia (3.6%), with eleven other nations represented by >1000 participants.
Participants self-measured the 2D and 4D of their right and left hands using the methodology of Manning et al. (Reference Manning, Scutt, Wilson and Lewis-Jones1998). They viewed a diagram of the hand and were instructed to measure their fingers on the ventral side of the digit from the fingertip to the most proximal crease with a conventional ruler. Finger length measurements were reported to the nearest millimetre using dropdown menus. The 2D:4D ratio was calculated by dividing the 2D by 4D digit lengths.
Participants self-reported their body weight (in kg) and height (in cm). With this information, the participant’s BMI was calculated according to BMI=body weight (kg)/[body height (m)]2. In the analysis, the individual BMI scores were categorized into the following five groups: 7–18.49 (underweight), 18.5–24.9 (normal weight), 25–29.9 (overweight), 30–30.9 (obese) and 40–50 (very obese).
Participants responded to a single question item concerning their parents’ income. The item was phrased ‘What best describes your parents’ income [while growing up]?’ with response options I=much lower than others (bottom 25% of the population), II=slightly lower than others (low 50% of the population), III=slightly higher than others (upper 50% of the population) and IV=much higher than others (top 25% of the population).
In addition to individual BMI from participants in the BBC Internet Study, national means of BMI and information about obesity prevalence were secured from the World Health Organization report on non-communicable diseases (https://apps.who.int/gho/data/node.main.A896). The report contains sex aggregated and disaggregated data (for countries from Afghanistan to Zimbabwe) from the years 1975–2016 of individuals aged 18+ years. In the present study, 2016 national means of BMI and the obesity prevalence data (crude and age-adjusted) of males and females were used.
Statistical analysis
The analyses were restricted to participants aged 18 to 70 years. Web-based studies can be prone to inaccuracy in responding and to dishonesty leading to extreme values for some variables. As in earlier reports, the tails of the 2D:4D distributions were removed by considering right and left 2D:4D within the range of ≥0.80 to ≤1.20. The range of individual BMI scores considered for analyses was 7 to 50.
To examine the effects of age, sex and parental income inequality on BMI (including interactions), analyses of variance (ANOVA) were performed (in two steps) with BMI as the dependent variable and age, sex and parental income as factors. Fisher’s projected least significant difference (PLSD) post-hoc was used to identify differences in sex, BMI or parental income categories. A series of linear regressions were performed, separately for males and females, to test for relationships between BMI (dependent variable) and right- or left-hand 2D:4D, age and parental income (independent variables). Linear regression models assume a linear association between the dependent and independent variables. Regarding BMI and (right and left) 2D:4D, their relationship may not be uniform across the range of BMI. Therefore, an additional ANOVA was performed with the dependent variable 2D:4D (separately for the right and left hand) and the factors sex and categorized BMI (i.e. the five BMI groups). In addition to the analyses at the individual level, the associations of national means of BMI (and obesity prevalence) and 2D:4D were considered using zero-order correlations (Pearson’s r), separately for males and females.
Results
Descriptive statistics
There were 170,984 participants (96,885 males) from 41 countries after data restrictions were applied. Table 1 reports the national means of male and female 2D:4D ratios (both hands) together with crude and age-standardized values of BMI and obesity prevalence. The mean BMI for the total sample was 25.30 (SD=5.34).
Table 1. National means for digit ratio (male and female right and left hand) for 41 countries, together with mean BMI (crude and standardized for age) and obesity (crude and standardized for age)

Effects of age and sex on BMI
There were effects of age [F(1,170980)=10,268.88, p<0.0001] and sex [F(1,170980)=39.65, p<0.0001] on BMI but no interaction of age×sex [F(1,170980)=0.65, p=0.423]. Body mass index was higher in males (M=25.56, SD=4.97) compared with females (M=24.96, SD=5.78, Cohen’s d=0.11); it increased with age, and the increase applied to both sexes. Post-hoc tests (Fisher’s PLSD) confirmed the sex difference for BMI (mean difference=0.60, p<0.0001).
Effects of inequality in parental income on BMI
Inequality of parental income may have an effect on BMI and this may interact with sex. A consideration of parental income and sex on BMI revealed effects of the former [F(3,169441)=698.54, p<0.0001] and the latter [F(1,169441)=358.17, p<0.0001], and interaction of parental income×sex [F(3,169441)=28.01, p<0.0001]. Lower parental income was associated with higher BMI (and mean male BMI was higher than mean female BMI, mean difference=0.60, p<0.0001). Post-hoc tests indicated differences for pairwise comparisons between all parental income categories with mean differences as follows: I–II=0.49, I–III=1.37, I–IV=2.00, II–III=0.88, II–IV=1.51, III–IV=0.63 (all p<0.0001). Considering sex in the comparisons of BMI groups suggests larger mean differences between groups for females compared with males. The BMI mean [SD] for all parental income groups were: males: I=26.42 [5.23], II=25.96 [5.10], III=25.24 [4.84], IV=24.66 [4.51]; females: I=26.06 [6.32], II=25.56 [5.99], III=24.46 [5.49], IV=23.49 [4.98].
BMI relationships with 2D:4D, age and parental income
There was a significant model for male BMI [F(3,96034)=2541.80, p<0.0001, R²=0.074] predicted by right 2D:4D (β=0.03), age (β=0.25) and parental income (β=–0.06) (all p<0.0001). A nearly identical result was obtained when replacing right 2D:4D with left 2D:4D [F(3,96034)=2534.34, p<0.0001, R²=0.073; left 2D:4D β=0.03, age β=0.25] and parental income [β=–0.06, all p<0.0001]. In women, the model including right 2D:4D was significant [F(3,73407)=1537.25, p<0.0001, R²=0.059] with predictors right 2D:4D (β=0.05), age (β=0.21) and parental income (β=–0.09) (all p<0.0001). Similarly, replacing right with left 2D:4D resulted in a significant model [F(3,73407)=1520.35, p<0.0001, R²=0.058] with predictors left 2D:4D (β=0.05), age (β=0.21) and parental income (β=–0.09) (all p<0.0001). Thus, BMI tends to be positively associated with 2D:4D (of right and left hands) and age, and negatively associated with parental income. These relationships were found in males and females, and the proportion of variance explained (in BMI) by the predictors was slightly higher in males than in females.
There were effects of BMI group [F(4,170974)=102.26, p<0.0001] and gender [F(1,170974)=485.66, p<0.0001] on right 2D:4D, but no interaction of BMI group×sex [F(4,170974)=2.27, p=0.059]. Males had lower 2D:4D than females. Males in the normal (N, 0.982) BMI group had the lowest 2D:4D, followed by overweight (OW, 0.984) and underweight (UW, 0.985), obese (O, 0.988) and very obese (VO, 0.991) individuals. A similar pattern emerged in females with N (0.991) individuals having the lowest 2D:4D, followed by UW (0.992) and overweight (0.995), and obese (0.998) and VO (1.004). Post-hoc tests (Fisher’s PLSD) confirmed the sex difference for right 2D:4D (mean difference=0.010) in addition to differences of right 2D:4D for all pairwise BMI group comparisons (Figure 1) with mean differences as follows: UW–N=0.002, UW–OW=0.001, UW–O=–0.003, UW–VO=–0.010, N–OW=–0.001, N–O=–0.006, N–VO=–0.012, OW–O=–0.004, OW–VO=–0.011, O–VO=–0.006. Performing the analysis with left 2D:4D (instead of right 2D:4D) revealed essentially the same findings, i.e. an effect of BMI group [F(4,170974)=91.89, p<0.0001] and sex [F(1,170974)=283.47, p<0.0001] on left 2D:4D, but no interaction of BMI group×sex [F(4,170974)=1.79, p=0.127]. Mean left 2D:4D by BMI group and gender showed a similar pattern as for right 2D:4D (males: UW=–0.985, N=0.983, OW=0.985, O=0.988, VO=0.989; females: UW=0.990, N=0.990, OW=0.993, O=0.996, VO=0.999). Post-hoc tests (Fisher’s PLSD) confirmed a sex difference (males<females) in left 2D:4D with a mean difference of 0.007. All but one (UW–OW: right=0.001, p=0.116; left=–0.0004, p=0.488) of the pairwise comparisons of 2D:4D across BMI groups were statistically significant (details omitted for brevity).
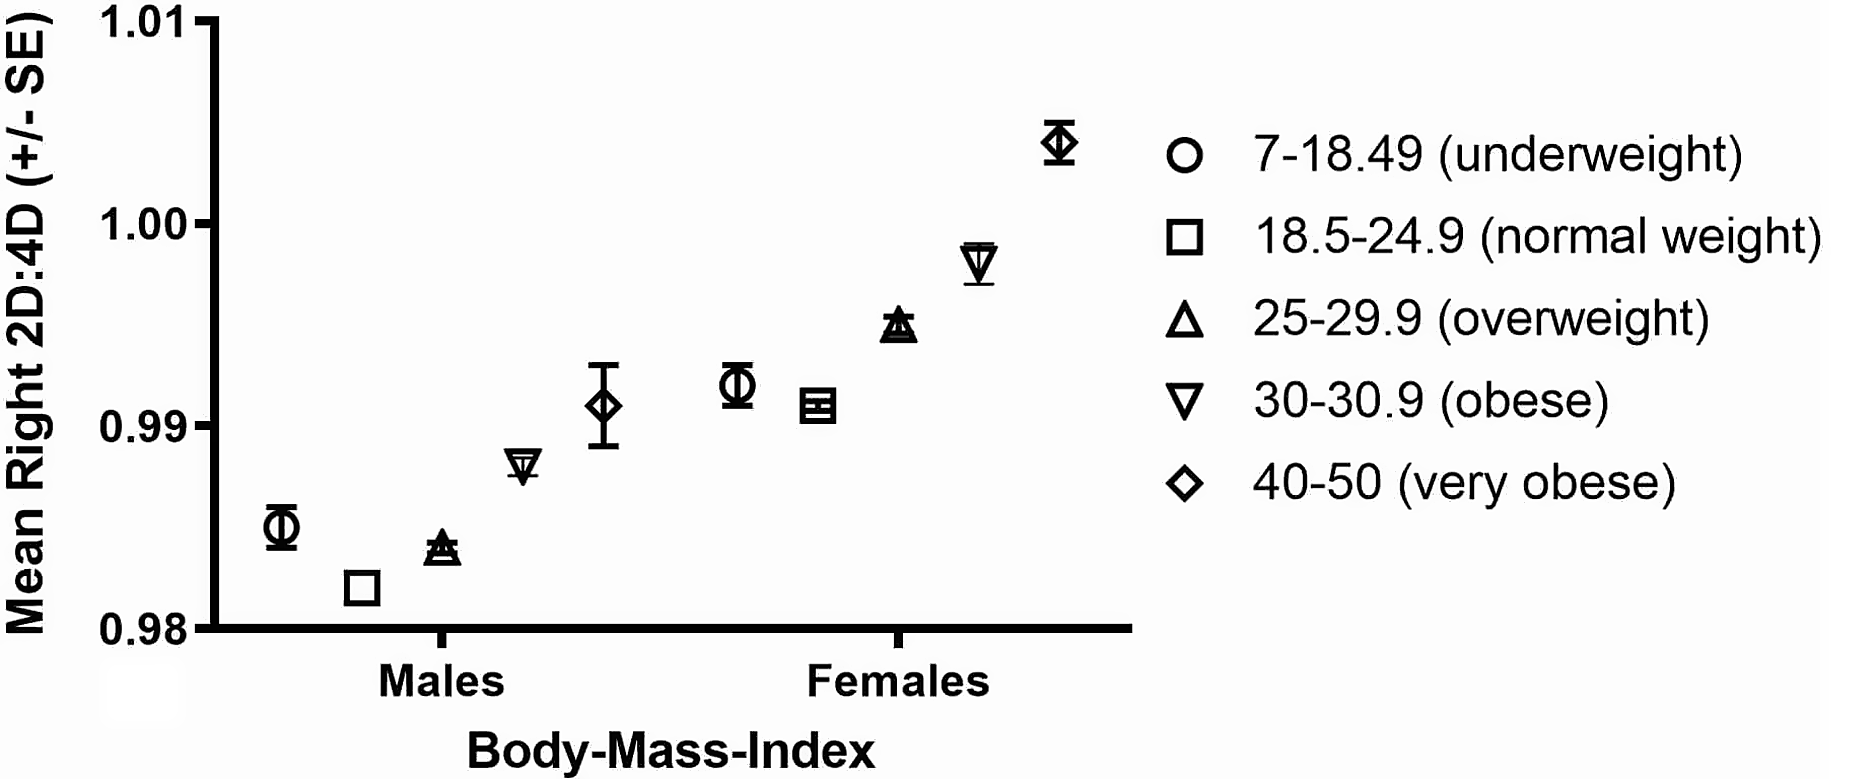
Figure 1. The relationship between mean (±SE) right-hand 2D:4D in five categories of BMI.
BMI relationships with 2D:4D at the national level
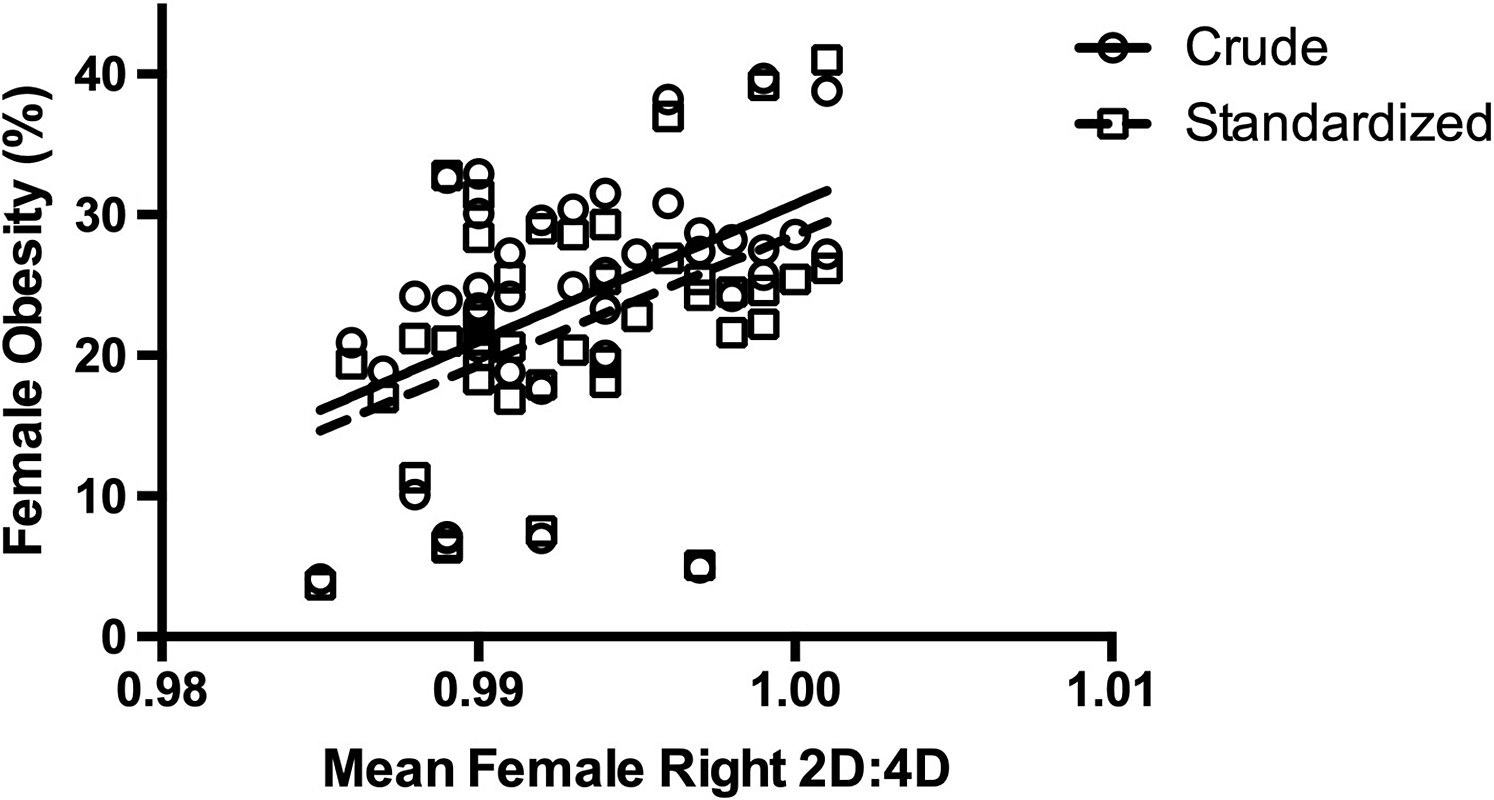
In addition to the analysis at the individual level, the associations of national means of BMI (and obesity prevalence) and 2D:4D were considered (Table 1). There were positive correlations of male and female (crude and age-standardized) BMI with right- and left-hand 2D:4D (Table 2). Similarly, 2D:4D showed positive relationships in males and females with (crude and age-standardized) obesity prevalence (Table 2). Overall, the correlations were larger in females than in males (see Figures 2 and 3 for illustrations of the relationships in females).
Table 2. Zero-order correlations (Pearson’s r) between national means of right- and left-hand 2D:4D and crude and age-standardized (std.) BMI and obesity prevalence, separately for males and females


Figure 2. The relationship between national means of female right-hand 2D:4D and BMI (crude and age-standardized).

Figure 3. The relationship between national means of female right-hand 2D:4D and obesity prevalence (crude and age-standardized).
Discussion
The present study revealed sex differences in BMI (males>females) with a weak effect size in a large, multi-national sample using self-reported information. Analyses at the individual level showed that BMI increased with age in both sexes and the effects of sex and age on BMI showed no interaction. Participants of parents with lower than average income had a higher than average BMI. The effect of parental income inequality on adult offspring BMI was stronger for female than for male participants. Linear regression analyses in males or females showed that BMI could be predicted by right or left 2D:4D (positively) and parental income (negatively) but not the age of the participant. The relationship between 2D:4D and BMI was stronger for female than for male participants. Associations between 2D:4D were not entirely linear in that the normal weight group (BMI 18.5–24.9) had the lowest 2D:4D, followed by overweight, obese and very obese individuals. Underweight participants had a mean 2D:4D higher than that in the normal and overweight groups. At the national level, the associations between mean 2D:4D per country and national means for BMI (crude and age-adjusted, total BMI, obese individuals) showed patterns that were similar to those for individuals. Positive associations were strongest for females with weak (and statistically non-significant) correlations for males.
Digit ratio is thought to be a negative correlate of prenatal T and a positive correlate of prenatal E. Male fetuses have higher T relative to E compared with female fetuses, thus 2D:4D shows a sexual dimorphism (males<females) as early as 8–12 weeks in utero (Malas et al., Reference Malas, Dogan, Evcil and Desdicioglu2006; Galis et al., Reference Galis, Ten Broek, Van Dongen and Wijnaendts2010). In general, correlations between 2D:4D and target traits are most likely to be statistically significant if the target trait shows a sex difference (Manning, Reference Manning2002). The present study detected a statistically significant but weak (Cohen’s d=0.11) sex difference in BMI (males>females). Online surveys suffer from issues concerning unreliability in self-report (Reimers, Reference Reimers2007). Therefore, the real effect size for the sexual dimorphism may be somewhat higher than d=0.11. However, it is still likely to be weak and this may explain why previous studies of associations between 2D:4D and BMI provided mixed evidence. Using a large, multi-national sample size, the present study detected positive associations between 2D:4D and BMI in females and males. These associations suggest that BMI in adults is positively related to low prenatal T and high prenatal E. However, it is noted that despite its size, the online sample may not give accurate values for the 2D:4D and BMI relationships due to accuracy issues self-reported digit lengths. Experimenter-measured (mean) 2D:4D ratios have SDs of about 0.03 while those from self-report are about 0.05 (Manning et al., Reference Manning, Morris and Caswell2007). Therefore, effect sizes for the relationship between 2D:4D and BMI may be up to three times greater than that reported here.
Concerning the finding of a negative relationship between parental income and the BMI of their children, Manning et al. (Reference Manning, Fink, Mason and Trivers2021) have reported that male and female children from mothers with below-average income are prenatally feminized (as assessed from high 2D:4D), and male and female children from mothers with above-average income are masculinized (low 2D:4D). To explain these patterns, a ‘Trivers–Willard’ effect (Trivers & Willard, Reference Trivers and Willard1973) has been suggested, i.e. the hypothesis of an adjustment of the offspring sex ratio in response to the maternal condition. The logic is as follows: males have a higher variance in their reproductive success than females (Bateman, Reference Bateman1948; Trivers, Reference Trivers and Campbell1972; but see Brown et al., Reference Brown, Laland and Borgerhoff Mulder2009). Sons from high-income mothers will have high reproductive success. Therefore, high-income mothers maximize their number of grandchildren by masculinizing their male offspring at the expense of their daughters. Sons from low-income mothers are unlikely to have high reproductive success. These mothers may maximize their number of grandchildren by feminizing their daughters at the expense of their sons (see also Trivers, Reference Trivers2002). Thus, this ‘Trivers–Willard’ effect may explain why high BMI is found in the children of low-income mothers, i.e. their sons and daughters may both be exposed to low prenatal T and high prenatal E. One influential metric of measuring income inequality across nations is that of the Gini coefficient (The World Bank. Gini index http://data.worldbank.org/indicator/SI.POV.GINI). Tomkinson et al. (Reference Tomkinson, Lang and Tremblay2019) estimated temporal trends in the cardiorespiratory fitness of children and adolescents in a sample of >900,000 children and adolescents from nineteen countries (collected from 137 studies). These authors detected a positive relationship between increasing childhood obesity, reduced cardiovascular fitness and income inequality, as measured by the Gini index. The current study suggests that these trends are consistent with a ‘Trivers–Willard’ effect on income inequality, BMI and increasing 2D:4D. In this regard, it is to be noted that 2D:4D is negatively related to running speed but that this relationship is dependent on distance. Thus 2D:4D explains <10% of the variance in sprinting speed in boys (Manning & Hill, Reference Manning2009) but >30% in running speed in middle- and long-distance races (Manning et al., Reference Manning, Morris and Caswell2007; Longman et al., Reference Longman, Wells and Stock2015). Performance in the former is dependent to a large extent on strength but in the latter cardiovascular fitness is much more important.
In conclusion, the present study found a positive association between 2D:4D and BMI in both men and women. The effect was stronger in women than in men, independent of age and was seen at the individual and the national level. It is suggested that BMI is positively related to low prenatal T and high prenatal E. An effect of parental income inequality on BMI was also found, i.e. low income was associated with high offspring BMI. Parental income inequality may influence prenatal sex steroids (through a ‘Trivers–Willard’ effect) and BMI, such that increases in income inequality result in reductions in prenatal T and increases in BMI.
Funding
This research received no specific grant from any funding agency, commercial entity, or not-for-profit organization.
Conflict of Interest
The authors have no conflicts of interest to declare.
Ethical Approval
The authors assert that all procedures contributing to this work comply with the ethical standards of the relevant national and institutional committees on human experimentation and with the Helsinki Declaration of 1975, as revised in 2008.


 Open access