


Introduction
Sex differences in health status are complex and evolve with the health transition, i.e. with declining mortality. For instance, in France women tend to live longer than men, and the difference between female and male life expectancy increased from +1.5 years in 1820–1849 to +8.2 years in 1980–1989, to decline in recent years to +6.0 years in 2015–2019 (INSEE, 2020). Sex differences in mortality differ by age and by causes of death, and these differences evolve with the health transition (Stolnitz, Reference Stolnitz1956; Preston, Reference Preston1976). These observations also apply to morbidity and mortality of children under-five (age 0–59 months): sex differences in mortality vary with age, with level of mortality in the population and with pathology or causes of death (Preston, Reference Preston1976; Garenne & Lafon, Reference Garenne and Lafon1998; Garenne, Reference Garenne2003). The excess male mortality in the neonatal and post-neonatal period is universal, in both developed and developing countries, and is usually more pronounced than excess male mortality at age 1–4 years (Preston, Reference Preston1976; Wells, Reference Wells2000; Garenne, Reference Garenne2003). Sex differences in under-five mortality remain small compared with socioeconomic differentials. In model life tables for developing countries, the sex ratio of under-five death rates averaged 1.08 at moderate level of mortality (122 per 1000 for males, 113 per 1000 for females) (United Nations, 1982). In African Demographic and Health Surveys (DHS) surveys, the sex ratio of under-five mortality averaged 1.11 (136 per 1000 for males, 122 per 1000 for females) (DHS, 2020).
Sex differences are also found in undernutrition of children in low- and middle-income countries, which could be expected because there is a positive correlation between prevalence of undernutrition and child mortality at country level, and because undernutrition is a risk factor for child mortality at the individual level (Pelletier, Reference Pelletier1994; Garenne et al., Reference Garenne, Maire, Fontaine, Dieng and Briend2000, Reference Garenne, Maire, Fontaine and Briend2006, Reference Garenne, Myatt, Khara, Dolan and Briend2018). Most studies conducted in developing countries show a higher prevalence of undernutrition among boys than among girls, especially for stunting, with the exception of the Indian subcontinent (Wamani et al., Reference Wamani, Åstrøm, Peterson, Tumwine and Tylleskär2007; Schoenbuchner et al., Reference Schoenbuchner, Dolan, Mwangome, Hall, Richard and Wells2019). In a recent meta-analysis of studies of children under-five across the world, stunting was more prevalent among boys in 32/38 studies (84%), wasting in 17/20 studies (85%) and underweight in 18/23 studies (78%) (Thurstans et al., Reference Thurstans, Opondo, Seal, Wells, Khara and Dolan2020). In published data from African DHS surveys, the prevalence of undernutrition was almost always higher for boys than for girls: 134/137 surveys for stunting, 115/136 surveys for wasting and 119/136 surveys for underweight (DHS, 2020).
The aim of this study was to analyse the evidence of sex differences in undernutrition of children in sub-Saharan Africa. Undernutrition was defined by anthropometric deficits in weight, height or both, as commonly done in population-based surveys (other definitions of undernutrition are used in clinical studies). This continent hosts populations with higher levels of undernutrition and higher levels of child mortality, although with major improvements in the past 50 years. This study focused on different manifestations of undernutrition (wasting, stunting, underweight), on age patterns and on relationships with levels of mortality. An earlier analysis of a smaller data set found only small sex differences in the proportion of children underweight (Garenne, Reference Garenne2003). The present article builds on previous work by considering the effect of declining under-five mortality, and by addressing the possibility of concurrent stunting and wasting – a dual deficit largely ignored until recently (Khara et al., Reference Khara, Mwangome, Ngari and Dolan2018; Myatt et al., Reference Myatt, Khara, Schoenbuchner, Pietzsch, Dolan, Lelijveld and Briend2018).
Methods
This study was based on all DHS surveys conducted in sub-Saharan Africa with information on child anthropometry available in early 2020, covering the period 1986–2017. The DHS surveys are based on large, representative, stratified samples of national populations. Anthropometric assessment of under-five children is done by well-trained fieldworkers and with state of the art equipment. All details of the survey methods can be found in the country reports. All calculations were done by using the sampling weights provided by the DHS programme. Individual data were retrieved from the DHS website, and pooled together. This sample included 128 surveys from 36 countries, and 700,114 children under-five – a very large sample allowing for multiple comparisons. The sample covered a wide variety of situations in terms of prevalence of undernutrition. According to DHS publications, based on the WHO/MGRS-2006 standard, the range of prevalence of undernutrition was wide in Africa: from 16.5% to 60.4% for stunting; from 1.6% to 26.9% for wasting; and from 5.4% to 44.2% for underweight (DHS, 2020). The sex ratios of prevalence of undernutrition (ratio of male-to-female prevalence) were always higher than 1 or equal to 1 across surveys. The sex ratio of prevalence averaged 1.13 for stunting, 1.17 for wasting and 1.15 for underweight, showing overall a higher susceptibility of boys. In the same sample, there was also a wide range of under-five mortality levels, ranging from 50 to 318 deaths per 1000 in the five years preceding the survey. The sex ratio of under-five mortality was of similar magnitude, and on average equal to 1.13 (DHS, 2020).
The method of analysis for this study was a straightforward statistical analysis of the prevalence of undernutrition by sex among children under-five. This study utilized classic definitions of undernutrition, according to Waterlow’s classification (Waterlow, Reference Waterlow1972; Waterlow et al., Reference Waterlow, Buzina, Keller, Lane and Nichaman1977): ‘wasting’ as weight-for-height Z-score: WHZ<−2.0; ‘stunting’ as height-for-age Z-score: HAZ<−2.0; ‘underweight’ as weight-for-age Z-score: WAZ<−2.0; ‘concurrent wasting and stunting’ as WHZ & HAZ <−2.0. The anthropometric norms utilized for this study were the CDC-2000 growth charts (CDC, 2000; Kuczmarski et al., Reference Kuczmarski, Ogden, Grummer-Strawn, Flegal, Guo and Wei2000, Reference Kuczmarski, Ogden, Guo, Grummer-Strawn, Flegal and Mei2002; Ogden et al., Reference Ogden, Kuczmarski, Flegal, Mei, Guo and Wei2002). This reference set was selected because it was found to be more consistent in defining wasting and stunting than other reference sets, as will be seen in this study. Also, the difference between boys’ and girls’ anthropometry (weight and height) was more pronounced (average difference of 0.550 kg for weight and 1.41 cm for height), and was stable with age between 12 and 59 months, as is the case in real life. The DHS surveys use other reference sets, in particular the DHS/NCHS-1976 reference set and the WHO/MGRS-2006 standard (Hamill et al., Reference Hamill, Drizd, Johnson, Reed, Rocher and Moore1979; World Health Organization, 2006). These other reference sets were used for comparisons, as they produce different sex differences. Sex differences in the prevalence of undernutrition were computed as the ratio of prevalence of malnutrition for males to that for females (labelled ‘sex ratio of prevalence’). They were analysed as a function of the level of mortality, measured by the under-five mortality rate, labelled ‘q(5)’, and by 6-months age groups. The level of mortality was that published in the DHS final reports and refers to the five years before survey, which reflects the mortality situation of cohorts aged 0–4 years at the time of the anthropometric assessment. Statistical testing of differences in sex ratios was done using classic statistical tests for risk ratios. The relationship of sex differences with level of mortality was tested with a linear-logistic regression model.
Results
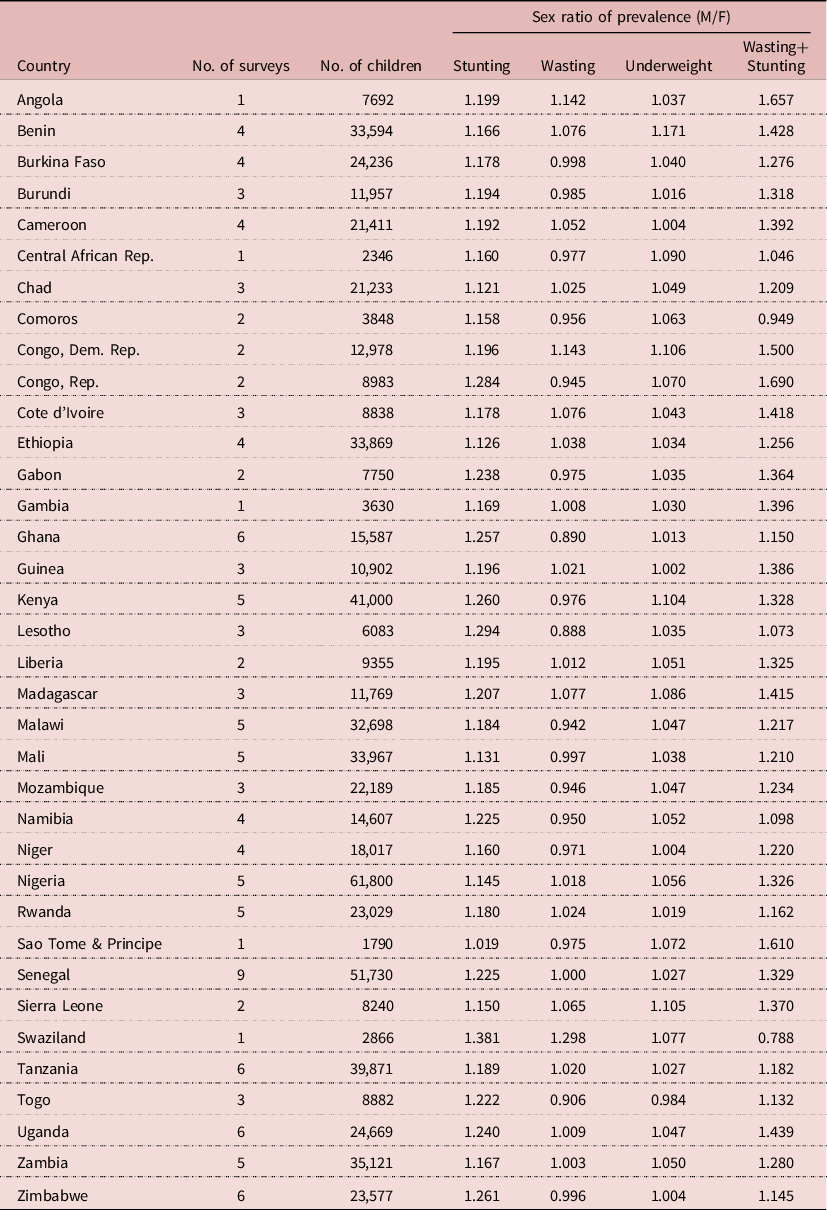
The sample included a total of 700,114 children under five years from 128 surveys of 36 African countries. All surveys were based on representative samples of national populations at various points in time, ranging from 1986 to 2017. Selected countries had an average of 3.5 surveys, ranging from 1 to 9, the highest being Senegal, which has been conducting ‘continuous DHS surveys’ every year since 2013. Survey results were consistent and showed an excess male susceptibility to stunting and concurrent wasting and stunting (sex ratio of prevalence >1), and hardly any significant difference in wasting prevalence between boys and girls (Table 1).
Table 1. Sex ratio of undernutrition prevalence for African countries
Sex differences by type of undernutrition
For the sample as a whole, boys were more susceptible to undernutrition than girls. The sex ratio of prevalence (male/female) of stunting was 1.182 (95% CI = 1.172–1.192, p<10–-6), that of wasting was 1.012 (95% CI = 1.001–1.025, p = 0.041), that of underweight was 1.050 (95% CI = 1.041–1.059, p<10–6) and that of concurrent wasting and stunting was 1.286 (95% CI = 1.258–1.316, p<10–6). Seen in a broad perspective, differences between boys and girls were rather small: hardly significant for wasting (+1%), very small for underweight (+5%), small for stunting (+18%) and moderate for concurrent wasting and stunting (+29%). When studied by survey, the results were quite homogeneous: stunting was always more prevalent among boys (128 surveys), and the sex ratio was significantly higher than 1.0 in 105 surveys; the sex ratio of wasting was higher than 1.0 in 60 surveys, lower than 1.0 in the other 68 surveys but significantly different from 1.0 in only two surveys, which could be attributed to random fluctuations; the sex ratio of underweight was higher than 1.0 in 94 surveys, lower than 1.0 in 34 surveys, significantly higher than 1.0 in 23 surveys and never significantly lower than 1.0; the sex ratio of concurrent wasting and stunting was higher than 1.0 in 112 surveys, lower than 1.0 in 12 surveys, significantly higher than 1.0 in 52 surveys and never significantly lower than 1.0. When analysed by country, the sex ratio was always higher than 1.0 for stunting, underweight and concurrent wasting and stunting; for wasting it was higher than 1.0 in eighteen countries and lower than 1.0 in eighteen countries, none of these differences being statistically significant (Table 2).
Table 2. Sex ratio of undernutrition prevalence by selected characteristics, African DHS surveys (pooled sample of children aged 0–59 months; CDC-2000 reference set)
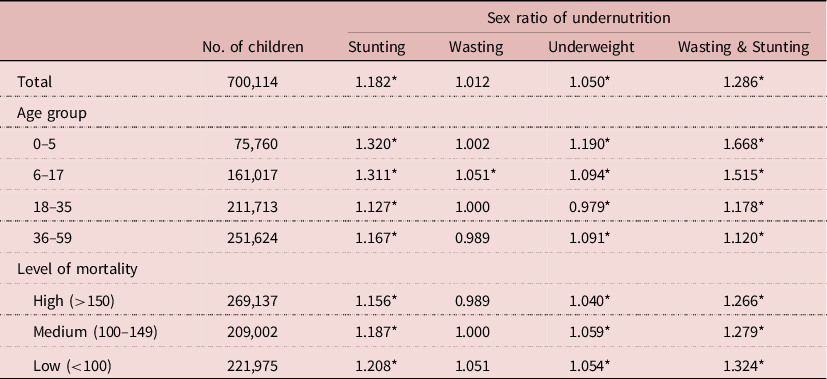
Sex ratio=prevalence among boys/prevalence among girls; testing sex ratio <>1: *p<0.05.
Age pattern
As found in all studies, the prevalence of undernutrition varied with age, and this also applied to sex differences. The sex ratio of prevalence tended to decline with age in three out of four types of undernutrition. For stunting it declined from 1.320 at age 0–5 months to 1.167 at age 36–59 months; for wasting there was no significant change; for underweight the sex ratio of prevalence declined from 1.190 to 1.091; and the largest decline was found for concurrent wasting and stunting, ranging from 1.669 at age 0–5 months to 1.120 at age 36–59 months (Table 2). When plotted by 6-month age groups, the patterns were found to be quite regular and stable. The most striking pattern was that of concurrent wasting and stunting, the sex ratio of which declined markedly from 0–5 months to 24–29 months, then stabilized at lower levels. The decline in the sex ratio of stunting with age was also noticeable, and followed a similar pattern stabilizing at older ages. In comparison, differences in sex ratios of wasting and underweight by age were small (Figure 1).
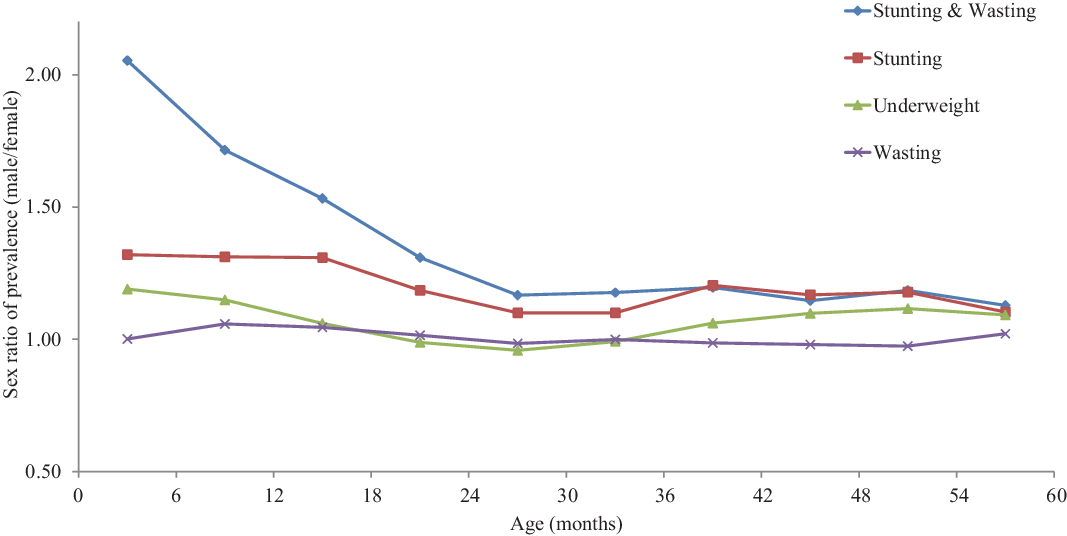
Figure 1. Sex differences in undernutrition by age for children under-five, African DHS surveys, CDC-2000 reference set.
Relationship with level of mortality
As is the case for the sex ratio of under-five mortality, the sex ratio of undernutrition prevalence tended to increase when the mortality level was declining, revealing an increasing advantage for girls when the health situation improved. The sex ratio for stunting increased from 1.156 to 1.208 when the mortality level went from high values (q(5)>150 per 1000) to low values (q(5)<100 per 1000). Likewise, the sex ratio for concurrent wasting and stunting increased from 1.266 to 1.324, that of underweight from 1.040 to 1.054 and that of wasting from 0.989 to 1.051. A linear regression on the sex ratio was run on the level of under-five mortality. In three cases (stunting, underweight, concurrent wasting and stunting) trends were statistically significant at p<0.001, while there was no significant difference for wasting. The magnitude of changes in the sex ratios of prevalence from high levels of mortality (300 per 1000) to low levels (50 per 1000) were striking: +10.5% for concurrent wasting and stunting (from 1.193 to 1.318), +10.5% for stunting (from 1.114 to 1.231), +4.6% for underweight (from 1.012 to 1.059) but none for wasting, which averaged 1.0 (Table 3).
Table 3. Relationship between sex ratio of undernutrition prevalence and level of under-five mortality, African DHS surveys, pooled sample (fitted by log-linear regression)
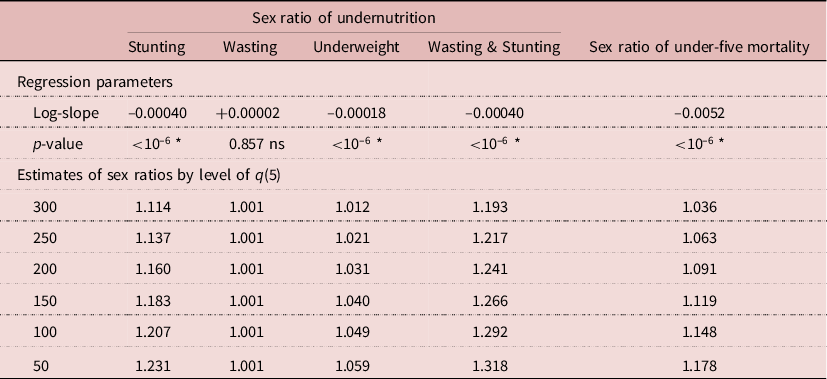
Testing slope <>0; *p < 0.05; ns, not significant; q(5) = under-five mortality per 1000.
Effect of the anthropometric reference set
Comparison of sex differences in prevalence of undernutrition between the three anthropometric reference sets could be done on a sub-sample of 340,552 children available in the DHS files with both NCHS-1977 and WHO-2006 – about half of the original sample. Firstly, there were large differences in prevalence of undernutrition according to the reference set – a difference widely noticed earlier (Eckhardt & Adair, Reference Eckhardt and Adair2002; De Onis et al., Reference De Onis, Garza, Onyango and Borghi2007). In the sub-sample, the prevalence of stunting for both sexes ranged from 26.1% with CDC-2000, 29.5% with NCHS-1977 and 34.5% with WHO-2006. The prevalence of wasting ranged from 15.3% with CDC-2000, 7.7% with NCHS-1977 and 8.6% with WHO-2006. The prevalence of underweight ranged from 27.9% with CDC-2000, 23.2% with NCHS-1977 and 18.8% with WHO-2006. Lastly, the prevalence of concurrent wasting and stunting ranged from 3.8% with CDC-2000, 2.1% with NCHS-1977 and 2.7% with WHO-2006. In brief, the WHO-2006 standard expected the children to be taller and lighter than CDC-2000 (Table 4).
Table 4. Prevalence and sex ratio of undernutrition according to anthropometric reference set, African DHS surveys (pooled sample, N = 3,400,552 children aged 0–59 months)
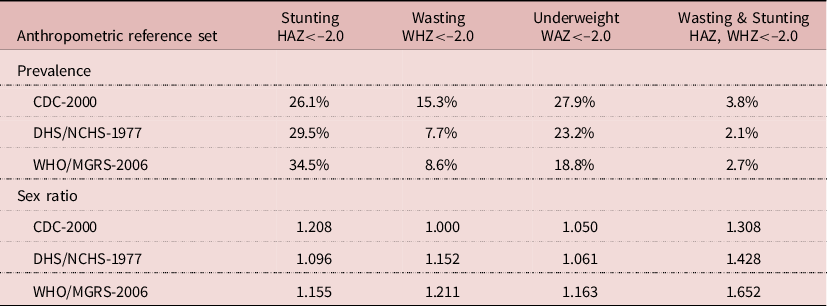
The sex ratios of prevalence of undernutrition were also affected by the reference set. The sex ratio of stunting prevalence was 1.208 with CDC-2000, 1.096 with NCHS-1977 and 1.155 with WHO-2006. The sex ratio of wasting prevalence was 1.000 with CDC-2000, 1.152 with NCHS-1977 and 1.211 with WHO-2006. The sex ratio of underweight prevalence was 1.050 with CDC-2000, 1.061 with NCHS-1977 and 1.163 with WHO-2006. Lastly, the sex ratio of concurrent wasting and stunting prevalence was 1.308 with CDC-2000, 1.428 with NCHS-1977 and 1.652 with WHO-2006. Therefore, the appreciation of sex differences in undernutrition was seriously affected by the choice of the reference set. In particular, using WHO-2006 indicated that boys were more susceptible to wasting than girls, while using CDC-2000 showed no difference in wasting between boys and girls (Table 4).
Discussion
This study from Africa confirmed the higher susceptibility of boys to undernutrition. The results from this study, based on representative samples of African child populations, were consistent with those of a recent meta-analysis of smaller surveys all over the world: similar values of the sex ratios and similar differences between stunting and wasting (Thurstans et al., Reference Thurstans, Opondo, Seal, Wells, Khara and Dolan2020). In particular, in this large sample, there was no evidence of a higher prevalence of undernutrition among girls. When it occurred in a particular country or in a survey, the difference could be explained by random fluctuations (Garenne, Reference Garenne2003).
Altogether, sex differences in the prevalence of undernutrition appeared small compared with other differentials, such as socioeconomic differentials. In the sample of African DHS, the differentials in underweight prevalence between lowest and highest wealth quintile averaged 2.8-fold, and occasionally exceeded 4.0-fold (9% of surveys) – that is 20 to 40 times larger than sex differences (DHS, 2020).
Sex differences varied by type of malnutrition, and this was found whatever the reference set used. The largest differentials were found in concurrent wasting and stunting, followed by differentials in stunting. Sex differences in concurrent wasting and stunting were more than the sum of sex differences in each component, revealing complex layers of vulnerabilities. The age pattern of stunting and concurrent wasting and stunting, with greatest sex differences found in the early ages, suggests that these conditions could originate, at least in part, in intra-uterine growth restriction. As such, they could be related with prematurity or other intra-uterine pathology, which could be risk factors for stunting later in life, and more severe for boys than for girls.
The pattern observed for wasting showed hardly any difference between boys and girls, except in the 6–17 months age group, where prevalence of wasting was highest. Furthermore, the sex difference in wasting prevalence did not change with declining level of mortality. This could be due to similar metabolic responses to nutrition and infection stress between boys and girls. Being underweight is due to stunting, wasting or a combination of both, so that sex differences in underweight fall in between those of the underlying conditions.
The overall prevalence of undernutrition declined in tandem with decreasing mortality in the population, but the sex differences of undernutrition increased with declining mortality, as has been observed for sex differences in mortality. This latter fact has also been noted in Europe. For instance in Sweden, the sex differences in under-five mortality increased from 7.3% in the 1750s to 32.1% in the 1960s when under-five mortality declined from 327 to 17 per 1000 over the same period of time. Similar trends in sex differences in under-five mortality were observed in France from the 1810s (8.4%) to the 1980s (31.8%), as well as in England & Wales from the 1840s (11.9%) to the 1970s (28.5%) (Human Mortality Database, 2020). This shows that girls tend to benefit more than boys from health improvements, at least to a certain point (trends in sex differences in under-five mortality were reversed after 1980 in England & Wales, France and Sweden).
Sex differences in the prevalence of undernutrition appear complex: they differ with the type of undernutrition, with age and with level of mortality. Theories could be proposed to explain these patterns, separately for stunting and wasting. They refer to differences between boys and girls in energy requirements, body composition, susceptibility to infectious diseases, hormonal systems and intra-uterine development. Stunting is seen here as an adaptation to difficult situations, where the body tries to maintain the balance between weight and height by reserving ponderal growth whilst limiting linear growth. Wasting is seen here as a response to stress, due to infectious diseases, food deficit or both.
With respect to nutritional status, boys and girls differ first in weight. In the sample of African DHS surveys, the average weight difference between boys and girls was 411 g, with only minor variations with age (475 g at 6–17 months, 414 g at 18–35 month, 360 g at 36–59 months). Therefore boys require more energy for maintenance and for growth, since there is no difference in energy requirements between boys and girls when controlling for weight (Butte et al., Reference Butte, Wong, Hopkinson, Heinz, Mehta and Smith2000). As a result, in food-scarce situations, and assuming no sex difference in food allocation, boys seem more likely to become malnourished. Secondly, boys and girls differ in body composition: boys have more muscle (bigger lean mass) and girls have more fat. Muscle has a lower energy content than fat, and has a higher cost of maintenance. In contrast, fat is easier to break down and to be converted for other metabolic purposes. This could explain why girls resist better food shortage (as shown also in famine situations), and therefore sex differences in wasting. This difference could also contribute to smaller sex differences in mortality in high-mortality situations, because low muscle mass (as measured by arm circumference) is a major risk factor for child survival (Briend et al. Reference Briend, Garenne, Maire, Fontaine and Dieng1989; Garenne et al., Reference Garenne, Maire, Fontaine and Briend2006).
With respect to infectious diseases, the argument refers to the ‘synergistic effect of malnutrition and infection’, a concept introduced by Nevin Scrimshaw and colleagues some 50 years ago (Scrimshaw et al., Reference Scrimshaw, Taylor, Gordon, Everett and World Health1968; Scrimshaw & San-Giovanni, Reference Scrimshaw and San-Giovanni1997; Scrimshaw, Reference Scrimshaw2003). At the individual level, the more infected a child, the more malnourished the child is likely to become, and the higher the risk of death; and conversely, the more malnourished a child is, the higher the susceptibility to infection and the risk of death. Since boys and girls appear to differ in their susceptibility to infectious diseases (Garenne & Lafon, Reference Garenne and Lafon1998), one could expect differences in undernutrition, differences in age pattern, as well as changing differentials with progress in the health transition. In particular, in high-mortality populations, diseases known to be more deleterious to girls (measles, whooping cough, tuberculosis, streptococcal infections, etc.) are important causes of morbidity, undernutrition and mortality (Garenne & Lafon, Reference Garenne and Lafon1998). They tend to disappear with improving disease control, providing a comparative advantage to girls.
Boys and girls also differ in endocrinal systems. Linear growth, determining stunting, is largely determined by hormonal dynamics, which are modulated by food intake, infectious diseases and interferences with the immune system, in particular inflammation (Morgan et al., Reference Morgan, Dennis, Ruffman, Bilkey and McLennan2011; Briend et al., Reference Briend, Khara and Dolan2015; DeBoer et al., Reference DeBoer, Scharf, Leite, Férrer, Havt and Pinkerton2017; Millward, Reference Millward2017). As a consequence linear growth may differ between boys and girls, and the balance is likely to change with the control of infectious and parasitic diseases. Although the precise mechanisms remain poorly documented, one could at least hypothesize that differences in hormonal systems could contribute to the sex differences in stunting described here.
Lastly, intrauterine life seems to also play a role. Many studies have shown how intra-uterine development shapes the health of young children, with a strong influence until at least age 24 months (Eriksson et al., Reference Eriksson, Kajantie, Osmond, Thornburg and Barker2010; Alur, Reference Alur2019). Male and female fetuses differ in intra-uterine growth from the first weeks of pregnancy, and they respond differently to the same intrauterine environment (Alur, Reference Alur2019). Levels of growth hormones (Leptin; Insulin-like Growth Factor-1, or IGF-1; IGF binding protein-3, or IGFBP-3) are higher in females than in males (Alur, Reference Alur2019). The male fetus has been shown to be at greater risk for a variety of conditions originating in the intra-uterine period, and in particular for prematurity and intra-uterine growth retardation (Wells, Reference Wells2000; Kraemer, Reference Kraemer2000). These differences could explain the high sex ratios observed for stunting and concurrent wasting and stunting in early life.
The influence of the anthropometric reference set for assessing sex differences was an unexpected finding of this study. Although the main pattern remained, in particular the universal higher susceptibility of boys to undernutrition, different reference sets could lead to different conclusions, notably concerning wasting. The CDC-2000 growth charts are based on a sample of the American population – a heterogeneous population in terms of ethnic composition and socioeconomic status. In contrast, the WHO/MGRS-2006 sample is more selective: even if it included children from various countries, it selected very healthy and exclusively breastfed children, and tended to exclude many outstanding cases. In a sense, the CDC-2000 growth charts represent more of an average heterogeneous population in a developed country with low mortality, while the WHO/MGRS-2006 standards represent more of an ‘ideal type’ population in favoured socioeconomic conditions in various parts of the world. In addition, exclusive breastfeeding tends to promote linear growth, and to produce taller and thinner children (Martin et al., Reference Martin, Davey Smith, Mangtani, Frankel and Gunnell2002). What the best reference set is to be used for comparisons of such nature remains a matter of debate. In the Niakhar, Senegal study, both reference sets were used to screen for children at risk of death, and in this case CDC-2000 performed slightly better than WHO/MGRS-2006 in terms of sensitivity and specificity. Another positive feature of CDC-2000 is that the prevalences of stunting and underweight are usually consistent, while they differ widely with WHO-2006. In fact, when children have a low height-for-age, they are expected to also have a low weight-for-age, unless they are overweight. For instance, in the sub-sample used for the comparison, WHO/MGRS-2006 gave a prevalence of stunting of 34.5% and a prevalence of underweight of only 18.8%, which is hard to reconcile, while CDC-2000 gave more consistent values (26.1% and 27.9% respectively).
In conclusion, sex differences in undernutrition are small in Africa (as elsewhere in the world), and they are not fixed: they vary with age, and with level of mortality. Boys appear to have a higher susceptibility to undernutrition, which is driven by a range of complex factors evolving over time. In particular, girls seem to benefit more from the health transition than boys, as is the case for general mortality. However, recent trends in Europe show a reversal, with smaller sex differences in under-five mortality and in life expectancy. Whether or not sex differences in Africa will also follow this pattern remains to be determined.
Acknowledgments
This study was supported by Institut Pasteur, Paris, France and IRD, Paris, France, without any external grant. The authors thank the DHS programme and the National Statistical Institutes for providing free access to survey data.
Funding
This research received no specific grant from any funding agency, commercial entity or not-for-profit organization.
Conflicts of Interest
The authors have no conflicts of interest to declare.
Ethical Approval
This research was conducted in accord with prevailing ethical principles. Data used for the study are publicly available in open access.
Author Contributions
The paper was the result of intensive discussion in the group, following work by MG, ST, AB and others on the same issue. MG conducted the statistical analysis and wrote the first draft. All authors contributed significantly through arguments, comments and references during the writing process. All authors agreed with the final version.


 Open access