


1 Introduction
The value of a statistical life (VSL) is often the critical policy parameter in benefit-cost analyses of health and safety risk regulations and other policies.Footnote 1 Despite the importance of the VSL in identifying efficient regulatory policies, many nations lack accurate VSL measures. Economists have devoted substantial attention to calculating the VSL in the United States and other developed nations, but there is a relative paucity of studies measuring the VSL in poorer nations. Labor market revealed preference studies of the VSL are virtually nonexistent outside of higher income countries, and reliable stated preference estimates are often unavailable as well. The countries that lack these VSL estimates cannot simply adopt United States or other higher income nations’ numbers because there is substantial heterogeneity among countries across dimensions that likely affects the VSL. Income levels, life expectancies, and social norms regarding risk and death may influence a particular nation’s VSL and thus make it inappropriate to simply transfer the VSL across countries (Hammitt, Reference Hammitt2017).
Most countries lack either reliable stated preference studies or labor market studies for setting a population-average VSL. A VSL could be calculated for every country by fielding stated preference studies that ask citizens for their preferences concerning money-risk tradeoffs (Hoffmann, Krupnick & Qin, Reference Hoffmann, Krupnick and Qin2017). Stated preference studies estimating the VSL have become increasingly common in recent years, in part because such studies can estimate a VSL from any form of fatality risk that the researcher wishes to investigate (Cropper, Hammitt & Robinson, Reference Cropper, Hammitt and Robinson2011). However, policymakers generally prefer revealed preference methods for monetizing regulatory benefits and costs because they are based on actual rather than hypothetical transactions.Footnote 2
Labor market hedonic wage studies that measure the compensating differentials for workplace fatality risks provide an alternative to stated preference studies, but most countries lack sufficiently detailed workplace fatality data and employment datasets. VSL estimates that utilize insufficiently detailed fatality data will exhibit attenuation bias toward zero from measurement error. Publication selection bias, which occurs whenever journals and researchers are systematically less willing to report or publish estimates falling outside of an accepted range, is greater when available data suffer from significant measurement error. As a result, in the absence of detailed and accurate data on workplace fatalities, VSL estimates will suffer from attenuation and publication selection biases (Viscusi, Reference Viscusi2015). These biases are even more prevalent in non-U.S. labor market studies than U.S. studies (Viscusi & Masterman, Reference Viscusi and Masterman2017). While some of the bias in non-U.S. VSL estimates is attributable to data deficiencies, much of the rampant publication selection bias in international estimates exists because non-U.S. researchers anchor on U.S. estimates of the VSL (Viscusi & Masterman, Reference Viscusi and Masterman2017).Footnote 3 To the extent that stated preference studies are also subject to biases from the use of U.S. evidence as an anchor for what values are reasonable and merit publication, these estimates likewise may suffer from publication selection effects. More research is needed to determine the extent to which stated preference VSL studies also suffer from publication selection biases. Fortunately, U.S. VSL estimates that utilize the Census of Fatal Occupational Injuries (CFOI) data are not subject to many of the biases that plague VSL estimates using other data, both in the United States and internationally (Viscusi, Reference Viscusi2015, Reference Viscusi2017; Viscusi & Masterman, Reference Viscusi and Masterman2017).
This article proposes that countries adopt VSL estimates for public policy by adjusting a base U.S. VSL using our estimate of the international income elasticity of the VSL and the relative incomes of the United States and the country of interest. This benefit transfer method of coupling income elasticities with a baseline VSL is used in Viscusi (Reference Viscusi1993) to derive VSL estimates for airline safety based on labor market VSL estimates for a population that has lower income than airline passengers. Hammitt and Robinson (Reference Hammitt and Robinson2011) expand on this technique, including its potential applicability in international studies. This approach provides policymakers with a VSL based on the best available empirical evidence while preserving the flexibility to choose their preferred methodology for calculating the critical input parameters: the base VSL, the income elasticity of the VSL, and the measure of income for the United States and the country of interest. The flexibility to choose among various base U.S. VSLs, measures of income, and income elasticities may be important; regulators and researchers often fail to agree on the optimal way to infer the policy-relevant VSL value from the economic literature.Footnote 4 We use this benefit transfer method to calculate VSL estimates for 189 different countries.
Section 2 presents a brief summary of our preferred VSL and existing estimates of the income elasticity of the VSL in the literature. The preferred base VSL of $9.6 million for our calculations is the estimate from U.S. CFOI studies after controlling for publication selection bias drawn from Viscusi (Reference Viscusi2015) and Viscusi and Masterman (Reference Viscusi and Masterman2017).Footnote 5 Given the absence of substantial publication selection biases for VSL studies using the CFOI data, others may prefer either the mean or median CFOI estimates without bias adjustments, and we present those as well.
While there have been numerous estimates of the income elasticity of the VSL, there are no estimates based on labor market data that distinguish the elasticities for the United States and non-U.S. countries. Section 3 presents our dataset of 953 labor market VSL estimates from 68 studies to estimate the income elasticity of the VSL for U.S. and non-U.S. VSLs. Section 4 presents our estimates of the income elasticity. In Section 4.1, we compare the elasticities for U.S. studies and non-U.S. studies, finding substantial evidence that the income elasticity of the VSL for the United States is smaller than the elasticity in non-U.S. countries. Section 4.2 examines the income elasticity of the VSL throughout the VSL distribution, demonstrating that the elasticity is larger for small VSLs and vice versa, thus providing the empirical rationale for why the international income elasticity of the VSL exceeds the domestic value and suggesting that the income elasticity is larger at lower income levels.
Section 5 presents VSL estimates for countries throughout the world using our benefit transfer approach. We present two sets of transferred VSLs. The first set uses 2015 World Bank gross national income (GNI) per capita and income level classifications to demonstrate VSLs for low, lower-middle, upper-middle, and upper income economies. The World Bank GNI per capita measure of income is convenient because it is the largest collection of national income measures available, and the World Bank’s income classification levels are widely used as meaningful reference points. Our preferred international income elasticity of 1.0 results in a transferred VSL of $107,000 for low income economies, $420,000 for lower-middle income economies, $1.2 million for upper-middle income economies, and $6.4 million for upper income economies. The second set of estimates applies our methodology to all 189 countries for which 2015 GNI per capita numbers are available. The transferred VSLs vary greatly across countries, as do the national incomes they are based upon. The VSLs range from a low of $45,000 for Burundi to a high value of $18.3 million for Bermuda.
2 Reviewing base VSLs and the income elasticity literature
2.1 Choosing a base VSL
Our calculations utilize a base U.S. VSL of $9.6 million. Viscusi (Reference Viscusi2015) and Viscusi and Masterman (Reference Viscusi and Masterman2017) derived this value from a meta-analysis of VSL estimates utilizing CFOI estimates that accounted for publication selection bias. This estimate is similar to the $9.4 million value used by the U.S. Department of Transportation (2016), the $9.7 million ($2013) value used by the U.S. Environmental Protection Agency (2016), and the $9.6 million ($2014) value used by the U.S. Department of Health and Human Services (2016). Our point estimate corrected for estimated publication selection effects, though the estimated biases were not statistically significant in the 2017 study. Nonetheless, if policymakers prefer other VSLs to our $9.6 million value, the transfer method accommodates alternative values. If base income is held constant, different base VSLs result in a proportional change in the transferred VSL. The unadjusted median and mean VSL estimates based on the CFOI data are $13.1 million and $11.1 million, while the median and mean using only the best estimates from these studies using the CFOI data are $10.2 million and $11.8 million.Footnote 6 Our baseline VSL estimate is slightly below the median of all labor market VSL estimates in our sample, $9.7 million, and $2.4 million smaller than the full mean of the sample at $12.0 million.Footnote 7 Our baseline estimate is also lower than the full sample best set median and mean of $10.1 million and $12.2 million. The VSL estimates using fatality rates from the CFOI are superior to all other U.S. labor market estimates. Because the CFOI is a complete census of occupational fatalities rather than a survey subject to voluntary responses, the data are subject to significantly less measurement error than other sources. The resulting VSL estimates exhibit less attenuation and publication selection biases.
The U.S. CFOI base VSL is larger than base values that others have used to estimate VSLs for non-U.S. countries. For example, the World Bank uses a base VSL of $3.8 million, calculated using a base GDP per capita of $37,350 as their measure of income (both figures in $2011, calculated using purchasing power parity) (Narain & Sall, Reference Narain and Sall2016). The Organisation for Economic Co-operation and Development (OECD) uses a base mean of $3.0 million for all OECD countries, using a base GDP per capita of $34,661, and $3.6 million for the European Union, using a base GDP per capita of $31,858 (each of these figures in $2005, calculated using purchasing power parity) (OECD, 2012). Each of the World Bank and OECD values is derived by taking the mean of a set of studies that meet a certain threshold for reliability. All of the studies in their datasets are based on stated preference methods. We prefer the U.S. CFOI values to a value derived from stated preference studies because revealed preference studies avoid hypothetical bias (Murphy et al., Reference Murphy, Allen, Stevens and Weatherhead2005). Moreover, a meta-analytic approach is preferable to constraining the set of studies and taking a mean of the constrained set, which induces potential biases in terms of the selection of studies. An alternative to constraining the set of studies is to control for preferred estimate characteristics in a meta-analytic regression and calculating a mean fitted value using the preferred attributes.
2.2 Existing estimates of the VSL income elasticity
There have been numerous estimates of the income elasticity of the VSL. The most common methodology for estimating the income elasticity of the VSL has been a meta-analysis of existing VSL estimates, which is the approach we adopt here.Footnote 8 Most past estimates of the population-average VSL income elasticity for the United States and other high income countries fall between 0.6 and 1.0, with numbers closer to 0.6 being more common. Meta-analyses that estimate elasticities in that range include Viscusi and Aldy (Reference Viscusi and Aldy2003) (0.46–0.61) and Bellavance, Dionne and Lebeau (Reference Bellavance, Dionne and Lebeau2009) (0.4–0.75). Doucouliagos, Stanley and Viscusi (Reference Doucouliagos, Stanley and Viscusi2014) estimated income elasticities of 0.25 to 0.63 in their meta-meta-analysis of income elasticity estimates, with most of the estimates between 0.5 and 0.63. OECD (2012) estimated income elasticities using stated preference studies from multiple countries; the estimated elasticities were between 0.7 and 0.9 using their preferred screening criteria for studies included in the analysis, although the elasticities were as low as 0.3 in some subsets of their data and increased to 1.0 with an unscreened sample. Hoffmann et al. (Reference Hoffmann, Krupnick and Qin2017) estimated income elasticities between 0.2 and 0.6 using stated preference studies covering several countries. Doucouliagos, Stanley and Giles (Reference Doucouliagos, Stanley and Giles2012) demonstrated that controlling for publication selection bias results in a lower estimated VSL income elasticity, finding a range of elasticities between 0.20 and 0.38. A few studies have found elasticities that greatly exceed the 0.6 to 1.0 range – for example, Costa and Kahn (Reference Costa and Kahn2004) found elasticities of 1.5–1.7 based on changes in worker income levels over time, and Kniesner, Viscusi and Ziliak (Reference Kniesner, Viscusi and Ziliak2010) also estimated income elasticities above 1.0 across the wage distribution. There are no VSL income elasticity estimates based on labor market data that distinguish the elasticities for the United States and non-U.S. countries.
3 Sample description for estimation of the income elasticity of the VSL
Our sample of labor market VSL estimates contains estimates from each study included in Viscusi and Aldy (Reference Viscusi and Aldy2003), Bellavance et al. (Reference Bellavance, Dionne and Lebeau2009), Viscusi (Reference Viscusi2015), and Viscusi and Masterman (Reference Viscusi and Masterman2017). The full list of papers from which we draw VSL estimates can be found in the Supplementary materials. Our whole sample includes 953 estimates reported in 68 different studies. Of this group, 763 of the estimates constituting 43 studies estimate the VSL in the United States. A substantially smaller set of 190 VSL estimates in 25 studies are from non-U.S. countries. The 13 countries covered in those studies are Australia, Austria, Canada, Chile, Germany, India, Japan, Pakistan, Poland, South Korea, Switzerland, Taiwan, and the United Kingdom. As of 2015, the World Bank classifies ten of these countries as high income and two of these countries as lower-middle income. The GNIs per capita of the high income countries range from $13,400 to $84,630, while the lower-middle income economies have GNIs per capita of $1440 and $1600.
We use a fixed effects specification to estimate the income elasticity of the VSL.Footnote 9 The base regression for the fixed effects model is of the natural log of the VSL on the natural log of the average income for the sample. The estimating equation is of the form:
 $$\begin{eqnarray}Ln(\mathit{VSL}_{js})=\unicode[STIX]{x1D6FD}_{0}+\unicode[STIX]{x1D6FD}_{1}\times Ln(\mathit{Income}_{js})+\unicode[STIX]{x1D6FD}_{s}+\unicode[STIX]{x1D700}_{js}.\end{eqnarray}$$
The coefficient $\unicode[STIX]{x1D6FD}_{1}$
provides the income elasticity of the VSL. The coefficient
$\unicode[STIX]{x1D6FD}_{1}$
provides the income elasticity of the VSL. The coefficient $\unicode[STIX]{x1D6FD}_{s}$
is the fixed effect for each article
$\unicode[STIX]{x1D6FD}_{s}$
is the fixed effect for each article $s$
. We exclude 72 negative VSL estimates from the sample to utilize this log-log specification.Footnote
10
We prefer the log-log specification because it is the most straightforward and conventional method of estimating the income elasticity of the VSL. However, excluding 72 negative estimates from the sample may introduce a positive bias into our estimate of the VSL income elasticity. This bias is akin to publication selection bias, which also causes negative estimates of the VSL to be removed from the distribution.Footnote
11
Publication selection bias itself will positively bias estimates of the income elasticity because negative and low VSL estimates associated with positive incomes are omitted from the regression.
$s$
. We exclude 72 negative VSL estimates from the sample to utilize this log-log specification.Footnote
10
We prefer the log-log specification because it is the most straightforward and conventional method of estimating the income elasticity of the VSL. However, excluding 72 negative estimates from the sample may introduce a positive bias into our estimate of the VSL income elasticity. This bias is akin to publication selection bias, which also causes negative estimates of the VSL to be removed from the distribution.Footnote
11
Publication selection bias itself will positively bias estimates of the income elasticity because negative and low VSL estimates associated with positive incomes are omitted from the regression.
To address the selection biases, we estimate an additional specification that includes the standard error for each observation $j$
.Footnote
12
The estimating equation takes the form:
$j$
.Footnote
12
The estimating equation takes the form:
 $$\begin{eqnarray}Ln(\mathit{VSL}_{js})=\unicode[STIX]{x1D6FD}_{0}+\unicode[STIX]{x1D6FD}_{1}\times Ln(\mathit{Income}_{js})+\unicode[STIX]{x1D6FD}_{2}\times \mathit{Standard}~\mathit{Error}_{j}+\unicode[STIX]{x1D6FD}_{s}+\unicode[STIX]{x1D700}_{js}.\end{eqnarray}$$
Including standard error in the estimating equation corrects for the natural publication selection bias in the VSL sample as well as the selection bias we impose by restricting the sample to positive values of the VSL. The statistical properties of this correction for publication selection effects and related biases are documented in Egger et al. (Reference Egger, Smith, Schneider and Minder1997), Stanley (Reference Stanley2005, Reference Stanley2008), and Stanley and Doucouliagos (Reference Stanley and Doucouliagos2012). The particular correction is the statistical analog of funnel asymmetry testing. Including the inverse standard error rather than the standard error in equation (2) is known as the precision effect test. We present the precision effect test as a robustness check of our estimates of equation (2) below. More precise estimates – those with lower standard errors – should be closer to the true value of the VSL. VSL estimates should be normally distributed around the true value of the VSL – if less precise estimates tend to be disproportionately higher or lower than the true value, it indicates that the sample is skewed and suffers from some form of selection bias. Controlling for standard error in the regression equation undoes this skew by accounting for the portion of high estimates attributable to selection. We also estimate a version of this equation (2) that includes a vector $X_{i}$
of variables controlling for the specification of the equation estimating the VSL.
$X_{i}$
of variables controlling for the specification of the equation estimating the VSL.
Table 1 provides summary statistics for the studies in our sample. The overall average VSL is $13.5 million. The U.S. average is slightly smaller at $13.0 million, while the international average is $15.6 million. The international sample’s larger average is attributable to greater publication selection bias in the international sample, as these studies often anchor on the U.S. estimates, which should be higher given international income differences (Viscusi & Masterman, Reference Viscusi and Masterman2017). The international sample’s large average standard error – nearly three times larger than the U.S. standard error – is illustrative. The average income in the U.S. sample is $45,073, much larger than the international average of $31,221.
Table 1 Summary Statistics.
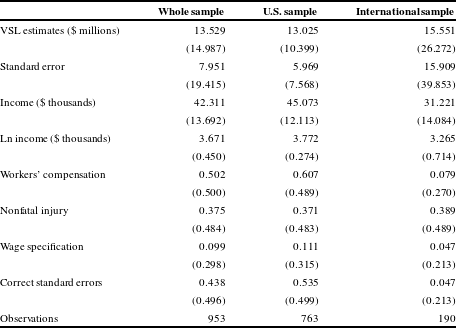
Note: Sample excludes 72 negative VSL values.
The remaining variables in Table 1 are indicator variables describing the variables and specification used to estimate the VSL and its standard error in the underlying study. The indicator variables for nonfatal injury and workers’ compensation are equal to one if the estimating equation included controls for nonfatal injury job risk and the applicable workers’ compensation scheme, and a value of zero otherwise. Omitted variables bias will affect VSL estimates lacking these controls. Sixty percent of estimates in the U.S. sample control for workers’ compensation. Only eight percent of international estimates control for workers’ compensation, in part because some of the countries in our sample lack workers’ compensation programs. Just under 40 percent of estimates in both samples controlled for nonfatal injury rates.
The wage specification indicator variable is equal to one if the estimating equation used a linear rather than semilogarithmic wage equation to estimate the VSL. The correct standard errors indicator variable equals one if the VSL estimate’s standard errors were correctly adjusted to account for the covariation of income and fatal risk.Footnote 13 These specification variables are correlated with the passage of time. Wage specifications were more common in the early literature, while correct standard errors are more common in more recent papers. The U.S. sample’s estimates are twice as likely to be based on a wage specification, and more than an order of magnitude more likely to report correct standard errors.
4 Estimating the income elasticity of the VSL
4.1 Fixed effects estimates
Table 2 provides our base fixed effects estimates of the VSL income elasticity. Panel A presents results from equation (1), while Panel B presents the results based on equation (2). As a robustness check, Panel C presents the precision effect estimator as an alternative to the standard error estimator for addressing publication selection bias. Heteroskedasticity-robust standard errors are in parentheses, and standard errors that are robust and clustered on article are in brackets. The first column corresponds to the elasticity for the whole sample, while the latter two columns estimate equation (1) separately for the U.S. and international samples. In Panel A, the income elasticity for the whole sample is 0.826. The elasticity for the U.S. sample is smaller at 0.717, while the international elasticity is higher at 1.083. Our U.S. and international elasticities are significantly different using robust standard errors ( $p=0.04$
), but the significance drops below the usual levels when using robust and clustered errors (
$p=0.04$
), but the significance drops below the usual levels when using robust and clustered errors ( $p=0.18$
). Likewise, the U.S. elasticity is significantly different from 1.0 using robust standard errors (
$p=0.18$
). Likewise, the U.S. elasticity is significantly different from 1.0 using robust standard errors ( $p=0.02$
), but not clustered standard errors (
$p=0.02$
), but not clustered standard errors ( $p=0.32$
). The international elasticity is never significantly different from 1.0.Footnote
14
$p=0.32$
). The international elasticity is never significantly different from 1.0.Footnote
14
Table 2 Base Regression Estimates of the Log VSL.

Note: Robust standard errors are in parentheses, robust and clustered standard errors are in brackets. All regressions control for article fixed effects. *** $p<0.01$
, **
$p<0.01$
, ** $p<0.05$
, *
$p<0.05$
, * $p<0.1$
.
$p<0.1$
.
The differences in the elasticity estimates for the U.S. and international samples are more pronounced in the Panel B estimates, which also control for publication selection effects. Consistent with Doucouliagos et al. (Reference Doucouliagos, Stanley and Viscusi2014), we find a positive selection bias affecting the income elasticity of the VSL. Controlling for the standard error to address publication selection biases decreases the estimated elasticity in the U.S. sample to 0.519. The point estimate for the international sample elasticity increases slightly to 1.103. The two estimates are significantly different using both robust ( $p<0.01$
) and clustered (
$p<0.01$
) and clustered ( $p=0.02$
) standard errors. The international elasticity is statistically indistinguishable from 1.0,Footnote
15
but the U.S. elasticity estimate is significantly different from 1.0.Footnote
16
As expected, the coefficient on the standard error is significant and positive, demonstrating that the sample exhibits positive sample selection bias, as published VSL estimates overstate the bias-corrected values. Panel C demonstrates that our results are not sensitive to the estimator we use to address publication selection bias. Using the precision effect estimator results in a slightly lower estimate of the international VSL income elasticity and a slightly higher estimate of the U.S. VSL income elasticity, but the results remain consistent with our conclusion that the international VSL income elasticity exceeds the VSL income elasticity in the United States.
$p=0.02$
) standard errors. The international elasticity is statistically indistinguishable from 1.0,Footnote
15
but the U.S. elasticity estimate is significantly different from 1.0.Footnote
16
As expected, the coefficient on the standard error is significant and positive, demonstrating that the sample exhibits positive sample selection bias, as published VSL estimates overstate the bias-corrected values. Panel C demonstrates that our results are not sensitive to the estimator we use to address publication selection bias. Using the precision effect estimator results in a slightly lower estimate of the international VSL income elasticity and a slightly higher estimate of the U.S. VSL income elasticity, but the results remain consistent with our conclusion that the international VSL income elasticity exceeds the VSL income elasticity in the United States.
Table 3 presents the estimates of equation (2) with additional variables controlling for the specification of the VSL estimating equation.Footnote 17 The results of primary interest are almost identical to the results from Panel B of Table 2. The income elasticities for the whole sample, U.S. sample, and international sample are 0.775, 0.511, and 1.102, respectively. As in Table 2, the U.S. and international samples have significantly different elasticity estimates, and the international estimate is statistically indistinguishable from 1.0 using either set of standard errors.Footnote 18 The U.S. elasticity is significantly different from 1.0.Footnote 19
Table 3 Log VSL Regression Estimates with Full Model.

Note: Robust standard errors are in parentheses, robust and clustered standard errors are in brackets. All regressions control for article fixed effects. *** $p<0.01$
, **
$p<0.01$
, ** $p<0.05$
, *
$p<0.05$
, * $p<0.1$
.
$p<0.1$
.
The coefficients on the secondary variables are consistent with our expectations and previous meta-analyses. The workers’ compensation variable varies in significance, but is negative when it is significant. This result is consistent with workers who are covered by higher compensation rates requiring lower compensating risk differentials. The coefficient on nonfatal injury is consistently negative and significant in the whole sample and U.S. sample equations, as expected from the omitted variables bias that an equation lacking nonfatal injury would exhibit. Estimating equations utilizing a wage specification find lower VSLs, while equations that calculate correct standard errors receive a premium. The signs of the coefficients are consistent with researchers using log wage equations and correct standard errors more as VSL estimates have increased over time.
4.2 Quantile regression estimates
The fixed effects estimates of the VSL demonstrated that the income elasticity of the VSL is larger in international studies of the VSL than in the United States. However, the fixed effect estimates cannot demonstrate whether the difference is a function of different income levels or different preferences over fatal risk and money tradeoffs. We utilize quantile regression estimates to investigate whether the income elasticity of the VSL declines over the entire VSL distribution. If so, it indicates that some of the difference between U.S. and international VSL elasticities is likely attributable to differences in income levels. Our quantile regression estimator is of the form:
 $$\begin{eqnarray}Ln(\mathit{VSL}_{j})^{(q)}=\unicode[STIX]{x1D6FD}_{0}^{(q)}+\unicode[STIX]{x1D6FD}_{1}^{(q)}\times Ln(\mathit{Income}_{j})+\unicode[STIX]{x1D700}_{j}^{(q)}.\end{eqnarray}$$
Using this equation, $\unicode[STIX]{x1D6FD}_{1}^{(q)}$
is the income elasticity of the VSL at the
$\unicode[STIX]{x1D6FD}_{1}^{(q)}$
is the income elasticity of the VSL at the $q$
quantile of the distribution. As with equation (1), we also estimate a version of equation (3) that includes the standard error of the VSL estimate to address publication selection bias.
$q$
quantile of the distribution. As with equation (1), we also estimate a version of equation (3) that includes the standard error of the VSL estimate to address publication selection bias.
Table 4 presents the results of estimating equation (3). For reference, Panel A presents the distribution of VSL estimates in our sample. The median VSL estimate is $10.3 million. The right tail of the distribution is about twice as long as the left tail – the 95th percentile estimate is at $36.5 million, while the 5th percentile is $0.7 million.
Table 4 Quantile Regression.

Note: $N=953$
. Robust standard errors in parentheses. ***
$N=953$
. Robust standard errors in parentheses. *** $p<0.01$
, **
$p<0.01$
, ** $p<0.05$
, *
$p<0.05$
, * $p<0.1$
.
$p<0.1$
.
Panel B presents our estimates of the income elasticity throughout the VSL distribution. The results indicate that the income elasticity of the VSL is largest for the smallest VSLs, and smallest for the largest estimates. In particular, the elasticity is 2.58 at the 5th percentile, and it falls to 0.35 by the 95th percentile. The elasticity almost decreases monotonically. The one exception is an increase at the 90th percentile to 0.64 from 0.44 at the 75th percentile. Each elasticity estimate from the lower half of the distribution is statistically significantly different from the estimate of the elasticity of the median.Footnote 20 Conversely, each elasticity estimate from the upper half of the distribution is statistically indistinguishable from the median elasticity.Footnote 21
Panel C extends the results from Panel B by adding standard error to the estimation.Footnote 22 The coefficient on standard error is positive and significant at each quantile and tends to get larger in the upper half of the distribution. The elasticity estimates in Panel C are similar to those in Panel B. In the lower half of the distribution, the inclusion of the standard error changed each estimated elasticity by less than 0.02. The changes are larger at the median and above. The 50th percentile, 75th percentile, and 95th percentile estimates decrease by between 0.07 and 0.10, and the 90th percentile estimate decreases by 0.30. The pattern of elasticity estimates has a more monotonically decreasing pattern in Panel C because of the large effect of including standard error on the upper half of the distribution. The income elasticity of the VSL drops sharply from the 5th percentile of the distribution to the median and then continues to drop at a much slower pace from the median to the 95th percentile.
Table 4 provides indirect support for the proposition that the income elasticity of the VSL decreases as income increases. Because the income elasticity of the VSL is positive, incomes increase over the distribution of the VSL. The pattern in elasticities in Table 4 is thus consistent with elasticities increasing as incomes decrease. However, Table 4 cannot rule out an elasticity that is constant with respect to income but varies with factors that may correlate with income. More detailed effects are difficult to identify with the available set of labor market VSL studies.Footnote 23 Particularly confounding for present purposes is that out of the thirteen non-U.S. countries in our data, only India and Pakistan are not upper income economies. As the VSL literature for lower income countries continues to grow, researchers and policymakers should refine our understanding of the relationship between the VSL income elasticity and income levels.
Table 5 Summary of VSL Income Elasticities for Different Samples and Specifications.
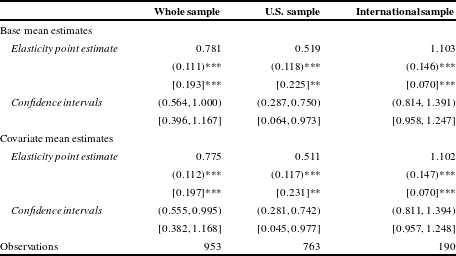
Note: Base mean elasticities are from Table 2, Panel B and covariate mean elasticities are from Table 3. Robust standard errors and corresponding 95% confidence intervals are in parentheses, and robust and clustered standard errors and corresponding 95% confidence intervals are in brackets. *** $p<0.01$
, **
$p<0.01$
, ** $p<0.05$
, *
$p<0.05$
, * $p<0.1$
.
$p<0.1$
.
5 International VSL transfer results
Section 3 demonstrated that the average income elasticity of the VSL in non-U.S. countries is at least as high as 1.0. Table 5 summarizes the findings from Section 3, presenting the income elasticities (and their corresponding confidence intervals) from estimating equation (1) in the specifications from Panel B of both Tables 2 and 3. The 95% confidence intervals for the income elasticity for the international sample extend from 0.81 to 1.39 using robust standard errors and from 0.96 to 1.25 using standard errors clustered on article. Using these income elasticities, we can transfer VSLs from the United States to other countries. If we assume that the income elasticity is constant and equal across the countries of interest, for a country $c$
, the transferred VSL is given by:
$c$
, the transferred VSL is given by:
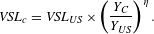 $$\begin{eqnarray}\mathit{VSL}_{c}=\mathit{VSL}_{\mathit{US}}\times \left(\frac{Y_{C}}{Y_{\mathit{US}}}\right)^{\unicode[STIX]{x1D702}}.\end{eqnarray}$$
Equation (4) is derived by Hammitt and Robinson (Reference Hammitt and Robinson2011). In equation (4), $Y$
denotes either country
$Y$
denotes either country $c$
or the United States’ average income, while
$c$
or the United States’ average income, while $\unicode[STIX]{x1D702}$
denotes the income elasticity of the VSL. The income measure we use to transfer VSLs is the GNI per capita from the World Bank.Footnote
24
In 2015, the U.S. GNI per capita was $55,980. As discussed in Section 2, we use the $9.6 million base CFOI estimate as the base U.S. VSL.
$\unicode[STIX]{x1D702}$
denotes the income elasticity of the VSL. The income measure we use to transfer VSLs is the GNI per capita from the World Bank.Footnote
24
In 2015, the U.S. GNI per capita was $55,980. As discussed in Section 2, we use the $9.6 million base CFOI estimate as the base U.S. VSL.
Table 6 presents the results of transferring VSLs for economies at various income levels. To divide countries into low income, lower-middle income, upper-middle income, and upper income, we use the World Bank’s income classification groups. The World Bank classifies an economy as low income if it has a GNI per capita of $1025 or less, lower-middle income if it has a GNI per capita between $1026 and $4035, upper-middle income if it has a GNI per capita between $4036 and $12,475, and upper income if it has a GNI per capita of $12,476 or higher. Table 6 presents our estimate of the VSL both using the mean GNI of countries in each income group and a country at the income threshold. Out of the 189 countries that the World Bank provides GNI per capita measures for in 2015, 28 are low income, 49 are lower-middle income, 52 are upper-middle income, and 60 are upper income.
Table 6 Projected VSL Levels by World Bank Income Group ($ millions).
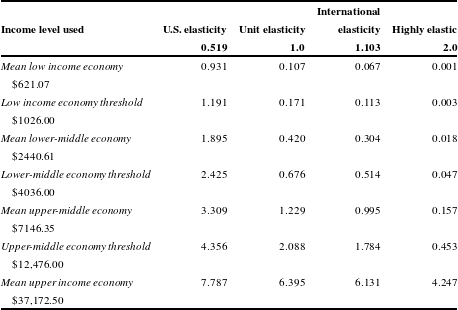
Note: U.S. and international elasticities are from Table 5. Base U.S. income is $55,980. Base U.S. VSL of $9.631 million is from Viscusi and Masterman (Reference Viscusi and Masterman2017) and Viscusi (Reference Viscusi2015).
We utilize four different elasticities: our estimated base U.S. elasticity of 0.52 from Table 5, an elasticity of 1.0, our estimated base international elasticity of 1.10 from Table 5, and an elasticity of 2.0 from our estimates of the income elasticity in the lowest parts of the VSL distribution in Table 4. Using an income elasticity of 1.0, the average VSL in a low income economy is $107,000. An economy at the lower income threshold has a VSL of $171,000. A lower-middle income economy has an average VSL of $420,000, while an economy at the lower-middle income threshold has a VSL of $676,000. The average upper-middle income economy has an average VSL of $1.23 million. An economy at the upper-middle income threshold has a VSL of $2.09 million. Finally, the average upper income country has a VSL much higher than the rest at $6.40 million.Footnote 25
Comparing the unit-elasticity VSLs to the other rows of Table 6 demonstrates the importance of correctly estimating the income elasticity. If we apply the average base U.S. elasticity from Table 5, our estimate of the VSL for other nations increases dramatically. The mean low income, lower-middle income, and upper-middle income VSLs increase to $931,000, $1.90 million, and $3.31 million, respectively. The upper income average also receives a relatively smaller bump to $7.79 million. Applying our estimated average base international elasticity from Table 5 similarly decreases the VSL for each country. The effect is again largest for the low income economies, which decreases to $67,000, with the others similarly following suit. Finally, utilizing an elasticity of 2.0 likewise greatly reduces the VSL for low and middle income countries. The mean low income, lower-middle income, and upper-middle income VSLs decrease to $1000, $18,000, and $157,000 when an elasticity of 2.0 is used.
In Table 7, we apply equation (4) to all 189 countries for which GNI per capita numbers are available from the World Bank. We use an elasticity of 1.0 because it is tractable and because we fail to reject the hypothesis that the international elasticity is equal to 1.0 in any of our specifications. The large range of GNIs per capita induce an equally large range of VSL estimates. The country with the largest VSL is Bermuda at $18.3 million, with a GNI per capita of $106,140. The smallest VSL is from Burundi equal to $45,000 using its GNI per capita of $260.
Table 7 International Income-Adjusted Estimates of the VSL.

Note: All VSLs are calculated using an income elasticity of 1.0. Base U.S. VSL of $9.631 is from Viscusi and Masterman (Reference Viscusi and Masterman2017).
On the whole, our transferred VSLs exceed the values that policymakers in foreign nations have utilized in the past.Footnote 26 The United Kingdom’s Department of Transport used a VSL of $2.3 million in 2015, while we find a U.K. VSL of $7.4 million. In 2014, Australia used a baseline VSL of $2.7 million. Transferring a VSL based on the U.S. numbers demonstrates that Australia’s VSL is $10.3 million. Colombia used a VSL of $1.1 million to evaluate water sanitation in 2008, very close to our transferred Colombian VSL of $1.2 million.
6 Conclusion
This article has analyzed the full set of labor market VSL studies to measure the income elasticity of the VSL. Our results demonstrate that the income elasticity ranges for the United States are not consistent with the income elasticities in non-U.S. countries. While estimates of the income elasticity for the whole sample and U.S. sample of VSL estimates fall within a range of 0.5–1.0, our point estimate of the international estimate is above the range at about 1.1. Using the conventional range of elasticities derived from U.S. studies can dramatically overstate the VSL once the U.S. VSL is transferred to other countries. Current data support using an elasticity of at least 1.0 for non-U.S. countries.
That international estimates of the income elasticity may be greater is borne out in our quantile regression analysis, which demonstrated that the VSL income elasticity falls as the VSL level increases. This finding echoes the quantile regression results in Kniesner et al. (Reference Kniesner, Viscusi and Ziliak2010) in which the VSL income elasticity declines for U.S. workers with higher income levels. Combined with our results showing that the U.S. income elasticity is significantly smaller than the international VSL elasticity, the quantile regression results show that the international income elasticity of the VSL likely falls as income rises. Further research on the relationship between income and the elasticity of income may refine this dependence of the income elasticity on the VSL, especially as more labor market studies in low and middle income economies emerge.
Our approach is able to derive a VSL for almost 200 countries using a base U.S. VSL of $9.6 million, a U.S. income of $55,980, and a VSL elasticity of 1.0 to calculate a VSL for each country. We also estimate that low income, lower-middle income, upper-middle income, and upper income countries should use average VSLs of $107,000, $420,000, $1.2 million, and $6.4 million, respectively, based on the World Bank income group criteria. The international differences in the VSL will have ramifications for efficient regulatory policies, which will tend to be more stringent in more affluent countries. Because many countries will continue to lack detailed data on employment and workplace fatalities, transferring VSLs from the full sample of VSL estimates remains the most reliable way to generate a revealed preference VSL estimate for low and middle income countries. This benefit transfer approach will remain desirable until researchers develop more credible country-specific VSL estimates.


 Open access