


1. Introduction
The beef cattle industry in Tennessee is consistently the highest-grossing sector of the state's agricultural industry (U.S. Department of Agriculture, National Agricultural Statistics Service [USDA-NASS], 2014). In 2012, the total sales of cattle and calves was $735.5 million, which accounted for approximately 20% of the state's agricultural income (USDA-NASS, 2014). The beef cattle industry in Tennessee, and most of the southeastern United States, predominantly consists of cow-calf operations that rely on pasture to meet the nutritional requirements of cattle. Most cow-calf operations in the southeastern United States follow a spring-calving season, which begins in January and ends in mid-March (Campbell et al., Reference Campbell, Backus, Dixon, Carlisle and Waller2013). Thus, cows are normally bred in late spring to early summer, and calves are weaned in late fall to early winter.
Cow nutrition is an integral part of reproduction and calf production, and thus, profitability. The nutritional requirements for cows are affected by climate, stage of calf production, and gestation. The greatest nutritional needs of spring-calving cows align closely with warm-season grass production (Bagley et al., Reference Bagley, Carpenter, Feazel, Hembry, Huffman and Koonce1987). Warm-season grasses typically grow from mid-May through August (Keyser et al., Reference Keyser, Harper, Bates, Waller and Doxon2011). In particular, warm-season grass production commonly peaks at the time when spring-calving cows require their greatest nutritional intake in order to sustain growing calves, maintain body condition, and rebreed (Bagley et al., Reference Bagley, Carpenter, Feazel, Hembry, Huffman and Koonce1987). Meanwhile, tall fescue, a cool-season grass, is the primary forage used by cattle producers in Tennessee and other parts of the southeastern United States (Keyser et al., Reference Keyser, Harper, Bates, Waller and Doxon2011). Cool-season grasses, such as tall fescue, grow predominantly from late February to May and from the end of September to November (Keyser et al., Reference Keyser, Harper, Bates, Waller and Doxon2011). Thus, cool-season grass pastures might not provide spring-calving cows with sufficient nutritional intake during the time of rebreeding. However, cool-season grasses might provide spring-calving cows with sufficient nutrition during the last trimester of gestation.
Recent studies in the midwestern and western United States have shown that increasing cows’ protein intake during their last trimester of gestation can improve the performance of the cows’ calves from birth to finishing. Ciminski (Reference Ciminski2002) found that steers originating from cows that were fed a supplemental protein ration during their last trimester of gestation in Nebraska had improved growth from birth to slaughter. Stalker et al. (Reference Stalker, Adams, Klopfenstein, Feuz and Funston2006) and Bohnert et al. (Reference Bohnert, Mills, Stalker, Nyman and Falck2010) determined how a supplemental feed program for cows prior to calving affected the cows’ offspring in Nebraska and Oregon, respectively. They found higher weaning weights and increased average daily gain for calves of supplemented cows. In Nebraska, Larson et al. (Reference Larson, Martin, Adams and Funston2009) determined how prepartum supplemental feed for cows affected the carcass quality attributes of the cows’ offspring. Steers from supplemented cows had greater marbling scores and were more likely to grade Choice or higher compared with steers that originated from cows that were not supplemented.
Prepartum supplemental feed studies have also analyzed the profitability of the cows’ offspring from birth through finishing. Stalker et al. (Reference Stalker, Adams, Klopfenstein, Feuz and Funston2006) found an increase in net returns for cattle originating from supplemented cows if producers were to maintain ownership of the cattle throughout all stages of production. Bohnert et al. (Reference Bohnert, Mills, Stalker, Nyman and Falck2010) found that the impact of the supplemental feeding program on net returns to retained ownership was dependent on the cow's body condition score (BCS) at the time of pregnancy. For example, retained ownership net returns for cattle originating from cows with a BCS of 6 were unaffected by the supplemental feeding program, whereas offspring from cows with a BCS score of 4 had decreased net returns if they were supplemented.
Although the above-mentioned literature is helpful for understanding how prepartum supplemental feed programs in the midwestern and western United States affect the performance and profitability of cattle through finishing, little is known about the impact of a prepartum supplemental feed program on cattle profitability and performance in the southeastern United States. Therefore, we examine the impact of a prepartum supplemental feed program in Tennessee on cattle profitability and carcass quality. Specifically, the objectives of this study are to (1) investigate the impact of animal characteristics and a supplemental prepartum feed program for cows on net returns to finished steers and (2) evaluate the impact of animal characteristics and a supplemental prepartum feeding program on the probability of a steer grading Choice or higher. Our results provide Tennessee and other southeastern cow-calf operators with insight into whether prepartum supplemental feed can improve the profitability and quality grade of finished cattle.
2. Data
Data were collected on 160 steers originating from the University of Tennessee (UT) Research and Education Centers (RECs). Of the 160 steers, 54 came from the Highland Rim REC in Springfield, Tennessee; 15 came from the Middle Tennessee REC in Spring Hill, Tennessee; and 91 came from the Plateau REC in Crossville, Tennessee. The steers were born between January and March 2013. Dams used in the analysis were primarily crossbred Angus cattle. Of the 160 steers evaluated, 105 were sired by Angus bulls, 24 were sired by Gelbvieh bulls, 9 were sired by Hereford bulls, 9 were sired by Simmental bulls, 8 were sired by Simmental-Angus bulls, 3 were sired by Maine-Anjou bulls, and 2 were sired by Chianina bulls.
The 160 steers originated from cows that were involved in a supplemental prepartum feeding program experiment. Approximately 90 days prior to the first expected calving date, the cows were evenly split into two herds at their respective REC and placed on mixed-grass pasture consisting primarily of tall fescue. The cows were randomized into treatment herds based on their age and previous calf-weaning weights. One herd did not receive a feeding supplement (i.e., the control herd), whereas the other herd received a prepartum supplement of dried distillers grains with solubles (DDGSs) from the Jack Daniels Distillery in Lynchburg, Tennessee (i.e., the treatment herd). DDGSs were selected because they are widely used as a feeding supplement in cow-calf operations in Tennessee given that they have a relatively high energy value. Each cow in the treatment herd was fed at a rate of 5 pounds of DDGSs, 3 days a week. DDGSs were fed starting 90 days prior to the first expected calving date (third trimester), at which time supplementation ended. The DDGSs cost $260/ton, for a per cow cost of $25.37.
The steers from the treatment and control herds were sent to the Tri-County Steer Carcass Futurity Cooperative (TCSCFC) feedlot in Lewis, Iowa, in December of 2013 to be finished on a retained ownership contract.Footnote 1 The cattle were fed in a single feedlot in Iowa with no differences in feeding practices between the control and treatment herds after being placed in the feedlot. The TCSCFC documented animal performance measures such as average daily gain, dry matter intake, feed-to-gain ratio, days on feed, and final weight. The Cornell net carbohydrate model was used to allocate feed dry matter within a group or lot of cattle. The total, as fed, pounds, percent dry matter, and total cost of each feed ingredient were the feed inputs. Cattle inputs were individual placement weight, final weight, days on feed, carcass weight, and calculated yield grade. The program allocated feed dry matter based on average metabolic size, days on feed, and composition of gain. Average daily gain was calculated as the final weight, less the Iowa delivery weight, divided by the total days on feed. Feed-to-gain ratio was calculated as the total pounds of feed dry matter divided by the total pounds of feedlot gain. The feedlot recorded the total feed cost, yardage, trucking, checkoff fee, and health treatments for each steer. Steers were slaughtered on April 15, May 6, May 20, or June 10, 2014. Slaughter data included dressing percentage, rib eye area, fat cover, yield grade, and quality grade. The actual prices of beef for the slaughter dates were recorded by the feedlot.
Table 1 displays the summary statistics of animal performance and carcass quality characteristics of the steers by weight class on delivery to the feedlot and by herd. We categorized the steers of each herd into three weight classes based on placement weight upon delivery to the Iowa feedlot, including (1) less than 700 pounds, (2) 700 to 799 pounds, and (3) 800 to 950 pounds. In both the treatment and control herds, the highest observed average for average daily gain and lowest observed average for feed-to-gain ratio were found for steers that entered the feedlot at less than 700 pounds. The average daily gain among all cattle weights was 4.04 pounds in both the control and treatment herds, and the feed-to-gain ratio among all cattle weights was 6.10 in the control herd and 6.11 in the treatment herd. Dressing percentage, finished live weight, and hot carcass weight were all fairly constant among all weight classes in the control and treatment herds. Among all weights, the percentage of steers that originated from Angus sires, the days of age of the steers, and the days on feed were consistent at approximately 65%, 465 days, and 150 days, respectively. Steers that entered the feedlot between 700 and 799 pounds were more likely to grade Choice or higher for both the control and treatment herds. Pairwise comparisons were made to determine if there were any differences between herds for all the summary statistics. Dressing percentage was found to be significantly higher for 800- to 950-pound steers in the treatment herd than 800- to 950-pound steers in the control herd at the 10% level.
Table 1. Summary Statistics for Steers Finished and Harvested in Iowa and Originating from Cows Participating in a Prepartum Supplemental Feeding Program in Tennessee by Placement Weight and Herd for 2013–2014

a The treatment herd represents steers originating from cows participating in a prepartum supplemental feeding program.
b Quality grades were divided into subunits following Hale, Goodson, and Savel (2013), and results are shown for percentage of steers that graded Select (+) or lower, percentage of steers that graded Choice (−), and percentage of steers that graded Choice or higher.
Notes: Standard deviations are in parentheses. The number of head shipped to Iowa in each respective weight class is denoted by n. Asterisk denotes pairwise differences between herds at the 10% level.
The average total feedlot cost for each steer by placement weight and herd appears in Table 2. The supplemental feed treatment cost associated with the prepartum experiment was not included in the total feedlot cost because this cost occurred prior to the feedlot. Pairwise comparisons were made to determine if there were any differences between herds for all summary statistics. The feed costs and total feedlot costs were lower for the steers weighing less than 700 pounds in the control herd than steers weighing less than 700 pounds in the treatment herd.
Table 2. Summary Statistics of Feedlot Feed Costs ($/head) by Placement Weight and Herd for 2013–2014
a The treatment herd represents steers originating from cows participating in a prepartum supplemental feeding program.
b Trucking costs include the combined trucking expense of shipping the cattle to Iowa from Tennessee and shipping the cattle from the feedlot in Iowa to be slaughtered.
c Miscellaneous costs include data collection fee, interest, health inspection fees, and scale charges.
Notes: Standard deviations are in parentheses. The number of head shipped to Iowa in each respective weight class is denoted by n. Feedlot feed costs do not include the cost of the prepartum feeding program. Asterisks (**) denote pairwise differences between herds at the 5% level.
The finished steers were sold on a grid-pricing marketing system with premiums based on the yield and quality grade of the animal. A premium of $4.31 per hundredweight was received for steers that qualified as Certified Angus Beef. The actual grid prices received are summarized by yield and quality grade in Table 3.
Table 3. Grid Prices Received at the Four Harvest Dates ($/cwt.)
Note: “n” represents the number of head slaughtered on the given date.
3. Economic Framework
In general, cattle producers in Tennessee typically sell their calves at weaning, and the calves are finished in feedlots outside of the state. However, another marketing option available to cow-calf producers is to retain ownership of their cattle through the feedlot and market them as fed cattle. One possible explanation as to why Tennessee producers do not retain ownership of cattle through finishing is that retaining ownership can increase producers’ production and price risk (Pope et al., Reference Pope, Schroeder, Langemeier and Herbel2011; Schroeder and Featherstone, Reference Schroeder and Featherstone1990; White et al., Reference White, Anderson, McKinley and Parish2007). However, prepartum supplemental feed programs might be a way to increase net returns to retaining ownership through finishing by potentially reducing the associated production risk (Stalker et al., Reference Stalker, Adams, Klopfenstein, Feuz and Funston2006). Therefore, we establish an objective function for a profit-maximizing producer, who can select the use of a prepartum supplemental feeding program, select to retain ownership through finishing, and select the breed of the sire. The objective function can be expressed as follows:
 $$\begin{eqnarray}
\mathop{{\rm max} }\limits_{{S_i},Bo{S_i},{{Re}} tai{n_i}} N{R_i} &=& [{p_i}({y_i},Bo{S_i}){y_i}(Bo{S_i}) - P{C_i}(Bo{S_i}) - O{C_i} - S{C_i} \times {S_i}]\nonumber\\
&& \times {{Re}} tai{n_i} + O{C_i} \times [1 - {{Re}} tai{n_i}],
\end{eqnarray}$$
$$\begin{eqnarray}
\mathop{{\rm max} }\limits_{{S_i},Bo{S_i},{{Re}} tai{n_i}} N{R_i} &=& [{p_i}({y_i},Bo{S_i}){y_i}(Bo{S_i}) - P{C_i}(Bo{S_i}) - O{C_i} - S{C_i} \times {S_i}]\nonumber\\
&& \times {{Re}} tai{n_i} + O{C_i} \times [1 - {{Re}} tai{n_i}],
\end{eqnarray}$$where NRi is the net returns to finishing steer i ($/head); Si is an indicator variable that is equal to 1 if the cow was given a supplement in the last trimester of gestation and 0 otherwise; BoSi is the breed of the steer's sire, which can influence carcass quality characteristics and yield grade; Retaini is an indicator variable that is equal to 1 if the producer retains ownership of the cattle in the feedlot and 0 otherwise; pi is the grid price received at finishing ($/pound) and is a function of hot carcass weight yi of the steer (pounds/head); PCi is the production cost for finishing the steer ($/head) (see Table 2); SCi is the cost of the supplemental feed program to dams of the steers ($/head); and OCi is the revenue ($/head) that would have resulted from selling the steer instead of retaining ownership in the feedlot (opportunity cost of retained ownership). Specifically, the opportunity cost, OCi, is equal to the Iowa delivery weight of the steer multiplied by the market value ($/hundredweight) of the steer when it was delivered to Iowa. The market values of the feeder steers were determined by first evaluating the muscling and frame size of the feeder steers upon arrival and weighing the animals. This information was then compared to the USDA Agricultural Marketing Service weekly auction report for Tennessee, and the average price for the associated feeder steer class was used for the steer's market price.
Three feedlot feed cost scenarios were created to conduct sensitivity analysis of net returns to finished steers. We increased and decreased the observed feed cost by 50% and present the results under these feed cost scenarios along with the results for the observed feed cost. It should be noted that a producer cannot be sure whether his/her net returns to these decisions will be positive or negative ex ante. Thus, the producer can only know ex post whether the breed of sire, decision to retain ownership, and decision to provide a prepartum supplemental feed was the correct one.
3.1. Net Returns Model
We calculate net returns for each steer using equation (1) and specify the following empirical model to determine factors that affect their net returns. We estimate a mixed model with a random effect for the location where the steer originated, which is expressed as
 $$\begin{eqnarray}
N{R_{il}} &=& {\beta _0} + {\beta _1}{S_{il}} + {\beta _2}{W_{il}} + {\beta _3}F{G_{il}} + {\beta _4}AD{G_{il}} + {\beta _5}{D_{il}} + {\beta _6}Bo{S_{il}}\nonumber\\
& & + {\beta _7}Do{F_{il}} + {\beta _8}Do{A_{il}} + {u_l} + {\varepsilon _{il}},
\end{eqnarray}$$
$$\begin{eqnarray}
N{R_{il}} &=& {\beta _0} + {\beta _1}{S_{il}} + {\beta _2}{W_{il}} + {\beta _3}F{G_{il}} + {\beta _4}AD{G_{il}} + {\beta _5}{D_{il}} + {\beta _6}Bo{S_{il}}\nonumber\\
& & + {\beta _7}Do{F_{il}} + {\beta _8}Do{A_{il}} + {u_l} + {\varepsilon _{il}},
\end{eqnarray}$$where NRil is the net returns ($/head) to finished steer i that came from REC l (l = 1,. . .,3); Sil is an indicator variable equal to 1 if the steer's dam was provided supplemental prepartum feeding and 0 otherwise; Wil is the placement weight of steer i into the feedlot (pounds); FGil is the feed-to-gain ratio; ADGil is the average daily gain; Dil is the dressing percentage; BoSil is an indicator variable that is equal to 1 if the steer's sire was Angus and 0 otherwise; DoFil is the number of days the animal was on feed at the feedlot; DoAil is the days of age of the animal; ul ~ N(0, σ2u) is a location random effect for the REC from which the steer originated; β 0,. . ., β 8 are parameters; and εil ~ N(0, σ2ε) is the random error term. Independence is assumed across the two stochastic components. Equation (2) was estimated using StataCorp (2013).
We anticipate net returns will increase as placement weight decreases, which has been observed in the literature (Forristall, May, and Lawrence, Reference Forristall, May and Lawrence2002; Langemeier, Schroeder, and Mintert, Reference Langemeier, Schroeder and Mintert1992; Lawrence, Wang, and Loy, Reference Lawrence, Wang and Loy1999; Mark, Schroeder, and Jones, Reference Mark, Schroeder and Jones2000). Feed-to-gain ratio indicates how efficient a steer is at converting feed to weight gain; therefore, we hypothesize that an increased feed-to-gain ratio will decrease net returns to finishing, which is similar to previous research (Langemeier, Schroeder, and Mintert, Reference Langemeier, Schroeder and Mintert1992; Lawrence, Wang, and Loy, Reference Lawrence, Wang and Loy1999; Greiner, Reference Greiner2003). We posit that a higher average daily gain will increase net returns because the steer may need fewer days on grain to reach maturity (Langemeier, Schroeder, and Mintert, Reference Langemeier, Schroeder and Mintert1992; Lawrence, Wang, and Loy, Reference Lawrence, Wang and Loy1999; Greiner, Reference Greiner2003). It is hypothesized that the supplemental prepartum feeding program will positively affect net returns given that the steer's dam received supplemental feed in the treatment herd. However, previous research on the impact of a supplemental prepartum feeding program has found mixed results (Bohnert et al., Reference Bohnert, Mills, Stalker, Nyman and Falck2010; Stalker et al., Reference Stalker, Adams, Klopfenstein, Feuz and Funston2006). It is expected that an increased dressing percentage will increase net returns given that an increased dressing percentage results in an increased amount of beef to be sold (Feuz, Fausti, and Wagner, Reference Feuz, Fausti and Wagner1993). We are uncertain if days on feed will increase net returns. For example, days on feed may increase the quality grade of the steer, which will increase net returns; however, days on feed will also increase the costs associated with the animal. It is anticipated that steers with an Angus sire will have higher net returns attributable to the expectation of higher quality grade carcasses and grid-pricing premiums. We expect the days of age of the animal to potentially increase net returns given that it may indicate that the steer has more marbling and carcass fat. We anticipate that the location random effect will be significant given that there could be differences in conditions at each UT REC.
3.2. Standardized Regression Coefficients
Standardized regression coefficients were computed similar to previous research on the determinants of cattle profitability (e.g., Forristall, May, and Lawrence, Reference Forristall, May and Lawrence2002; Mark, Schroeder, and Jones, Reference Mark, Schroeder and Jones2000; McDonald and Schroeder, Reference McDonald and Schroeder2000). Standardized regression coefficients are measured in standard deviations, instead of the units, and are beneficial for comparing the relative strength of independent variables on the dependent variable (Kohler and Kreuter, Reference Kohler and Kreuter2005). Given that our independent variables were not measured in the same units (e.g., days, pounds), computing standardized regression coefficients was beneficial to our analysis. Standardized regression coefficients identify the number of standard deviations the dependent variable is expected to change in response to a standard deviation change in each independent variable (Forristall, May, and Lawrence, Reference Forristall, May and Lawrence2002; Mark, Schroeder, and Jones, Reference Mark, Schroeder and Jones2000; McDonald and Schroeder, Reference McDonald and Schroeder2000; Pindyck and Rubinfeld, Reference Pindyck and Rubinfeld1998). For example, if the standardized regression coefficient for average daily gain was 0.5, then an increase of 1 standard deviation in average daily gain would be associated with an increase of 0.5 standard deviation in net returns.
To standardize the dependent and independent variables, we first found the mean and standard deviation of each variable. Next, a new standardized version of each variable was created by subtracting the mean from the original value of the variable and dividing that by the standard deviation. Finally, we estimated equation (2) by using the standardized variables for all nondummy variables to obtain the standardized regression coefficients. Dummy variables cannot be computed into standardized regression coefficients given that one cannot say what a change of 1 standard deviation means (Kohler and Kreuter, Reference Kohler and Kreuter2005).
3.3. Quality Grade Model
We also estimated a logit model to determine if animal characteristics and the prepartum feeding program for cows affected the probability of an animal grading Choice or higher. The same independent variables in equation (2) were used in the logit model:
 $$\begin{equation}
{\rm{P}}(C = 1) = \frac{{{e^{{{\bf \delta }}_i^{\prime}{{\bf \alpha }}}}}}{{1 + {e^{{{\bf \delta }}_i^{\prime}{{\bf \alpha }}}}}},
\end{equation}$$
$$\begin{equation}
{\rm{P}}(C = 1) = \frac{{{e^{{{\bf \delta }}_i^{\prime}{{\bf \alpha }}}}}}{{1 + {e^{{{\bf \delta }}_i^{\prime}{{\bf \alpha }}}}}},
\end{equation}$$where C equals 1 if the animal graded Choice or higher and 0 otherwise; δiis a vector of the explanatory variables defined in equation (2); and α is a vector of parameters. A positive (negative) parameter estimate for an explanatory variable indicates that an increase (decrease) in a continuous variable, or the presence of an indicator variable, increases (decreases) the probability of an animal grading Choice or higher.Footnote 2 The logit model and associated marginal effects were estimated using Stata software (StataCorp, 2013). Marginal effects indicate how a unit increase in the independent variable increases the probability of an animal grading Choice or higher (Boggess, Reference Boggess2007).
We hypothesize a heavier placement weight to lower the probability of an animal grading Choice or higher because heavier animals spend fewer days in the feedlot on grain. We are uncertain how the feed-to-gain ratio and average daily gain of a steer will affect a steer's probability of grading Choice or higher because feed costs are not considered in the quality grade model. We are unsure how dressing percentage will affect the steer's probability of grading Choice or higher given that dressing percentage variability among animals is dependent on several factors (Schweihofer, Reference Schweihofer2011). It is expected that the steers from the treatment herd will have an increased chance of grading Choice or higher given that the steer's dam received supplemental feed. We expect a steer will be more likely to grade Choice or higher if it had an Angus sire. It is hypothesized that an increase in the number of days on feed will result in the steer being more likely to grade Choice or higher given that the animal was on grain for more days. We also expect days of age to increase the steer's probability of grading Choice or higher given that the animal may have more marbling and carcass fat.
4. Empirical Results
4.1. Net Returns
Table 4 presents feedlot feed costs and average net returns for each of the three feed cost scenarios by placement weight and by herd (i.e., control or treatment). Pairwise comparisons were made between the control and treatment herds for all mean weights. Under the observed feed cost scenario, the value of average net returns through finishing was $28.11/head greater for the control herd ($258.75/ head) than the treatment herd ($230.64/head) (P < 0.10). Steers entering the feedlot between 700 and 799 pounds had the highest average net returns in the control herd, whereas steers placed weighing 800 to 950 pounds had the highest average net returns in the treatment herd. When feed costs were 50% higher than the observed feed cost, the average net returns among all placement weights were reduced by 81% to $49.96/head in the control herd and 93% to $15.36/head in the treatment herd. If feed costs were 50% lower, net returns among all placement weights increased 81% to $467.65/head and 93% to $446.05/head for the control and treatment herds, respectively.
Table 4. Summary Statistics of Feedlot Feed Costs and Net Returns ($/head) of Finished Steers by Placement Weight and Herd for 2013–2014
a The treatment herd represents steers originating from cows participating in a prepartum supplemental feeding program.
b Feed costs increased 50% relative to the observed/actual feed costs.
c Feed costs decreased 50% relative to the observed/actual feed costs.
Notes: Standard deviations are in parentheses. Feedlot feed costs do not include the cost of the prepartum feeding program. The number of head in each placement weight is denoted by n. Asterisks (*,**) denotes pairwise difference between herds at the 10% and 5% levels, respectively.
4.2. Mixed Model Results
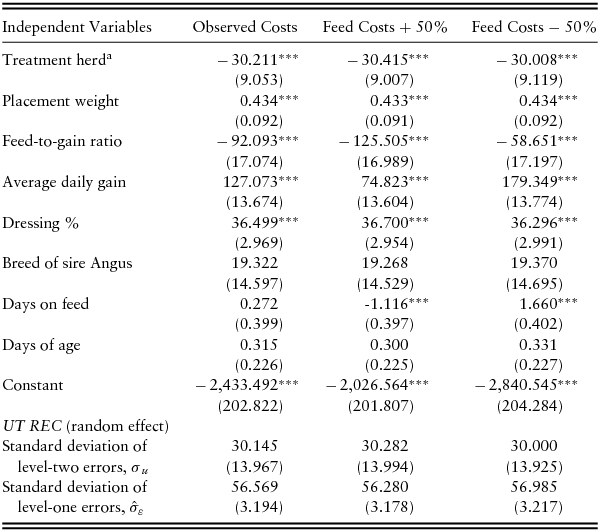
The results from estimating the mixed model are presented in Table 5 for the three feed cost scenarios. The random effect for the location from which the cattle originated was significant for all three feed cost scenarios (P < 0.01). Placement weight, average daily gain, and dressing percentage were significant and positive across all models.Footnote 3 For each pound increase in placement weight, the expected net returns through finishing increased by $0.43/head, which was consistent across all feed cost scenarios. An increase in average daily gain of the steers and a higher dressing percentage increased net returns across all feed cost scenarios. As expected, the effects of dressing percentage on net returns varied little across feed cost scenarios. For all feed cost scenarios, feed-to-gain ratio decreased net returns of finished steers as the ratio increased. There was no difference in net returns for Angus-sired steers compared with steers sired by another breed. Days of age of the steer also did not affect net returns. Days on feed did not have an impact on net returns in the observed feed cost scenario. However, as expected, when feed costs were increased by 50%, as days on feed increased, net returns were lower. As expected, if feed costs were 50% lower, as days on feed increased, net returns were increased.
Table 5. Parameter Estimates of Net Returns for Finished Steers Originating from Tennessee and Shipped to the Iowa Feedlot (n = 160)
a The treatment herd represents steers originating from cows participating in a prepartum supplemental feeding program.
Notes: Numbers in parentheses are standard errors; the postestimation variance inflation factors for all variables were less than 2. Asterisks (***, **) denote significance at the 1% and 5% levels, respectively. The likelihood-ratio test indicated that the location random effect was significant in all three models at the 1% level. REC, Research and Education Center; UT, University of Tennessee.
Unexpectedly, providing the steers’ dams with supplemental feed during the final trimester of pregnancy resulted in lower net returns for all three feed cost scenarios by approximately $30.00/head compared with steers from dams that did not receive supplemental feed. This result indicates that the supplemental prepartum feed program, which cost $25.37/head, did not increase Tennessee producers’ net returns of finished steers, but rather decreased net returns by about the cost of the extra feed. Similar to our results, Bohnert et al. (Reference Bohnert, Mills, Stalker, Nyman and Falck2010) observed that a supplemental feed program in Oregon decreased retained ownership net returns if the cattle originated from cows with a BCS of 4. Meanwhile, our results are counter to those of Stalker et al. (Reference Stalker, Adams, Klopfenstein, Feuz and Funston2006) who found that providing cows with supplemental feed in the last trimester of gestation in Nebraska increased net returns to finishing steers.
It should be noted, however, that our experimental design and methods to test the impact of a supplemental feeding program for cows were different from the procedures and methods used by Stalker et al. (Reference Stalker, Adams, Klopfenstein, Feuz and Funston2006) and Bohnert et al. (Reference Bohnert, Mills, Stalker, Nyman and Falck2010). We calculated net returns through finishing to include the opportunity cost to producers of selling their cattle instead of retaining ownership of their cattle, which is in contrast to the partial budget retained ownership net returns method used by Stalker et al. (Reference Stalker, Adams, Klopfenstein, Feuz and Funston2006) and Bohnert et al. (Reference Bohnert, Mills, Stalker, Nyman and Falck2010). Additionally, although Bohnert et al.’s (Reference Bohnert, Mills, Stalker, Nyman and Falck2010) experiment takes place over 2 years and Stalker et al.’s (Reference Stalker, Adams, Klopfenstein, Feuz and Funston2006) study takes place over 3 years, our study only takes place over 1 year (2013–2014), which is a limitation of this analysis. In general, forage conditions across Tennessee were slightly above average during the year this study took place. Therefore, our results are also conditional on above-average forage conditions.
Table 6 presents the standardized regression coefficients, which explain the relative impact of each independent variable on net returns to finishing steers. In the observed feed cost scenario, dressing percentage and average daily gain had the largest impact on net returns. The relative importance of the independent variables was affected by changes in feed costs. For example, when feed costs were increased by 50%, the feed-to-gain ratio became the second most important variable in explaining net returns, which is expected given that feed costs are higher in this scenario. Meanwhile, when feed costs were 50% lower than observed at the feedlot, average daily gain was the most important variable in explaining net returns, and the feed-to-gain ratio had a much smaller impact. As expected, days of age did not vary much with changes in feed costs. Also as expected, the standardized coefficient for days on feed changed as feed costs were varied, having a negative impact when feed costs were increased and a larger positive impact when feed costs were reduced.
Table 6. Standardized Regression Coefficients for the Determinants of Net Returns of Finished Steers

Note: Given that dummy variables are nonsensical to estimate as standardized regression coefficients, they were not standardized (i.e., one cannot say what a change of 1 standard deviation means when considering a dummy variable).
4.3. Logit Model Results
Table 7 presents the parameter estimates and marginal effects for the logit model in equation (3). The supplemental prepartum feed program for cows did not have an impact on the probability of a steer grading Choice or higher. Thus, the supplemental feed program decreased net returns (by about the cost of the supplemental feed) and also had no impact on the quality grade of the cattle retained in this study. An increase in the feed-to-gain ratio, average daily gain, and dressing percentage resulted in increases in the probability of the finished steer grading Choice or higher. Specifically, a one-unit increase in average daily gain increased the steer's probability of grading Choice or higher by 19.4% (P < 0.10), and a 1% increase in dressing percentage increased the steer's probability of grading Choice or higher by 4.1% (P < 0.10). A one-unit increase in feed-to-gain ratio increased the steer's probability of grading Choice or higher by 38.2% (P < 0.01). As a steer's placement weight into the feedlot increased, its probability of grading Choice or higher decreased (P < 0.05). Specifically, a 100-pound increase in placement weight decreased the probability of a steer grading Choice or higher by 10%. This result could indicate that the probability of a steer grading Choice or higher was associated with amount of time the steer spent finishing on grain; however, days of feed was not significant in the model.
Table 7. Logit Parameter Estimates for the Probability of a Steer Grading Choice or Higher (n = 160)
a Marginal effects were evaluated as the means of the continuous independent variables. For the dummy variables, the marginal effect is a change from 0 to 1.
Notes: The dependent variable is a binary variable equal to 1 if the animal graded Choice or higher and 0 otherwise. Numbers in parentheses are standard errors. Asterisks (***, **, *) denote significance at the 1%, 5%, and 10% levels, respectively. The likelihood ratio test indicated that the location random effect was not significant in the logit model.
5. Conclusions, Implications, and Future Research
Implementing a supplemental prepartum feeding program has become a topic of interest for increasing the profitability and reducing the risk of retaining ownership through finishing (Bohnert et al., Reference Bohnert, Mills, Stalker, Nyman and Falck2010; Stalker et al., Reference Stalker, Adams, Klopfenstein, Feuz and Funston2006). However, this issue has only been addressed for cattle from the western and midwestern United States. The cattle industry in Tennessee, which is similar to other states in the southeastern United States, primarily consists of cow-calf producers. Thus, producers might benefit from implementing a similar program and retaining ownership of calves through finishing. Ultimately, research is needed to determine if a supplemental prepartum feeding program for cows is profitable for cattle producers in the southeastern United States. Therefore, the objectives of this study were to investigate the impact of animal characteristics and a supplemental prepartum feed program for cows on net returns to finished steers and to evaluate the impact of animal characteristics and a prepartum feeding program on the probability of a steer grading Choice or higher.
We found that the prepartum feed program reduced net returns for producers by about the cost of the supplemental feed and did not have an impact on the steers’ probability of grading Choice or higher. These results could be explained by the slightly above-average forage conditions during our study, which may have reduced the cows’ potential deficit in nutritional requirements. Thus, our results may be subject to change depending on weather and forage conditions in Tennessee in a given year.
Although our research is focused on the profitability of using a prepartum feed program for cows, the results can also provide insight to producers interested in retaining ownership through finishing. Several factors such as feed-to-gain ratio, average daily gain, placement weight, and dressing percentage were found to affect net returns to finished steers. Though retained ownership of cattle through the feedlot is a marketing alternative for cow-calf producers, it may not be a feasible alternative for all producers. Potential barriers that many cow-calf producers face when considering retained ownership include, among others, inability to maintain cash flow because of the longer period of ownership (Lambert, Reference Lambert1989); incapacity to make a complete truckload of cattle, which increases transportation costs to the feedlot; and lack of a relationship with a feedlot operator. By knowing what production factors positively affect net returns in the feedlot, cow-calf producers selling calves at weaning can alter management practices to improve the likelihood of their calves returning more profits to the next owner. Our results provide insight to these producers on growth characteristics in the feedlot and how their calves may grade when finished, thus giving them extra information when they sell their calves at weaning.
This research is not without limitations. We only examined 1 year of data; therefore, our results are conditional on the weather conditions and feeder and fed prices during only 2013–2014. Future research could extend our study by evaluating multiple years of a prepartum supplemental feed program in the southeastern United States. Additionally, future research using multiple years of data could also examine the trend of retained ownership profitability over time, which would be beneficial for cow-calf producers throughout the country.


 Open access