


Management Implications
Herbicides are an important and cost-effective tool for management of invasive, exotic conifers despite some concerns about their impacts on human health and the environment. Control of individual and scattered invasive conifers in New Zealand is achieved largely through ground-based or aerial applications (via directed spray from an operator in a helicopter) to the bark of trees using triclopyr blended with a methylated seed oil (MSO) carrier. However, the tree size and dose–response relationships for these methods of control are not well defined, with practitioners dependent on broad label recommendations or best practice guidelines to implement control. One opportunity to reduce costs of control and minimize environmental impacts is by applying the lowest dose needed to achieve mortality. Two field experiments were conducted in the Central North Island region of New Zealand to determine the amount of triclopyr required to kill individual, invasive Pinus contorta (lodgepole pine) trees of different sizes. Triclopyr (12% active ingredient) was applied in an MSO to bark either over the whole stem or just to the base of the tree (as per label recommendations). The experiments showed that applying the triclopyr in oil to the whole stem, rather than just the base of the tree, improved the efficacy of the treatment from an average of 54 ± 4% to 90 ± 4%. Variates that related to crown size and tree diameter were the best predictors of tree response to herbicide dose when triclopyr was applied to the whole stem. From a practical perspective, crown diameter (CD) would be the easiest of the size variables to assess in-field. Using tree CD as an indicator of tree size, the dose–response model indicated that 6.7 g (95% confidence interval: 5.2 to 8.1) active ingredient triclopyr (in 12% MSO) would need to be applied to the bark per meter of CD to ensure a 95% probability of mortality.
Introduction
Herbicides are an important management tool for control of invasive alien plants in many regions (Douglass et al. Reference Douglass, Nissen, Meiman and Kniss2016; Enloe et al. Reference Enloe, O’Sullivan, Loewenstein, Brantley and Lauer2016) despite increasing social pressure to reduce their use. Herbicides continue to be used because they provide a cost-effective approach for removing invasive, alien plants over large areas, particularly in terrain where manual or mechanical removal is not practical. Regardless, increasing social pressure globally calls for a reduction in herbicide use (Beckie et al. Reference Beckie, GFlower and Ashworth2020). One opportunity for minimizing herbicide use is applying the lowest dose needed to achieve mortality. However, to implement such an approach requires evidence and assurance for users that lower doses are effective and will not result in the need for repeat applications. Often dose–response relationships that quantify efficacy for different herbicides are not well defined for specific invasive plants or different plant size classes, and practitioners rely on broad label recommendations and general best practice guidelines to implement control (Enloe and Kniss Reference Enloe and Kniss2009). This approach provides reliable plant control recommendations, but it does not optimize the system and can lead to higher than necessary costs and pesticide use rates with increased potential for unintended or unnecessary off-target impacts.
Exotic conifers were introduced into New Zealand early in the 19th century for a range of reasons, including for forestry (wood production), shelterbelts, erosion control, and aesthetics (Peltzer Reference Peltzer2018). As in a number of other Southern Hemisphere countries, there has subsequently been uncontrolled spread of “wilding” conifers from some of these planted areas (Castro-Díez et al. Reference Castro-Díez, Vaz, Silva, van Loo, Alonso, Aponte, Bayón, Bellingham, Chiuffo, DiManno, Julian, Kandert, Porta, Marchante and Maule2019; Dickie et al. Reference Dickie, Yeates, St John, Stevenson, Scott, Rillig, Peltzer, Orwin, Kirschbaum, Hunt, Burrows, Barbour and Aislabie2011; Peltzer Reference Peltzer2018) creating a significant environmental problem covering more than 2 million hectares of New Zealand’s land area (Froude Reference Froude2011; Ledgard Reference Ledgard2001; Simberloff et al. Reference Simberloff, Martin, Genovesi, Maris, Wardle, Aronson, Courchamp, Galil, García-Berthou, Pascal, Pyšek, Sousa, Tabacchi and Vilà2013). The most invasive and widespread wildings comprise about a dozen species but include predominantly lodgepole pine (Pinus contorta Douglas ex Loudon), Austrian pine (Pinus nigra Arnold), Scots pine (Pinus sylvestris L.), and Douglas-fir [Pseudotsuga menziesii (Mirb.) Franco], with the latter the only species still planted for commercial forestry purposes. The detrimental ecological impacts of exotic, invasive conifers on fragile natural and semi-natural ecosystems, as well as productive high-country farmland, are well recognized in New Zealand (Ledgard Reference Ledgard2001; Peltzer Reference Peltzer2018; Simberloff et al. Reference Simberloff, Nuñez, Ledgard, Pauchard, Richardson, Sarasola, Van Wilgen, Zalba, Zenni, Bustamante, Peña and Ziller2010). In fact, the scale of the problem is such that a national program (New Zealand Wilding Conifer Management Programme) has been implemented to control these invasive conifers and prevent their spread (Ministry for Primary Industries 2015). Control of individual and scattered conifers is a high priority in the program and is carried out using a range of ground-based manual and chemical control methods as well as aerial application in remote and difficult terrain (Russell Reference Russell2019). Ground-based control methods for individual conifers include herbicide injection; basal bark application of herbicides; and/or physical removal of trees by hand, chainsaw, or machinery extraction (e.g., excavators). Aerial herbicide application methods for individual conifers include spot application of herbicide from an operator inside a hovering helicopter. This method, known locally as “aerial basal bark application” (ABBA), consists of a directed spray delivered to the tree with a handheld extended lance typically 1.5 to 4 m in length (Russell Reference Russell2019).
Triclopyr butoxy ethyl ester (triclopyr) is the key active ingredient used in herbicide-based ground and aerial operations to control individual and scattered conifers. Triclopyr, a synthetic auxin, is a phloem-mobile herbicide that is commonly used to control woody, broadleaf species (McBean Reference McBean2012). For control of individual and scattered wilding conifers in New Zealand, triclopyr is applied as triclopyr butoxy ethyl ester blended with a mineral or vegetable oil carrier (80%:20% volume oil carrier to product). For ground-based control, label recommendations are to apply the product to the basal parts of the trunk in a manner that thoroughly wets a length of stem that is 3 to 5 times the diameter of the stem (Anonymous 2017). Aerial control, or aerial-basal bark application, involves applying the herbicide as a solid stream onto the bark of the upper branches and tree trunk in sufficient quantity that it moves down the trunk to the base of the tree, with the ideal position of the lance being within 1 m of the top of the tree (Russell Reference Russell2019). While the aim is to apply the liquid stream to the central trunk, when applications are made to dense crowns, it is inevitable that a proportion of spray is deposited on crown foliage through splashing and movement of the spray stream caused by the rotor downwash from the hovering helicopter (Gous et al. Reference Gous, Raal, Kimberley and Watt2015). Previous work testing this approach for its effectiveness in control operations (Gous et al. Reference Gous, Raal and Watt2014, Reference Gous, Raal, Kimberley and Watt2015) showed that the method was generally effective on single-stem trees less than 10-m tall. However, previous studies did not quantify how much product is generally applied to trees in practice to achieve mortality.
There is little scientific literature that quantifies the amount of triclopyr required to kill wilding conifers of different sizes when applied as a ground-based basal bark treatment. The amount of triclopyr currently used in aerial control operations is based on a series of trials that tested the efficacy of a range of active ingredients, including triclopyr, on several wilding conifer species (Gous et al. Reference Gous, Watt, Richardson and Kimberley2010, Reference Gous, Raal and Watt2014, Reference Gous, Raal, Kimberley and Watt2015). These trials indicated that for P. contorta, 60 g triclopyr applied in 500 ml of paraffinic oil, with an alkylsilicone surfactant, was sufficient to cause mortality in 85% of trees up to 8-m tall. The design of these trials did not allow a full exploration of the interaction between tree size, dose, and volume and was also limited by use of only paraffinic oils as a carrier substance, now largely restricted from use in the National Wilding Conifer Management Programme.
Although previous research has shown that plant size is a key factor influencing dose–response relationships, determining the best single variate to describe plant size and its accurate quantification can be difficult (Miranda-Fuentes et al. Reference Miranda-Fuentes, Llorens, Rodríguez-Lizana, Cuenca, Gil, Blanco-Roldán and Gil-Ribes2016). There are well-established techniques for estimating conifer biomass using allometric relationships (Gonzalez-Benecke et al. Reference Gonzalez-Benecke, Gezan, Samuelson, Cropper, Leduc and Martin2014; McGinnis et al. Reference McGinnis, Shook and Keeley2010; Waring and Schlesinger Reference Waring and Schlesinger1985). Parameters describing tree size include tree height, stem diameter, crown diameter, crown volume, leaf area, and leaf area density (Gonzalez-Benecke et al. Reference Gonzalez-Benecke, Gezan, Samuelson, Cropper, Leduc and Martin2014; Knowe Reference Knowe1991; McGinnis et al. Reference McGinnis, Shook and Keeley2010). Many studies have indicated that stem diameter is a good indicator of tree biomass with small improvements from incorporating simple crown metrics such as crown width (Jenkins et al. Reference Jenkins, Chojancky, Heath and Birdsey2004; Wagner and Ter-Mikaelian Reference Wagner and Ter-Mikaelian1999). The critical issue in efficacy studies is determining the size attribute or combination of attributes that are effective indicators of optimum dose and the attributes that can be easily measured in-field or used to assign trees to different size classes for scaling of dose to tree size.
Research and observations suggest that triclopyr efficacy can be highly variable. For treatment optimization, information is needed on minimum application rates that ensure mortality for different species and tree sizes and effects of site factors and application timing on efficacy. New precision spray application technologies, such as unmanned aerial vehicles (UAVs), will enable scaling of herbicide dose to tree size either in real time or through assessment of size using remote-sensing tools before spraying (Richardson et al. Reference Richardson, Rolando and Kimberley2020). This development will, however, require the identification of a tree size variable that provides the best prediction of response to any given herbicide dose. Hence, the objectives of the research described here were to:
-
1. Define the lethal dose of triclopyr butoxy ethyl ester for P. contorta trees of different sizes when applied in a methylated seed oil (MSO) to the bark of trees.
-
2. Determine the tree size variates (or derived attributes) that best characterize the dose–response relationship.
-
3. Compare the amount of triclopyr applied during routine aerial field operations with the lethal dose predicted to kill trees of similar size based on experimentally generated dose–response models.
An initial (Experiment 1) and follow-up experiment (Experiment 2) plus a large-scale operational spraying assessment were undertaken to meet the objectives described. Experiment 1 was carried out to determine the amount of triclopyr in oil required to kill trees of a limited size range when applied directly to the bark of the whole stem of the tree. This was followed with Experiment 2, in which a comparison was made across a wider range of tree sizes of herbicide application to the whole stem or base of the tree only, as recommended on the label (Experiment 2). The results from Experiments 1 and 2 were then used to determine the tree size variates (or derived attributes) that best predicted the observed dose–response relationships and the amounts of active ingredient that would cause either 95% or 99% probability of mortality. The outcomes of these models were then compared with audited operational data wherein the dose applied to trees was recorded during a routine ABBA spot-spraying operation with a flow meter and recording unit (Howell and Cockburn Reference Howell and Cockburn2016).
Materials and Methods
Description of the Trial Site for Experiments 1 and 2
The trial site was located alongside Highway 5, south of Taupo near the Rangitaiki River, New Zealand (176.34°E, 38.86°S; 962 m above sea level) and consisted of scattered wilding P. contorta in the height range of 2 to 8 m. Trees were aged at between 3 and 9 yr. The region is commonly referred to as the “frost flats” due to the common, unseasonal frosts and a cool, humid climate (mean annual rainfall of 1200 to 1600 mm, midsummer mean temperature of 14.5 C and midwinter mean temperature of 4.1 C). Besides the exotic conifers, the predominant vegetation at the site was evergreen sclerophyllous shrubland comprised mostly of the epacridaceous shrub monoao (Dracophyllum subulatum Hok. F.) with an understory of lichens and moss. The Rangitaiki region, or southeastern corner of the upper Kaingaroa Plateau, consists mainly of undulating plains overlain by Taupo Pumice colluvium 0.6- to 1.0-m deep. Underlying the Taupo Pumice colluvium is ca. 6 to 8 m of earlier rhyolitic tephras, particularly Waimihia Ash (Smale Reference Smale1990).
Experiment 1
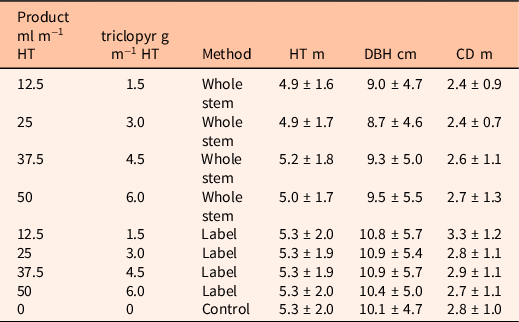
Seventy-five trees in the height range of 3 to 5 m were selected for use in the first dose–response trial. The trees were carefully selected to ensure they were at least 5 m from adjacent trees. The height (HT), mean tree crown (canopy) diameter (CD), average of the crown diameter at the point of maximum crown width and the diameter perpendicular to this line, and diameter at breast height (DBH at 1.4 m) of each tree was measured before treatment application (Table 1). Following measurement, the trees were ranked from smallest to largest and randomly allocated to treatments to ensure an even distribution of heights across treatments. A product containing 12% triclopyr in an MSO (120 g L−1 triclopyr butoxyethyl ester in ethyl esters of fatty acids derived from canola oil; X-Tree® Wet and Dry, United Phosphorus Limited, Auckland, New Zealand), and widely used in operational spot control of wilding conifers, was then applied using a purpose-built bark-spraying unit (Drench Gun Services, Palmerston North, New Zealand; www.drenchgunshop.co.nz). The product was applied to the whole stem of selected trees in February 2018. The spray equipment was fit with an adjustable flat-fan nozzle and could be calibrated to deliver specific volumes using 20-ml aliquots. Four doses (Dose) of triclopyr (9.6, 19.2, 30, and 60 g) were applied as four product volumes (80, 160, 250, and 500 ml) on each of 15 trees, with an additional 15 trees included as untreated controls (Table 1). Maximum and minimum temperatures on the day of herbicide application were 23.7 and 12.9 C, respectively. Twelve months after treatment, all trees were assessed for signs of herbicide damage where the upper and lower halves of each crown were scored for percentage needle browning in 10% increments. In alignment with operational treatments for an acceptable result, we chose 90% as the threshold for an acceptable level of control and defined this as a mortality threshold, while recognizing that some trees may survive. Trees within the 90% to 100% brown foliage class were therefore categorized as “dead.”
Table 1. Treatments applied to the whole stem of Pinus contorta trees (n = 15 per treatment) and tree size attributes in Experiment 1 with the mean and standard error for the tree size variables height (HT), crown diameter (CD), and diameter at breast height (DBH) shown.

Experiment 2
A second bark application trial was carried out at the same site in February 2019. A range of doses (Dose), including lower levels of triclopyr per meter height (with the same product) than were used in Experiment 1, were applied to the bark of trees. Application method (Method) was either over the whole stem or as per label recommendations, which is a band of product applied from the base of the tree to a stem height equivalent to three times the DBH of the trunk (Anonymous 2017). The dose was calibrated as active ingredient (ai) delivered per unit of tree height with five doses tested: 0, 1.5, 3, 4.5, or 6 g triclopyr applied m−1 tree height (equivalent to 12.5, 25, 37.5, and 50 ml m−1 tree height, respectively). Trees were measured before treatment allocation. Following measurement, trees were ranked according to size and then allocated to one of five treatments, such that each treatment included equivalent size range and exact dose per tree could be calculated. Each treatment was applied to 15 trees in the size range ∼2- to 8-m height (Table 2). Maximum and minimum temperatures on the day of application were 20.5 and 10.4 C, respectively. Twelve months after treatment, trees were assessed in the same manner as for Experiment 1. Similarly, trees with 90% to 100% brown foliage were classified as dead.
Table 2. Treatments applied to Pinus contorta trees (n = 15 per treatment) and tree size attributes in Experiment 2 to determine the effect of application method and herbicide dose on tree mortality with the mean and standard error for the tree size variables height (HT), diameter at breast height (DBH) and crown diameter (CD) shown.
Using the bark-spraying unit (same as for Experiment 1), all applications were made to the bark on the main stem of the tree, starting at the base of the tree, moving upward, and either covering the whole stem or limited to the base of the tree only, as per treatment allocation assigned to the tree.
Operational Spraying and Survey Data
Operational (aerial) spot spraying using the ABBA technique was carried out by the Department of Conservation in the Kaweka Conservation Park (176.27°E, 39.46°S). The control area covered 4,000 ha and was carried out in the summer of 2016 and 2017. Triclopyr butoxy ethyl ester, applied as X-Tree® Wet and Dry, was applied to individual trees as per best practice (Russell Reference Russell2019). Data on tree location and amount of herbicide applied were captured at the time of application for each tree using an onboard bespoke turbine-driven flow meter and GPS unit (Howell and Cockburn Reference Howell and Cockburn2016). While the accuracy of this system has not been quantified, these flow meters are generally accurate (<1% error; Smith Reference Smith2001) with calibration.
In late winter 2018, approximately 18 mo after treatment, nine belt transects (10-m wide) with a total length of 2 km were randomly placed across an area that was part of the controlled operation in 2016 to 2017 (Figure 1). Wilding conifers found in the transect area were georeferenced (accuracy >20 cm postprocessed) and their HT, crown area (CA based on two perpendicular CDs), status (dead/alive), and canopy health (% brown and green foliage) were recorded. As with the experiments, trees with more than 90% brown foliage were classed as dead. Operational spray rates and ground-based tree information were merged by matching the locations of georeferenced wilding conifers on the ground with operational locations recorded by the GPS unit and flow meter during spraying.

Figure 1. Location of the belt transects used to locate treated trees in the Kaweka Conservation Park. Red points indicate dead and green points indicate live trees.
Analyses
Because the goal of all assessments was to determine treatments that cause mortality, all models used data in which trees were assessed as 0 = alive and 1 = dead. All analyses were conducted in R (v. 3.6.1; R Development Core Team 2014). Optimal binomial models of mortality were developed using backward selection applied to a generalized linear model (GLM), assuming a binomial distribution and logit link. Where complete separation errors occurred, the binomial GLM was fit by penalizing the likelihood using the method proposed by Firth (Reference Firth1993): bias reduction of maximum-likelihood estimates. All models took the general form:
 $${\rm{logit\;}}\left( p \right) = \ln \left( {{p \over {1 - p}}} \right) = {{\rm{\beta }}_0} + {{\rm{\beta }}_1}{x_1} + \cdot\cdot\cdot + {{\rm{\beta }}_p}{x_p}$$
where
 $$p$$
is the probability of mortality,
$$p$$
is the probability of mortality,
 $${{\rm{\beta }}_0}$$
is an intercept,
$${{\rm{\beta }}_0}$$
is an intercept,
 $${{\rm{\beta }}_1}, \ldots ,\;{{\rm{\beta }}_p}\;$$
are a set of regression coefficients, and
$${{\rm{\beta }}_1}, \ldots ,\;{{\rm{\beta }}_p}\;$$
are a set of regression coefficients, and
 $${x_1},\; \ldots ,\;{x_{p\;}}$$
are the set of predictors and their interaction terms,
$${x_1},\; \ldots ,\;{x_{p\;}}$$
are the set of predictors and their interaction terms,
 $$k = 1, \ldots ,\;p$$
, typically estimated by the maximum-likelihood method (Hosmer et al. Reference Hosmer, Lemeshow and Sturdivant2013).
$$k = 1, \ldots ,\;p$$
, typically estimated by the maximum-likelihood method (Hosmer et al. Reference Hosmer, Lemeshow and Sturdivant2013).
For all experiments and the survey, trees were scored as dead when foliage browning exceeded 90%. Initial model selection was based on the Akaike’s information criterion (AIC) (Akaike Reference Akaike, Parzen, Tanabe and Kitagawa1998), with goodness of fit evaluated using the likelihood ratio test (Hosmer et al. Reference Hosmer, Lemeshow and Sturdivant2013) and Hosmer-Lemeshow test (H&L) (Hosmer and Lemeshow Reference Hosmer and Lemeshow1980). Mcfadden’s generalized R2 (Mcfadden Reference Mcfadden and Zarameka1974) and k-fold cross validation (James et al. Reference James, Witten, Hastie and Tibshirani2013) were used as measures of predictive power. In k-fold cross validation, the original sample is randomly partitioned into k equal-sized subsamples. Of the k subsamples, a single subsample is retained as the validation data for testing the model, and the remaining k − 1 subsamples are used as training data. The cross-validation process is then repeated k times, with each of the k subsamples used exactly once as the validation data. The k results can then be averaged to produce a single estimation. The advantage of this method over repeated random subsampling is that all observations are used for both training and validation, and each observation is used for validation exactly once.
For Experiment 1 (Table 1), the full model (Equation 2) included herbicide dose (Dose; m−1 of tree HT) and tree size (HT, DBH, or CD) as explanatory variables:
 $${\rm{logit}}\left( p \right) = \ln \left( {{p \over {1 - p}}} \right) = {{\rm{\beta }}_0} + {{\rm{\beta }}_1} \times {\rm{Dose}} + {\rm{\;}}{{\rm{\beta }}_2} \times {\rm{Size}} + {{\rm{\beta }}_3} \times {\rm{Dose}} \times {\rm{Size}}$$
For Experiment 2 (Table 2), the full model included both herbicide dose (Dose; m−1 of tree HT) and application method (Method: Whole Stem or Label), and their interactions (Equation 3). During model selection, the effects of the tree size variates HT, DBH, and CD on mortality across treatments were also evaluated. The significance of factor terms was followed up by applying a multiple-comparison procedure using Tukey contrast (R package emmeans; Lenth Reference Lenth2020).
 $$\eqalign{& {\rm{logit}}\left( p \right) = {\rm{ln}}\left( {{p \over {1 - p}}} \right) = {\beta _0} + {\beta _1} \times {\rm{Dose}} + \;{\beta _2} \times {\rm{Method}} \cr & \ \ \ \ \ \ \ \ \ + {\beta _3} \times {\rm{Size}} + {\beta _4} \times {\rm{Dose}} \times {\rm{Method}} + {\beta _5} \times {\rm{Method}} \times {\rm{Size}} \cr & \ \ \ \ \ \ \ \ \ + {\beta _6} \times {\rm{Size}}\; \times \;{\rm{Dose}} + \;{\beta _7} \times {\rm{Dose}}\; \times \;{\rm{Size}}\; \times \;{\rm{Method}} \cr} $$
The data from Experiment 1 and Experiment 2 (Whole Stem data only) were then combined and used to evaluate the best predictors of dose–response by expressing dose as a function of unit tree size, calculated as grams active ingredient of a range of tree size measures as follows:
-
Model i: HT plus CD included as a covariate;
-
Model ii: HT;
-
Model iii: CD;
-
Model iv: crown area (CA = πr2);
-
Model v: DBH
-
Model vi: tree crown volume index (CVI = CD2x HT).
Six models were fit by penalizing the likelihood using the bias reduction method proposed by Firth (Reference Firth1993). All models were evaluated using log likelihood, AIC, AICc (the corrected AIC which can be used as an approximation of AIC for a correction for small sample sizes), and the Bayesian information criteria (BIC) as criteria of goodness of fit, with predictive accuracy evaluated using a k-fold cross-validation approach.
Operational Spraying in Kaweka Conservation Lands
The relationship between the total amount of triclopyr applied to trees assessed as dead and tree size variates (HT and CD) was summarized using scatter plots and trend lines. These data were compared with data from Experiments 1 and 2 to indicate whether reductions in herbicide use could be achieved during operational programs in which triclopyr in oil is used to kill trees using the ABBA method.
Results and Discussion
Experiments 1 and 2
Barring the untreated control, for which there was no mortality, 93% of the treated trees died in Experiment 1. All surviving trees (n = 3) occurred in the lowest dose treatment in which 9.6 g triclopyr was applied in 80 ml of product (Table 1). The high mortality precluded fitting a model that included tree size and dose parameters using binomial GLMs (cf. Equation 2), as there was complete separation within the predictor variable Dose. This outcome reflected the separation in mortality between the treated (92% dead) and untreated trees (100% alive). To overcome the separation error in the predictor variable Dose, an alternative method proposed by Firth (Reference Firth1993) was used in the model. However, the resulting model was not significant (α > 0.05; data and model not shown) and the analysis of the data from Experiment 1 did not provide conclusive results for the effect of tree size on dose response for bark applications of triclopyr in oil for the range of concentrations and tree sizes tested. The results indicated that the lowest dose of 9.6 g triclopyr, or 2 g triclopyr m−1 of tree height, was potentially sufficient to kill trees smaller than 4 m in height, but this dose was insufficient for larger trees (Figure 2). These results were used to inform a follow-up experiment that included a different range of dose treatments and a wider range of tree sizes.

Figure 2. Probability of mortality of Pinus contorta trees in the 9.6 g of triclopyr treatment (n = 15; Experiment 1). Mortality is shown both as a function of (A) tree height and (B) as grams of triclopyr applied per meter of tree height. Trend lines are indicative only, and no statistical significance is attached to these lines
In Experiment 2, the independent variables Dose, Method, and tree CD, and their interactions, were shown to have a significant (α = 0.05) effect on tree mortality (Table 3; Figure 3). All three tree size covariates (HT, DBH, and CD) were tested as predictors of mortality; however, the model with CD as a covariate to Dose and Method had the lowest AIC value and was therefore selected as the best model (Table 3). Herbicide application to the whole stem resulted in significantly (α = 0.05) higher mortality (90 ± 4%) than where herbicide was applied as recommended by the label (54 ± 4%), where no mortality was predicted across all tree sizes and doses tested (Tukey contrast; P < 0.05; Figure 3).
Table 3. Summary of the binomial generalized linear model analysis of mortality of Pinus contorta trees as a function of triclopyr dose (Dose), method of application (Method), and tree size (CD, HT, and DBH) (cf. Equation 3) with the regression coefficients (β) and their standard error (SE), the significance of the terms in the model (deviance, df, P-value), goodness-of-fit statistics (LRT, H&L), and statistics measuring predictive power (McFadden R2, AIC) shown.a

a Abbreviations: AIC, Akaike’s information criterion; CD, crown diameter; H&L, Hosmer-Lemeshow test; HT, height; LRT, likelihood ratio test.
b Dummy variable with a value of 1 when Method = Whole Stem or 0 when Method = Label.
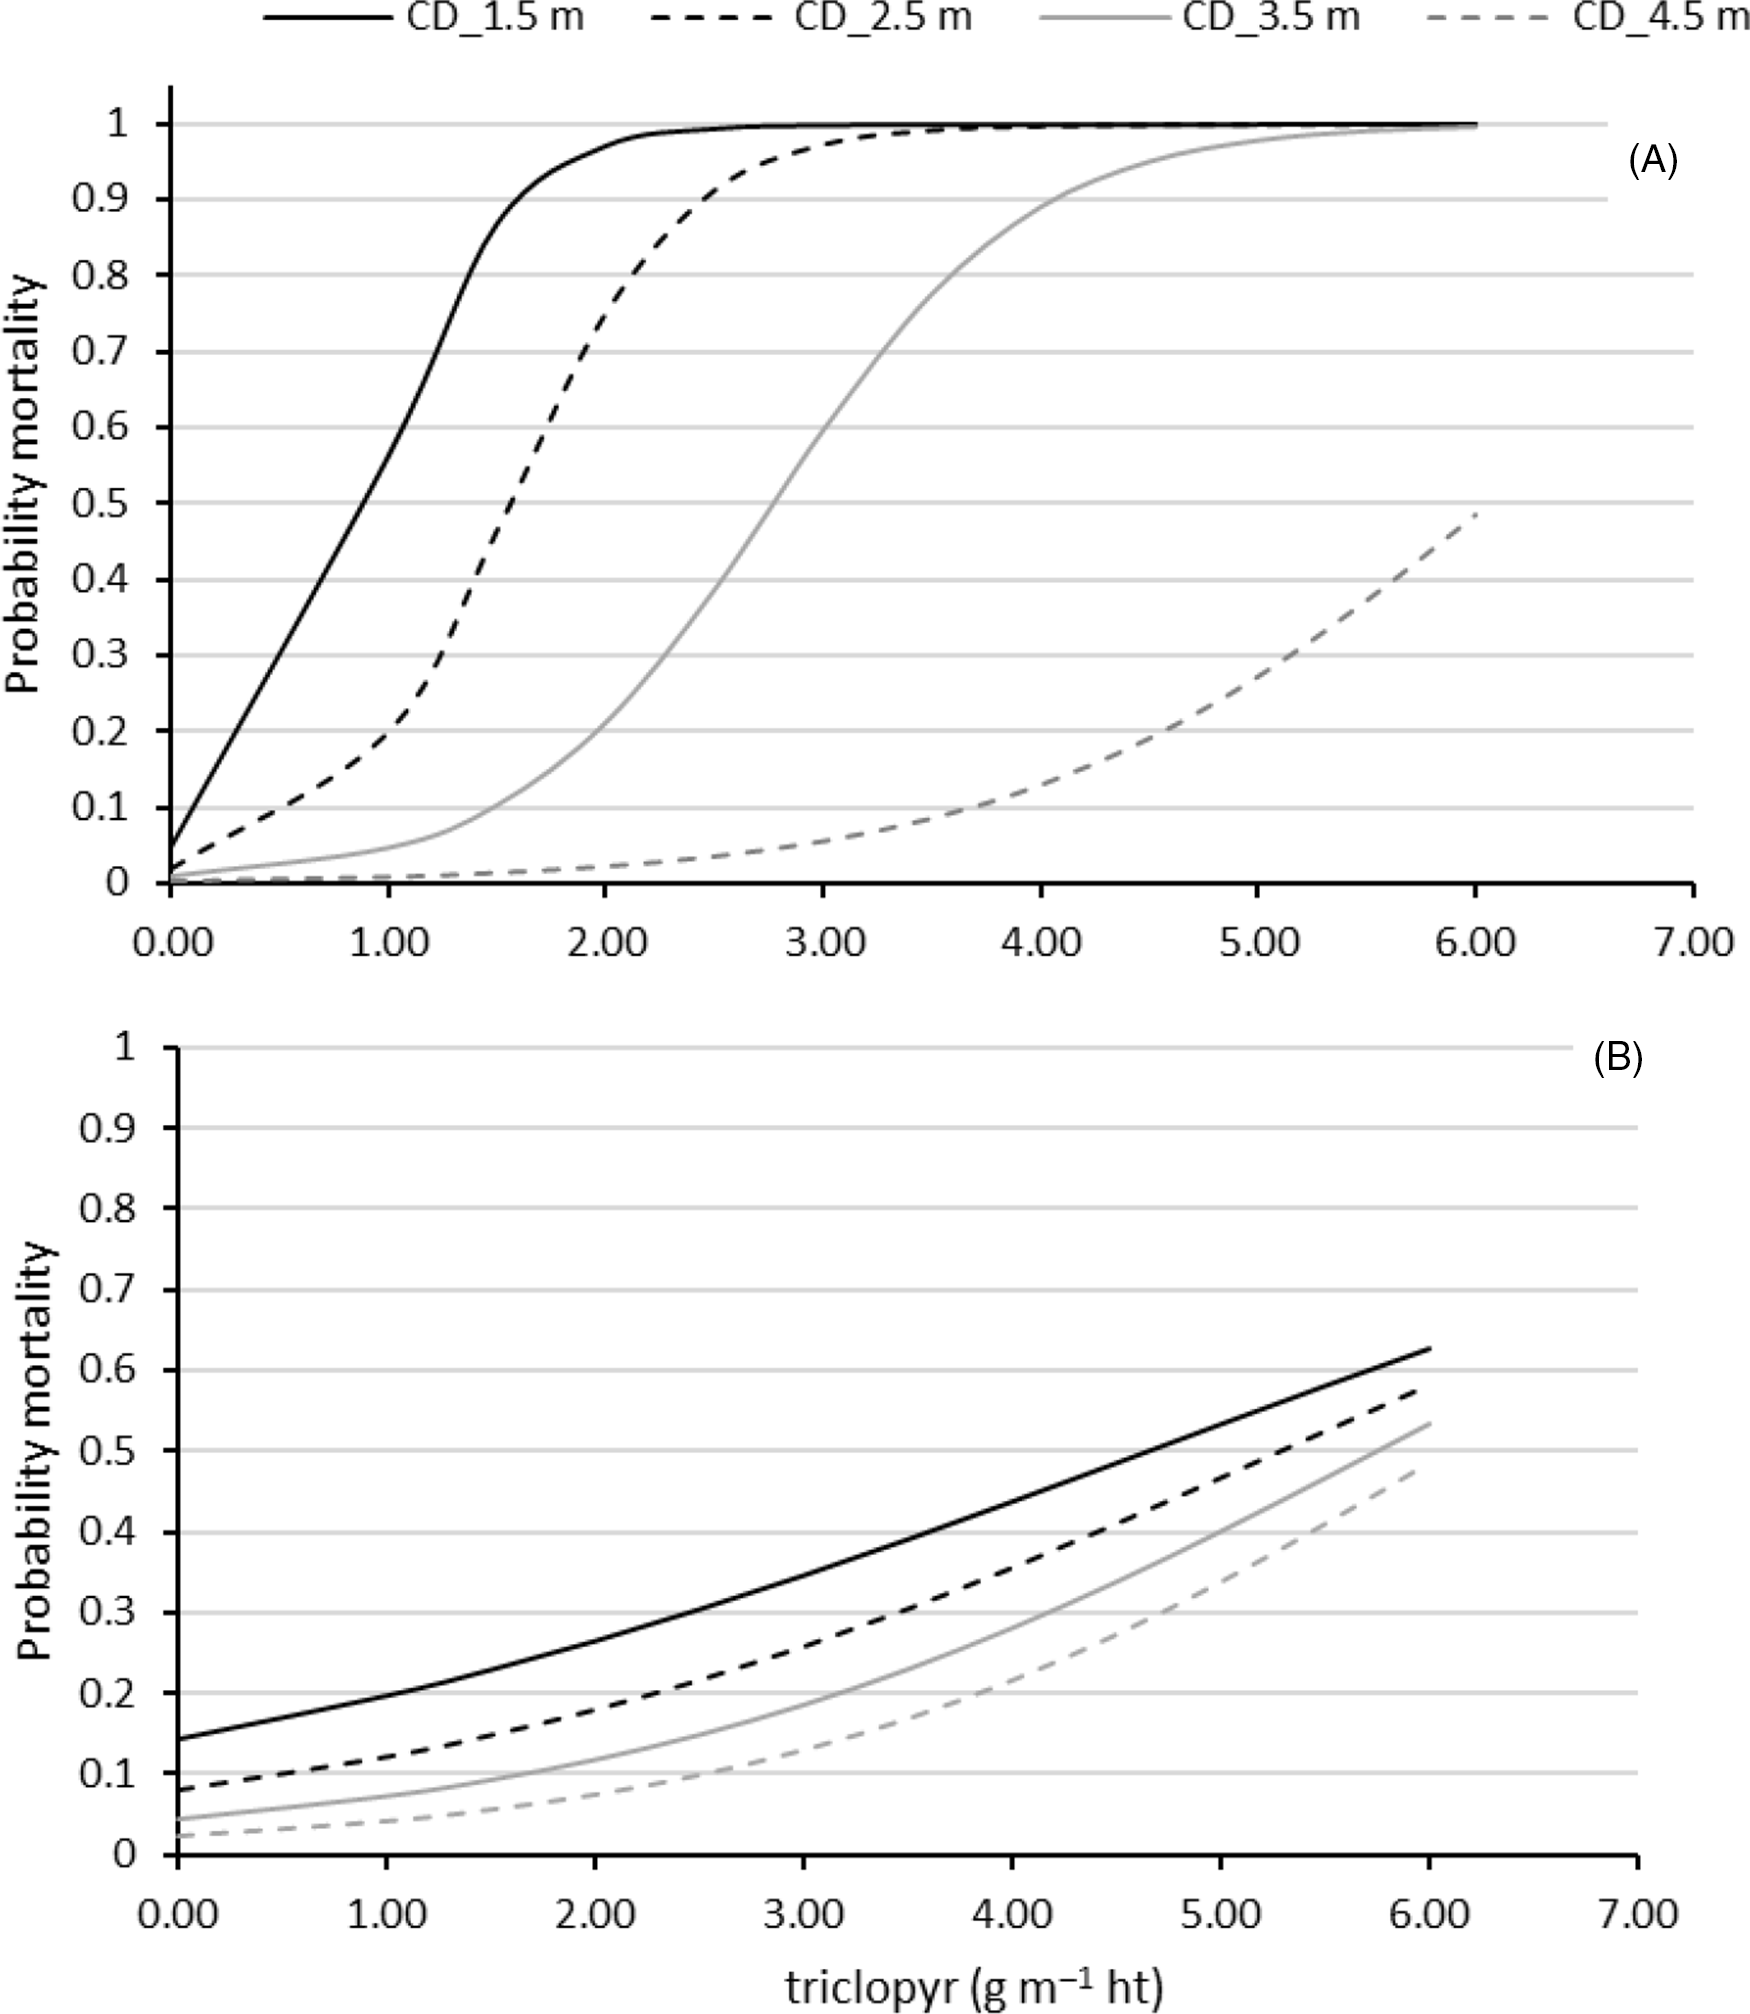
Figure 3. Probability of mortality for Pinus contorta trees with crown diameters (CD) 1.5, 2.5, 3.5, and 4.5 m treated with 0, 1.5, 3.0, 4.5, and 6.0 g of triclopyr (applied as 12% active ingredient in methylated seed oil) applied per meter of tree height (HT) either to (A) the bark of the whole main stem of the tree or (B) as per the label recommendation (see Table 4). Equations for whole stem: logit(p i ) = −1.7601 − 0.008486*CD + 4.64759*Dose − 0.00788*CD*Dose; and the label method: logit(p i ) = −0.8177 − 0.006517*CD + 0.26995*Dose + 0.00077*CD*Dose.
The lower efficacy when treating the base of the tree alone was a surprising outcome, as this method of application has long been an accepted method for control of unwanted invasive woody species (DiTomaso and Kyser Reference DiTomaso and Kyser2007; Nelson et al. Reference Nelson, Ezell and Yeiser2006), including for control of individual, invasive pines in New Zealand (Russell Reference Russell2019). While these results may not necessarily reflect the efficacy of the aerial bark applications (ABBA method), in which most of the stem is treated with oil, they could have important implications for ground-based operations. Basal bark treatments have traditionally been most reliable on smaller stems and are known to be less effective on larger stems with thicker bark layers (DiTomaso and Kyser Reference DiTomaso and Kyser2007; Schneider Reference Schneider1991; Yeiser et al. Reference Yeiser, Reed and Kidd1989). Variation in the efficacy of basal bark applications on wilding P. contorta has also been reported by operational staff in New Zealand, but there are no quantitative data on tree mortality from routine ground-based basal bark operations. The implications for control of wilding P. contorta, currently the most widespread and established wilding conifer in New Zealand, are either to develop methods to increase uptake and translocation of active ingredient when applied to the bark (e.g., changing herbicide concentrations or additives) or to treat a greater area of the whole stem where possible.
Prediction of Dose Response
One of the objectives of this research was to characterize the tree size and dose–response relationship for bark applications of triclopyr. The results from Experiment 2 indicated CD as a significant (α = 0.05) covariate in the prediction of efficacy when dose was applied per unit of tree height, with tree HT and DBH shown to be poorer covariates (Table 3). To complete the analysis, data from Experiment 1 and Experiment 2 (whole-stem treatment data only) were combined (n = 144) and used to evaluate the best predictors of herbicide dose. To simplify models, dose was evaluated per unit tree size expressed as HT (with and without CD as covariate), DBH, CD, CA, and CVI (Table 4; Supplementary Table S1). Out of the six models fit, Model ii, where dose was expressed as a function of HT only, provided the poorest fit to the data (highest AIC) with the lowest predictive accuracy (lowest CV). Model vi, where dose was expressed as a function of unit tree CVI, provided the best fit, with Models i, iii, iv, and v also showing reasonable fit and predictive accuracy.
Table 4. Model comparison for the binomial generalized linear models (GLMs) of the six models obtained by penalizing the likelihood using the bias reduction method proposed by Firth (Reference Firth1993), with Akaike information criterion (AIC) selected model shown in bold. a

a Abbreviations: AICc, corrected AIC; BIC, Bayesian information criteria; CA, crown area; CD, crown diameter; CV, cross-validation estimates of predictive accuracy; CVI, tree crown volume index; DBH, diameter at breast height; df, degrees of freedom of the model; H&L, Hosmer-Lemeshow test; HT, height; Log lik, log likelihood.
b AICc values corrected for model differences.
c CV estimates of predictive accuracy were calculated using 10-fold cross-validation prediction accuracy with 1,000 repeats for the binomial GLMs estimated using the bias reduction method.
Although models i, iii, iv, v, and vi were not nested, we used the informal deviance tests as a rough guide for comparing models (Yee Reference Yee2010). Models iii, iv, v, and vi, which were simpler models, were subsequently compared with Model i, which was a more complex model (combining amount of triclopyr per unit tree height with CD as a covariate). The approximate chi-square test statistic under the null hypothesis that Model iii was comparable to Model i yielded a P-value of
 $$\Pr \left( {\chi_2^2 \gt 19.92} \right) \lt \;0.001$$
, indicating that Model i was a better fit compared with Model iii. The approximate chi-square test statistic under the null hypothesis that Model iv was comparable to Model i yielded a P-value of
$$\Pr \left( {\chi_2^2 \gt 19.92} \right) \lt \;0.001$$
, indicating that Model i was a better fit compared with Model iii. The approximate chi-square test statistic under the null hypothesis that Model iv was comparable to Model i yielded a P-value of
 $$\Pr \left( {\chi_2^2 \gt 5.15} \right) = 0.076$$
, indicating that Model iv was a better fit than model i. The approximate chi-square test statistic under the null hypothesis that Model v was comparable to Model i yielded a P-value of
$$\Pr \left( {\chi_2^2 \gt 5.15} \right) = 0.076$$
, indicating that Model iv was a better fit than model i. The approximate chi-square test statistic under the null hypothesis that Model v was comparable to Model i yielded a P-value of
 $$\Pr \left( {\chi_2^2 \gt 9.59} \right) \lt \;0.05$$
, indicating that Model i was a better fit compared to Model v. The deviance for Model vi was 48.1, while that for Model i was 45.3. A comparison yielded a χ2 of 2.77 on 2 degrees of freedom, suggesting that Model vi, too, appeared a better fit compared with Model i. However, based on goodness of fit and prediction accuracy models i, iii, iv, v, and vi all provided a good fit to the data with reasonable predictive accuracy, with model vi > iv > I > v > iii > ii.
$$\Pr \left( {\chi_2^2 \gt 9.59} \right) \lt \;0.05$$
, indicating that Model i was a better fit compared to Model v. The deviance for Model vi was 48.1, while that for Model i was 45.3. A comparison yielded a χ2 of 2.77 on 2 degrees of freedom, suggesting that Model vi, too, appeared a better fit compared with Model i. However, based on goodness of fit and prediction accuracy models i, iii, iv, v, and vi all provided a good fit to the data with reasonable predictive accuracy, with model vi > iv > I > v > iii > ii.
Using models i to vi, the dose of triclopyr to be applied to the whole stem and estimated to cause mortality with 0.95 or 0.99 probability was predicted (Table 5; Supplementary Figures S1–S5) and used as a basis to determine the total amount of active ingredient required to kill 10 randomly selected trees from the trial data set (Table 6). The purpose of this analysis was to evaluate the sensitivity of model choice to the estimate of the amount of herbicide required to kill a randomly selected set of trees of differing sizes. These models varied in prediction of effective dose by more than 50% for any one tree. For example, Model vi predicted that 6.2 g of triclopyr (or 52 ml of product) would be required to kill a tree (probability = 99%) with a HT of 3.3 m and a CD of 1.9 m, while Model ii predicted 17.0 g of triclopyr (or 141 ml of product) for the same tree. However, while these calculations indicated that the six models predicted different amounts of active ingredient to kill individual trees, using either the 95% or 99% probability values, the total amount of product required to kill all 10 trees was similar. Applying these models over the whole data set gave similar predictions on the amount of product required. As these trials were conducted at only one site in New Zealand, ideally, validation trials would be conducted to determine the application of these models to a wider array of sites and species.
Table 5. The estimated rate of triclopyr (g) per unit of tree size to incur 95% or 99% probability of mortality and associated confidence intervals (CI) for models i – v.

a Abbreviations: CA, crown area; CD, crown diameter; CVI, or crown volume index; DBH, diameter at breast height; HT, height.
b The estimated rate (CI) of triclopyr per meter of tree size to kill with 95% and 99% probability, where CIs were calculated from the lower and upper limits based on the 95% mortality prediction of model.
Table 6. Total triclopyr (g) in oil predicted to provide a 95% and 99% probability of mortality of 10 randomly selected trees when applied to the bark. a

a Values obtained from Table 5 were used in calculations. The total amount of active ingredient and product that would theoretically be required to kill these 10 trees using models i to vi shown.
b Abbreviations: CD, crown diameter; DBH, diameter at breast height; HT, height.
Other studies have shown similar effects of tree size on treatment efficacy in relation to dose (Enloe et al. Reference Enloe, O’Sullivan, Loewenstein, Brantley and Lauer2016). Crown diameter, which is strongly linked to crown area and crown volume, has been shown to be a good predictor of herbicide treatment efficacy (Knowe Reference Knowe1991; Miranda-Fuentes et al. Reference Miranda-Fuentes, Llorens, Rodríguez-Lizana, Cuenca, Gil, Blanco-Roldán and Gil-Ribes2016), no doubt because of the strong relationship of this variate to woody plant biomass (McGinnis et al. Reference McGinnis, Shook and Keeley2010). In a study to develop equations to predict woody plant biomass using nondestructive assessments, McGinnis et al. (Reference McGinnis, Shook and Keeley2010) found CD, crown volume, and both CD and height as the best predictors of biomass (albeit for broadleaf woody species). In a pine release study, Zedaker and Freyman (Reference Zedaker and Freyman1988) reported the highest control of hardwoods in relation to herbicide applied was based on calculated crown volume, intermediate control from crown area, and the lowest control calculated from crown height. Similar outcomes were also reported by Knowe (Reference Knowe1991). Expressing dose per unit of DBH was also shown to be a good predictor of efficacy in the combined data set, an unsurprising result given the strong relationship of this variable to tree biomass (Ung et al. Reference Ung, Bernier and Guo2008). In operational practice, however, CA, CVI, and DBH may not be practical variables to estimate visually and are possibly unsuitable for dose estimation ad hoc (e.g., McGinnis et al. Reference McGinnis, Shook and Keeley2010). While DBH may be an easy variable to estimate in forest stands, for individual or clumped weedy trees, the stem is often obscured by foliage, with multiple stems not uncommon. In future, application of herbicides from a UAV to either the crown foliage or bark might allow for estimation of crown volume or crown area in real time, allowing for more precise application of spray doses calibrated to two-dimensional or three-dimensional estimates of tree size. In the meantime, operators applying herbicide to the tree from the ground or a helicopter are more likely to use size variates easier to assess visually, such as tree HT or CD. Out of the size variates HT and CD, the models developed in this study indicated that dose applied on an estimate of CD provided a reasonable fit with good prediction accuracy.
Operational Spraying and Survey
A total of 460 trees were assessed and spatially georeferenced across the nine sampling transects, with 270 of these aligning to referenced points in the operational data set. Of the remaining 190 trees, 47 could not be assigned to a recorded location and herbicide amount, and 143 trees were recorded as not being sprayed, that is, 31% of trees assessed were missed during the spraying operation. These untreated trees ranged in HT from 0.3 to 5.3 m and followed a similar distribution in HT to those trees that were treated. The high percentage of trees missed is most likely a reflection of the steep terrain and high density of surrounding arboreal shrubs such as mānuka [Leptospermum scoparium (J.R. Forst. & G. Forst.)] and rawirinui [Kunzea robusta (de Lange & Toelken)], which would have reduced the visibility of conifers during the aerial spraying operation.
The 270 trees aligning to treated points ranged in size from 0.5 to 6 m, with an average HT and CD (±SE) of 1.9 ± 0.07 and 1.0 ± 0.03 m, respectively. Of the trees treated, 86% (231) were killed. Trees that were not killed ranged in height between 0.5 and 3.9 m.
The relationship between tree size (HT and CD) and the amount of herbicide applied was plotted for all trees aligning to treated points (Figure 4). The scatter in the operational data highlighted the wide range in the amount of herbicide applied to trees of similar size. When tree size was described using either HT or CD, the lower bounds of the operational rate range that achieved mortality were very similar to the predicted rates derived from Experiments 1 and 2 (Figure 4). This result implies that in many cases, operational herbicide rates can be up to about seven to eight times higher than rates required to achieve mortality. However, it is notable that the doses applied to trees not killed were mostly between the modeled dose and the center of the distribution, highlighting that such threshold doses may not be optimal for application from a helicopter, probably due to application errors and a significant proportion of spray missing the target tree.

Figure 4. Data collected during an operational aerial spot-spraying exercise using the aerial basal bark application, or ABBA, method of applying triclopyr in methylated seed oil to individual conifers. Shown are the amounts of herbicide applied to trees that were evaluated as dead (x) or alive (o) expressed as the total amount of triclopyr (g active ingredient) applied to trees of different (A) height and (B) crown diameters. Gray lines show the trend (best fit) of the operational data. Shown as dotted red lines on each figure are also the comparative rates of triclopyr shown to kill trees in a research trial where herbicide was applied direct to the bark of the trees.
Herbicide application methods that involve treating individual stems with herbicides can result in large amounts of herbicide being used if applied to scattered individuals. Overdosing occurs when practitioners exceed herbicide label rates or do not follow area application rates, an activity that is easy to do in conservation lands that are not delineated or measured as for agricultural or forestry land use (Holmes and Berry Reference Holmes and Berry2009). Of all the actions to reduce the environmental impact of herbicides, dose adjustment is one of the most important. As a first step, the data generated from the experimental trials could be used to provide better recommendations to ground operators on the amounts of product to apply to trees of different sizes. This would reduce both the cost of the ground operations and input of herbicide into the environment. The data from the aerial control operation carried out in the Kaweka Conservation Park indicated a high variability in the amount of herbicide applied to trees of similar sizes. Considering the difficulties of targeting and tree size estimation from a hovering helicopter, this is not at all surprising. From an operational perspective, the additional costs of excess herbicide are probably negligible considering the cost of flying, personnel time, and risk of managing to a minimum dosage threshold that may require repeat operations. However, a comparison of the amount of herbicide used operationally with that estimated to provide 95% probability of mortality from experimental trials indicated that dose reductions by at least 50% were feasible. Hence, rate reductions and improved targeting of dose to tree size could be encouraged from an environmental perspective, even if economic gains are marginal.
It is interesting to put a value (31%) to the percentage of trees that were missed in the ABBA operation carried out in the Kaweka Conservation Park. This is the first assessment to benchmark the efficiency of the ABBA method in steep, hilly terrain where wildings are emerging within regenerating forest. The Kaweka range is an environment with flat hilltops dominated by subalpine shrublands and tussocks, steep hill flanks covered in rapidly regenerating L. scoparium and kānuka [Kunzea ericoides (A. Rich.) J. Thomp.], and gullies comprising shrub species mixed with beech (Nothofagaceae Kuprian) and indigenous conifer species (Podocarpaceae Endl.). Not only is this difficult terrain to navigate by helicopter, but this is also a difficult vegetation type from which to identify the emerging wilding conifers. A value of 31% missed is reasonably high and highlights a requirement for a repeat operation with the associated high helicopter and personnel costs. Recent advances in detecting wildings remotely (Dash et al. Reference Dash, Watt, Paul, Morgenroth and Pearse2019b) confirmed that in simpler landscapes (grasslands), trees taller than 1 m can be detected with high accuracy, and with further improvements in the technology (e.g., UAVs combined with multispectral sensors) and algorithms (Dash et al. Reference Dash, Watt, Paul, Morgenroth and Hartley2019a), it is expected that even in complex landscapes, the detection levels can be improved to avoid frequent control operations. Automated mapping and estimation of tree sizes based on high-resolution imagery can also provide valuable information to inform operational managers of where the greatest gains in efficiency of control operations could be made, in conjunction with better targeting of herbicide dose to tree size.
This study has provided a first step in quantifying the triclopyr dose required to kill individual P. contorta trees when applied to the bark. While the experimental work was repeated over 2 yr, the next step will be to validate these initial models across a broader range of sites and species and to test whether season of application influences efficacy. There are currently conflicting opinions from operational managers on timing effects, but there are currently no data on this topic for quantitative analysis. Further testing will allow for refinements in models and potential reductions in the amounts of herbicide used.
Acknowledgments
The authors would like to acknowledge Vanessa Cotterill, Liam Wright, and John Meredith for the technical assistance provided in implementing and assessing these field trials. The work was funded by the Winning against Wildings MBIE Programme, contract no. C09X1611.
The authors declare no conflict of interest.
Supplementary material
To view supplementary material for this article, please visit https://doi.org/10.1017/inp.2021.7


 Open access