


Introduction
The discovery of extraterrestrial intelligence (ETI) (or its absence in rigorous, complete surveys of the local Universe) would clearly have enormous consequences for humanity. This has prompted scientists to conduct searches for ETI, or SETI, at least for the last 50 years or so. The lack of confirmed detections of ETI so far may be dismaying, but it remains an important data point in our quest to place human beings in cosmic context.
SETI searches vary widely in their methodology, targets and analysis. The ‘classic’ radio SETI method (Cocconi and Morrison, Reference Cocconi and Morrison1959) focuses on detecting either intentional or unintentional radio transmissions from ETI. This search is motivated by the Earth's suitability for transmitting and receiving radio signals at a specified range of frequencies commonly known as ‘the terrestrial microwave window’ (see Colloquy 4, in Morrison et al., Reference Morrison, Billingham and Wolfe1977), as well as the ability for radio waves to travel interstellar distances without suffering significant absorption.
Similarly, optical SETI searches (Schwartz and Townes, Reference Schwartz and Townes1961) have been attempted to detect pulsed, narrowband, collimated optical light from stars. ‘Artefact’ SETI searches for other signs of technology, including waste heat (Dyson, Reference Dyson1960) or Solar System probes. The interested reader can find historical lists of radio and optical SETI searches in Ekers (Reference Ekers2002). Both fields continue to advance: examples of the latest searches in both radio and optical are recorded in Isaacson et al. (Reference Isaacson, Siemion, Marcy, Lebofsky, Price, MacMahon, Croft, DeBoer, Hickish, Werthimer, Sheikh, Hellbourg and Enriquez2017), Tellis and Marcy (Reference Tellis and Marcy2017).
Both radio and optical SETI have been boosted by an improved understanding of planetary systems around other stars (Wright, Reference Wright2017). Indeed, the science of exoplanet detection has begun to yield new observables for SETI science, such as the possibility of detecting megastructures in exoplanet transit light curves (Forgan, Reference Forgan2013; Korpela et al., Reference Korpela, Sallmen and Greene2015; Wright et al., Reference Wright, Cartier, Zhao, Jontof-Hutter and Ford2015).
As electronic costs have fallen, and the number of available sites for SETI observations has increased, the SETI community continues to grow throughout the world. Astronomers increasingly observe via large surveys (which produce large quantities of time series data at high sensitivity and cadence). This gives rise to the prospect for SETI via data mining of public archives, opening up the search to effectively the entire planet.
Regardless of the detection method, the characterization of a SETI signal has several different phases. During each phase, the likelihood of such a signal being bona fide ETI increases or decreases. In every signal to date, the likelihood has decreased to low enough values that there are no widely agreed ETI candidates at the time of writing.
Almár and Tarter (Reference Almár and Tarter2000) attempted to encapsulate the significance of a possible SETI signal using a simple linear scale. This was named the Rio scale, as it was first presented at the 51st International Astronautical Congress in Rio de Janeiro (see also Almár Reference Almár2001, Reference Almár2011; Almár and Tarter Reference Almár and Tarter2011). Broadly, this tool was designed for communicating with the public as to ‘how excited’ they should be regarding a signal. The scale is constructed by multiplying two numbers: Q, which describes the consequences of a signal if it is an ETI discovery, and δ, a description of the credibility of the signal being truly ETI. The resulting scale
 $$R = Q\delta.$$
Ranges between 0 and 10, with 10 being of the greatest possible excitement.
In the 17 years since the scale was formulated, it has seen a modest level of traction in the press. Despite its simplicity and the availability of online calculators, in recent years, the scale has fallen out of use by SETI practitioners when evaluating their signals. As a result, the scale is not well known among science journalists, and by extension the wider public.
The level of ‘brand recognition’ of Rio has been stymied to some degree by the general fragmentation of the media. The number of news outlets has proliferated significantly, and stories now break and distort at alarming speed thanks to social media, which can hamper the efforts of scientists to communicate effectively with the public (Forgan and Scholz, Reference Forgan and Scholz2016). The personal experience of the authors suggests that the knowledge of the Rio scale among journalists is patchy at best, although Rio scale values have been reported for some recent claimed signals.
The Rio scale should be assigned as a standard to any putative signal, and could be a valuable tool in managing public expectations. However, the scale was formulated during a period when the scientists had the luxury of time in analysing the signal. It is increasingly common that signals become public knowledge without a great deal of analysis and checking, and the scale as it stands tends to over-rank signals compared with consensus opinion from the SETI community.
We revisit the Rio scale, with the intent to
(a) encourage all SETI groups to give every signal an R value, and to revise this value as further analysis is undertaken,
(b) enhance the effectiveness of the scale in modern science communication and
(c) to help calibrate public expectations of tentative signals.
In the following sections, we recap the initial Rio scale (which we dub Rio 1.0/1.1) and then propose our replacement scale, Rio 2.0, which is calculated by completing a questionnaire. Finally, we discuss how this scale should be used when communicating with the media and the general public about potential SETI signals.
Terminology
Before beginning, it is important to be clear on the use of jargon. A ‘detection’ has a clear astronomical meaning (in that a signal was received that exceeded some predefined noise threshold), but its meaning to the layperson has unwanted connotations of discovery and confirmation.
We advise the SETI community to adopt a single set of terminology for discussing signals. We will use the following phraseology to distinguish the various stages of a signal's journey, from its initial registering on instrumentation to the final reduced data product (with accompanying physical interpretation). The vast majority of signals fail to proceed past the first or second steps. No current signal, not even the famous Wow! signal (see Gray and Ellingsen Reference Gray and Ellingsen2002 and references within), currently scores >1 on either Rio 1.1 or Rio 2.0.
• Speculative signals (S) are signals at their earliest stage. Speculative signals have only been analysed by one research group, on a single instrument.
• Unverified signals (U) are signals whose data have been analysed by more than one research group, ideally using different methods, but the signal has only been detected by one set of instrumentationFootnote 1.
• Verified signals (V) have been confirmed by at least one extra measurement with independent instrumentation. Verified signals may still be due to instrumentation error. Depending on the signal and the equipment used, a non-instrumental origin can be demonstrated for some verified signals, and these progress immediately into the next category.
• Candidate signals (C) should only refer to a verified signal that is demonstrably not due to instrumentation effects. Candidates may have an as-yet-unidentified natural or anthropogenic origin, such as radio frequency interference (RFI). Examples of candidates have included both pulsars and quasars in the immediate aftermath of their detection, before their natural causes were understood (see, e.g. Penny Reference Penny2013).
• Discovery (D) refers to a signal characterized as from ETI with high confidence.
The Rio scale 1.0/1.1
The initial Rio scale was defined as per equation (1), where R is the Rio score, Q represents the significance of the consequences of an event and δ describes the probability that the event did indeed occur (and was not an instrumentation error, an interpretation error, a human-made signal or a deliberate hoax).
Almár and Tarter (Reference Almár and Tarter2000, Reference Almár and Tarter2011) describe Q as a sum of three factors, relating to the phenomenon class, the method of discovery and the distance of the event from the Earth (Table 1). Adding the three factors gives a value for Q between 3 and 15. Crucial factors in the construction of Q include whether the signal is a message, containing information as opposed to a beacon, and whether the signal indicates the knowledge of the Earth's existence (i.e. Is the signal specifically transmitted at the Earth or broadcast in all directions?). The nature of the observation – either a deliberate search for SETI signals/evidence of artefacts (SETA) or an accidental or serendipitous observation – also influences Q, as does the apparent distance of the signal from the Earth.
Table 1. The schema for evaluating Q in the Rio 1.0 and 1.1 schemes
In the Rio 1.0 scheme, the δ parameter was allowed to vary between 0 and 1, giving the range of R to be [0,15]. The later Rio 1.1 scheme (Almár, Reference Almár2001) modified δ so that R ranged between [0,10].
A calculator for Rio 1.1 is available onlineFootnote 2 – the user interface is shown in Fig. 1. The calculator takes the form of a very simple quiz, with three questions to determine Q using the schema in Table 1, and a single question to determine δ. While it is useful to have such a calculator for the public, it is extremely simple. δ can only take one of five values: (0, 0.2, 0.5, 0.7, 1.0).
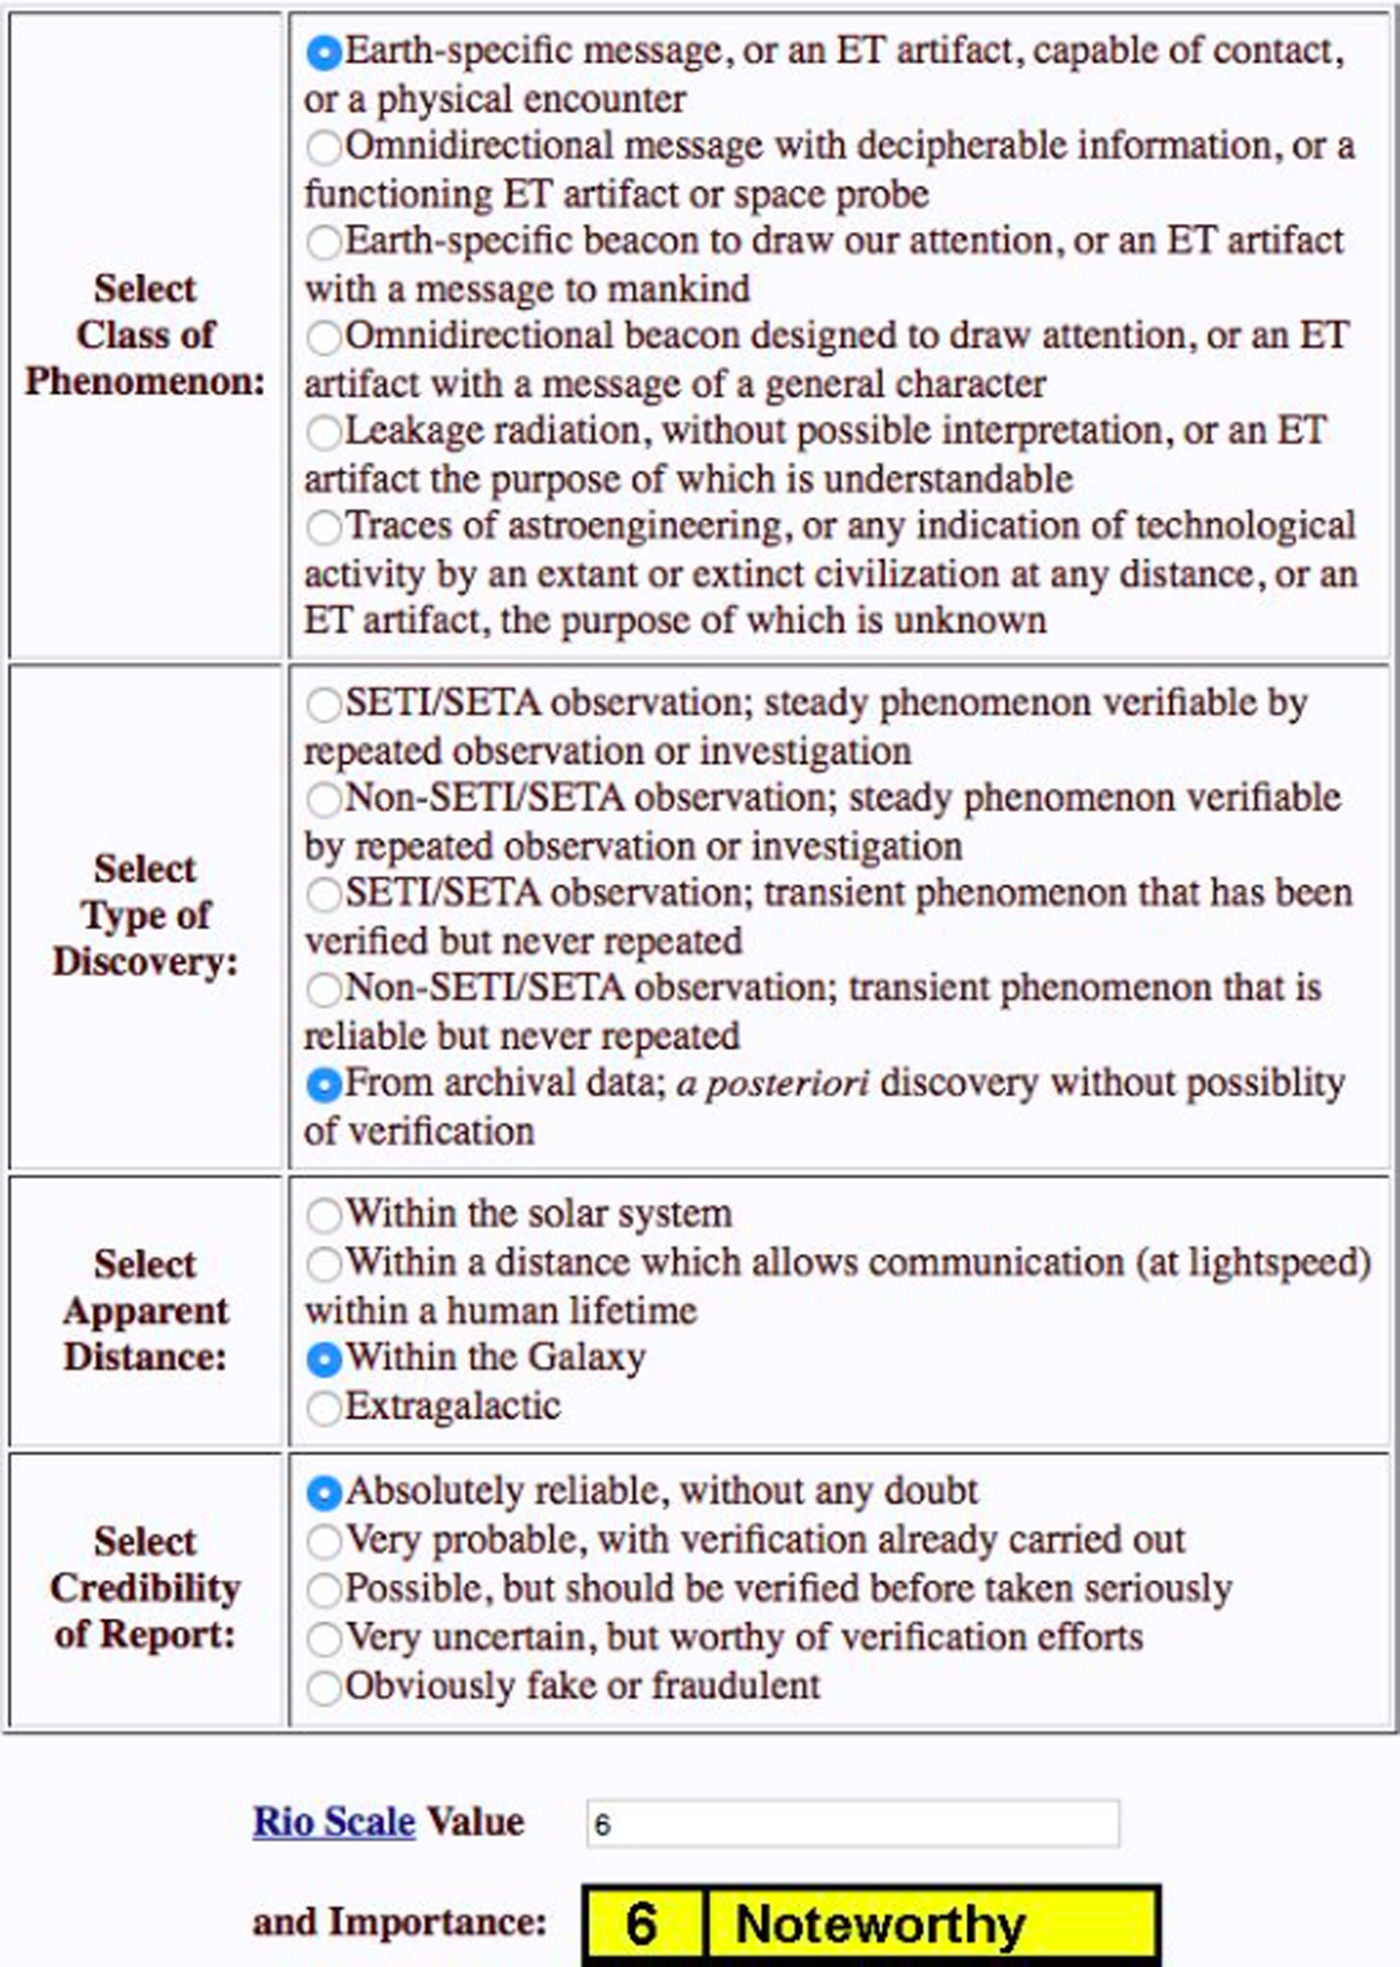
Fig. 1. A screenshot of the Rio 1.1 calculator. The first three questions define Q, the significance of the consequences of a signal, and the last question estimates δ, the credibility of a claimed discovery.
It is also rather opaque to the user. The values of Q and δ are not displayed, only R. If the user reads Almár and Tarter (Reference Almár and Tarter2000), they can deduce these values, but this takes a notably larger effort.
Finally, this appears to be the only calculator available, and was designed well in advance of the Web 2.0. Web browsing is increasingly the domain of mobile devices, not desktop or laptop computers (Ofcom, 2015; Pew Research Center, 2015; GlobalStats StatCounter, 2016). Future Rio scale calculators should be flexible enough to be viewed on any Internet accessing system, and should respect accessibility standards – it is noteworthy that the current Rio 1.1 calculator respects HTML 4 and is accessible from current smartphone and tablet browsers.
Rio 1.1 has helped us to clarify our thinking as to how to communicate to the public regarding SETI signals. It has unfortunately only seen limited use by the SETI community when discussing its own signals, and it is not widely known among journalists or the general public. We feel that a revised Rio scale is necessary not only to improve the scale's public profile, but to make it more relevant to modern communication practices and technology. This will in turn make it more appealing for both SETI practitioners and science communicators to use, as we describe in the following section.
The Rio scale 2.0
Desiderata for Rio 2.0
In this section, we list some desired properties of the Rio scale, given its intended use as a tool to calibrate the public's expectations of the importance of an event.
(i) The new Rio scale should not completely discard the structure of Rio 1.0/1.1, i.e. it should still be derived as R = Q δ, where Q is the consequence of the signal and δ is the credibility. However, there should be less focus on interpreting the signal, and more on its observational properties.
(ii) We need to preserve the ability of Rio to deliver a score quickly. It should become a matter of course for SETI groups around the world to calculate a score in a few minutes, and for groups to score each other's work.
(iii) The score needs to be as objective as possible – the subjectivity of the user must not be allowed to dominate the final score. An ideal calculator would allow a roomful of people from various technical backgrounds to return similar scores. That being the case, if a SETI group announces a candidate with a high Rio score, and another gives a vastly different score (say a very low one), this remains valuable information for the public.
(iv) Rio 2.0 should reflect our current estimations of signals (such as the Wow! signal, and Boyajian's star). It should also reproduce previous estimations of old candidates such as quasars and pulsars.
(v) The score should be easy to comprehend. A layperson should be able to answer the questions necessary to derive a score, as a means to understanding how signals are evaluated (see vii). It is of course the case that expertize is needed to produce a sufficiently reliable score.
(vi) The algorithm and code that implements the score should be open source for maximum transparency. Easily accessible websites, webapps and smartphone apps should be developed so that anyone can derive a Rio score for a signal, given appropriate coaching. It is clear from citizen science projects that the general public are able to complete similar classification tasks with relatively low amounts of training.
(vii) Most importantly, the Rio scale should teach the public how SETI scientists evaluate signals. A well-designed website has the potential to be a powerful pedagogical tool, to inoculate against overblown press. It provides transparency to scientific thought processes, and indicates to the public how much work remains to be done to characterize the signal.
(viii) Science communicators and other allied groups should be able to use it effectively when discussing the implications of a signal in social and digital media (Forgan and Scholz, Reference Forgan and Scholz2016).
Algorithm for the Rio 2.0 calculator
We envisage the new Rio scale calculator as being a website hosting a short quiz rather than a range of buttons on one page. Each page has a single question, and the user does not learn the values of Q or δ until the quiz completes. In the case of δ, the quiz may complete early (e.g. if there is a good reason to believe the signal is a hoax).
As with Rio 1.0, it is clear that the scale value will likely change with time (as other teams verify a signal, or as a plausible natural explanation is discovered).
Questions to compute Q (0 to >10)
(Q1) What is the estimated distance to the source of the signal? (Begin with Q between 0 and 4)
Less than a light day (i.e. in the Solar System): Q = 4.
Light-days to light-years (i.e. about as close as the nearest star): Q = 3.
Light-years to tens of light-years: Q = 2.
Hundreds to thousands of light-years (in the Galaxy): Q = 1.
Longer/unknown: Q = 0.
(Q2) What are the prospects for communication with the source of the signal? (Add between 0 and 4 points to Q)
We are in the active two-way communication: Q = Q + 4.
We could respond using the same medium/encoding as the signal within 20 years: Q = Q + 3.
We can understand the signal or we have artefacts we can study: Q = Q + 2.
No communication is taking place: Q = Q + 0.
(Q3) Is the sender aware of humanity/its technology? (Add between −1 and 2 points to Q)
Yes, certainly – the signal is intended for us, specifically: Q = Q + 2.
Possibly, but there is a little or no evidence for this: Q = Q + 1.
Almost certainly not (e.g. they are too far away): Q = Q + 0.
Senders are apparently extinct: Q = Q−1.
If Q < 0: Q = 0.
Questions to compute δ (0 to >1)
Since any discovery of ETI is newsworthy, δ maps well onto a scale of interest for the press, which we call J.
J is computed as the product of three quantities: the probability that the signal is real (section A), the probability that it is not instrumental (section B) and the probability that it is not natural or human-made (section C). To preserve dynamic range at the bottom, the scale is expressed in terms of logarithms and rescaled to have a maximum at 10:
 $$2{\rm lo}{\rm g}_{10}({\rm \delta} ) + 10 = J = A + B + C - 20,$$
where J is the rescaled, logarithmic probability, and A, B and C represent the three logarithmic, rescaled probabilities that go into the final probability.
The idea behind this rescaling is that two steps on the scale is a factor of 10. A value of 10 means 100% certainty, 8 means 10% confidence, 6 means 1% confidence and so on.
J and δ can be computed directly if probabilities for the three components can be assessed quantitatively. That is, if the probabilities to ‘yes/no’ answers to the questions to A, B and C can be determined, one multiplies them together to get δ and calculates J using the equation above.
To assist with this assessment, one can construct a series of questions to guide the process of determining J, given below.
Please note that this questionnaire is geared towards ‘everyday’ SETI ‘detections’, which means it is about splitting fine hairs for very low probabilities. As a result, this questionnaire does not provide much granularity between δ = 0.1−1. If a signal is confirmed to be artificial and extraterrestrial with δ>0.1, it may be necessary to revisit this calculation according to the specifics of that signal, while maintaining the spirit of the scale.
Also note that the A, B, and C terms are not entirely independent: the same fact can affect more than one term. Some facts also appear in Q. This is intentional and desirable: the nature of the signal, which contributes to Q, can also influence its credibility as being real, being astrophysical and being alien.
Questionnaire for computing J
Experts in a field relevant to a given ‘signal’ may use their judgement to give half points or otherwise interpolate for phenomena that land in between points on the scales below, or to adjust their points based on idiosyncrasies of a given signal that were unanticipated by this questionnaire. Notes are given below the questions to help users with their interpretation.
A ‘perfect’ score on the questionnaire yields A = 10, B = 10, C = 10, giving J = A + B + C−20 = 10, or a 100% probability that the signal is real and alien. For these purposes, it is useful to remember that one point is worth roughly a factor of 3 in confidence and two points is worth a factor of 10.
On this form, these terms mean:
Anthropogenic: Made by humans. Includes radiation from objects made by humans.
Artificial: Engineered by intelligent beings.
Extraterrestrial: Originating outside the Earth. Can but does not definitively imply origin outside the Solar System.
Instrumental: A product of a measurement instrument itself or its operator, as opposed to something natural or artificial.
Natural: Not made by intelligent beings (i.e. the opposite of artificial).
Terrestrial: Originating from the Earth. Not necessarily artificial. Includes objects that have left the earth – for example, under this definition Voyager 1 and 2 are still terrestrial.
Section A: How real and amenable to study is the phenomenon?
(A1) Is there a significant uncertainty about whether the phenomenon occurred/occurs at all? For instance, are the data corrupted, is there a significant risk of misunderstanding or transcription error? ‘Significant’ here means more than 10%.
Yes, there is a significant uncertainty: A = 6 (skip rest of A, go to B1).
No, something almost certainly happened: A = 7.
(Examples of significant uncertainty: reports of sighting of a UFO or aliens, interpretation of ancient art, telescopic data from amateurs, interpreting other people's data with little or no documentation or metadata.)
(A2) How amenable to study is the phenomenon? Award between 0 and 3 points based upon the repeatability of the phenomena.
x = 0: The phenomena has been observed exactly once (e.g. the Wow! signal).
x = 1: The phenomenon has been observed a small but plural number times, either as multiple targets showing similar phenomena, or a single target showing multiple similar events (e.g. claimed laser pulses in SDSS data (Borra and Trottier, Reference Borra and Trottier2016), discovery of a few Fast Radio Bursts (FRBs) at a single observatory (cf. Lorimer et al., Reference Lorimer, Bailes, McLaughlin, Narkevic and Crawford2007)).
x = 2: The phenomenon has been confirmed to be real and repeated, for instance by multiple groups using a single instrument to observe the phenomenon or by an additional observation with a different instrument or from a different site (e.g. FRBs discovered at other observatories, or once several FRBs were known).
x = 3: The phenomenon is observed routinely by different groups using different equipment (e.g. FRBs as observed today, see Petroff et al., Reference Petroff, Barr, Jameson, Keane, Bailes, Kramer, Morello, Tabbara and van Straten2016).
A = A + x.
(A3) Is the discoverer of the phenomenon the same person/group that predicted that such a phenomenon would indicate the presence of alien intelligence?
The claimants predicted the phenomenon they have ‘discovered’: A = A−1.
The claimants have identified a new phenomenon, or one predicted by others: A = A + 0.
People are natural wishful thinkers, and often see what they want to see, so it gives extra credibility to a claim if the groups doing the prediction and those doing the discovery are not the same.
Section B: How certain are we that the phenomenon is not instrumental?
(B1) Does the phenomenon look like a known instrumental or psychological effect?
Yes: B = 0, go to C1.
No: B = 7.
Examples of known instrumental effects: DC channel in a filterbank file, cosmic rays in spectra, lens flare in photograph, known source of noise/bad data.
Examples of known psychological effects: Reports of alien abduction, UFO sightings; subjective, qualitative interpretations of apparent correlations in noisy data.
(B2) What chances do the instrument builders/experts in the method/observers of the phenomenon give that the signal is not instrumental?
Award between 0 and 3 points:
x = 0: These experts have not weighed in at all.
x = 1: These experts give a ~90% chance that it is instrumental (so a ~10% it is real).
x = 2: These experts give even odds that it is instrumental.
x = 3: These experts give <10% chance that it is instrumental.
B = B + x.
Section C: How certain are we that the phenomenon is not natural or anthropogenic?
(C1) Is there a good reason to think the phenomenon is a hoax?
Yes: C = 0 → J = 0, end quiz.
No: C = 1.
(C2) How does a wide community of experts assess the probability that there are any known sources of natural or anthropogenic signal that could explain the phenomenon?
x = 0: A wide range of experts agree that the signal is clearly natural/anthropogenic, or said experts have not been consulted.
x = 1: It is consistent with a common phenomenon.
x = 3: It is consistent only with a rare or poorly understood phenomena.
x = 6: It is not consistent with any known natural or anthropogenic phenomena (but unknown natural/anthropogenic phenomena could still be the cause).
x = 8: Only extraterrestrial, artificial explanations make sense (i.e. those requiring non-human design and engineering, for instance: a Dyson sphere, a narrow band carrier wave from an extraterrestrial source, a strictly periodic pulsed laser; in other words: all natural and anthropogenic explanations been ruled out).
x = 9: The phenomenon contains information content of clearly intelligent design (i.e. it contains a message; or is an obviously artificial and alien artefact available for close – perhaps robotic – inspection).
C = C + x.
Examples of anthropogenic signals: terrestrial RFI for radio observations, terrestrial laser communications, experimental aircraft for well-documented UFO sightings.
Computing J
Now, calculate:
J = A + B + C−20.
δ = 10(J–10)/2.
Interpreting Rio scores
Interpreting Q
If the signal is truly due to aliens, then the following scheme illustrates the consequence of the discovery:
Q = 10: Revolutionary. Everyday life on the Earth will change forever.
Q = 8–9: The making of an epoch; the future direction of humanity is changed.
Q = 6–7: SETI becomes the ‘study of ETI’. There are good prospects for near-future, limited understanding of ETI.
Q = 4–5: Scientifically revolutionary, but of no everyday consequence. Prospects for understanding ETIs remain decades in the future.
Q = 0–3: Philosophically ground-breaking, but of limited immediate social or scientific impact. The prospects for understanding ETIs remain unclear.
Interpreting J
The value of J gives reporters a scale on which to compare previous claims of signals or detections to new ones with enough dynamic range to distinguish, say, the Wow! signal, the SDSS lasers, sincere UFO claims and outright hoaxes. The scale is:
J < 1: No interest warranted.
J = 1–4: SETI interest potentially warranted; no press interest warranted.
J = 5–6: SETI interest probably warranted; technical popular press interest potentially warranted.
J = 7–8: SETI interest definitely warranted; technical popular press interest probably warranted; possible off-beat news item for general press, if expressed with appropriate caveats. If not aliens, still very interesting.
J = 9: Significant mainstream press interest warranted, heavy coverage by technical popular press. Broad agreement that the signal could be due to aliens.
J = 10: Aliens. Front page of every major newspaper.
Interpreting R
We retain the description of R from Rio 1.1:
R = 10: Extraordinary.
R = 9: Outstanding.
R = 8: Far-reaching.
R = 7: High.
R = 6: Noteworthy.
R = 5: Intermediate.
R = 4: Moderate.
R = 3: Minor.
R = 2: Low.
R = 1: Insignificant.
R = 0: Nil.
Distribution of scores
It is instructive to consider the range of possible scores produced by the new calculator, as was done by Almár and Tarter (Reference Almár and Tarter2000, Reference Almár and Tarter2011) for Rio 1.0/1.1. Figure 2 shows the distribution of possible Q values in the Rio 2.0 scheme. Q delivers values in the range 0–10, with 5 being the median value (the mean is 4.76). Rather than the symmetric Gaussian distribution of Q seen for Rio 1.0/1.1, Q is slightly skewed towards lower values.
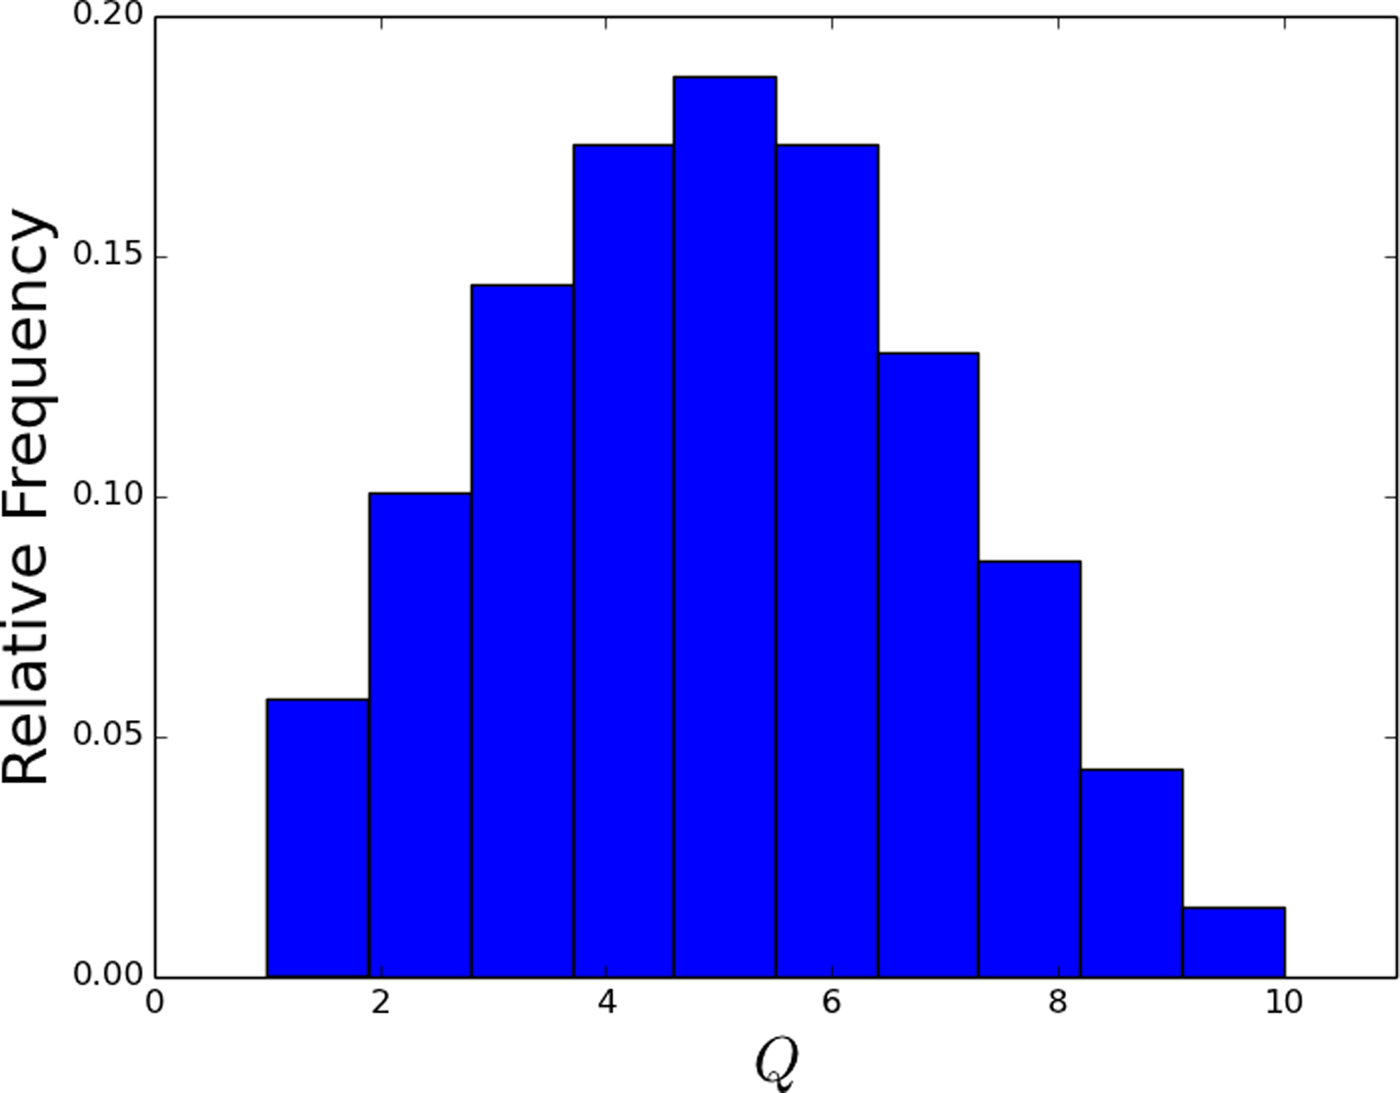
Fig. 2. The distribution of all possible Q scores in the Rio 2.0 scheme.
Almár and Tarter (Reference Almár and Tarter2000, Reference Almár and Tarter2011) did not calculate a δ distribution, although it seems immediately clear that the new distribution is quite different (Figs. 3 and 4). The vast majority of answers to the J questionnaire yield J = 0, with a sparse distribution of scoring towards the maximum of 10. This is principally due to some of the ‘deal-breaker’ questions regarding instrumental effects and hoaxes. Consequently, the distribution for δ also tends towards low values (with a median of 10−5 and mean of 0.0016), as a result of the log-scaling of J, which discriminates finely among signals of low probability of being artificial.

Fig. 3. The distribution of J scores in the Rio 2.0 scheme.
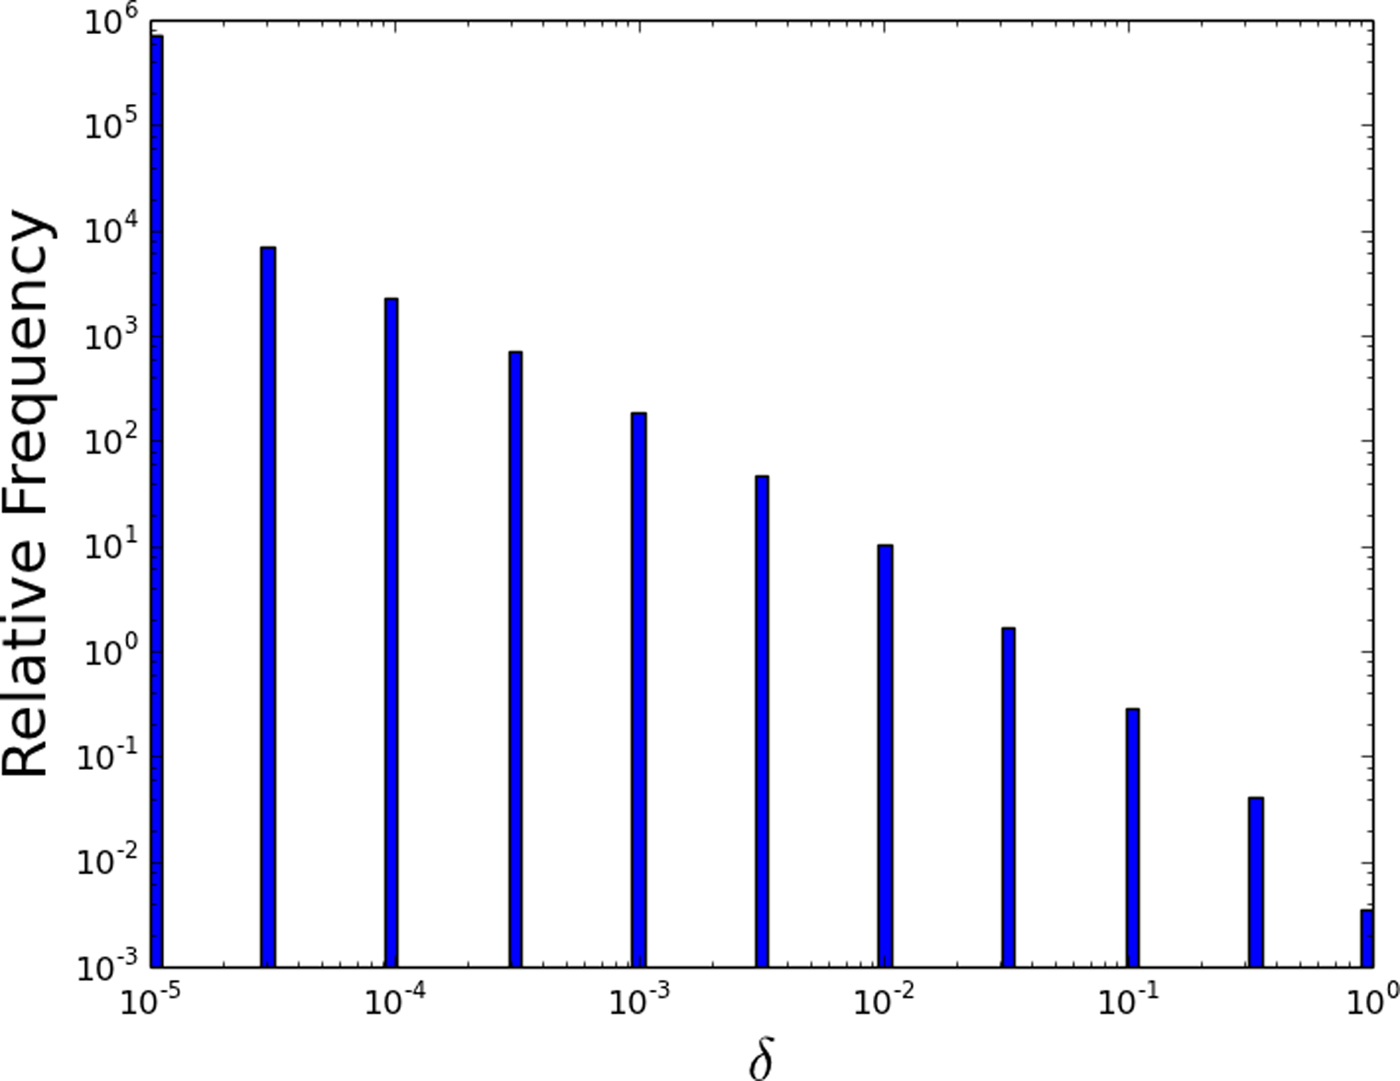
Fig. 4. The distribution of δ scores in the Rio 2.0 scheme.
Figure 5 shows the resulting distribution of R, given all possible permutations of Q and δ. The credibility variable heavily weights the scale towards 0. Indeed, the median is around 5 × 10⁻⁵ (the mean is approximately 0.007).
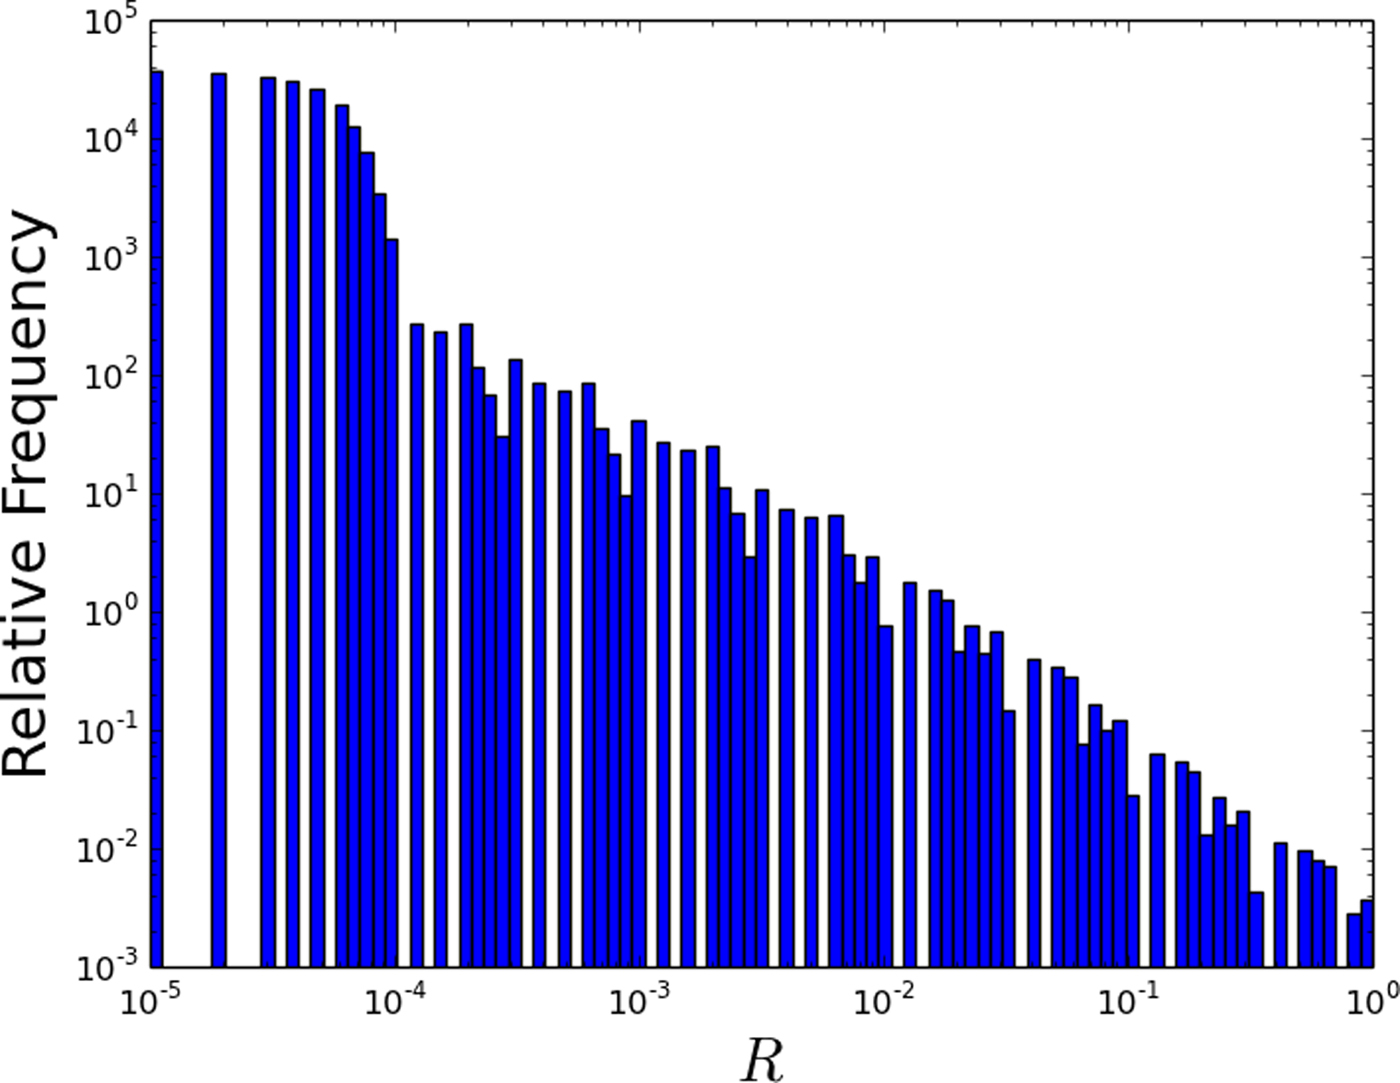
Fig. 5. The distribution of Rio scores in the Rio 2.0 scheme.
Good practice for using Rio 2.0
Using Rio 2.0 to evaluate signals
We intend for Rio 2.0 to be applied by any scientist (and the public if it wishes) to any signal, either their own signal or that of another team. The Rio score of a signal should be updated as new information or analysis arrives. Ideally, when a team publishes a Rio score, it should also publish the answers to its questionnaire, provide a brief explanation as to what factors contributed to the signal receiving this score and invite the public to attempt their own Rio scores.
We also advocate that all three parameters (Q, J, δ, R) be published. A signal with low Q but high δ may not result in extremely high-impact political events, such as discussions of whether to transmit a response, or the sharing of knowledge from an extraterrestrial culture. That does not mean it is not of high philosophical and cultural interest. Any SETI signal with high δ will mark a watershed between two scientific epochs, regardless of its Q.
Broadly speaking, once a speculative signal is detected, there are two possible futures. In the first, the signal may progress up the sequence towards an unverified or verified signal and achieve a small non-zero Rio score. New information may then come to light that reduces δ, potentially even ruling out the signal as a SETI candidate, and the Rio score becomes either very low or zero. This in fact is the typical outcome of all past SETI signals, from pulsars to Boyajian's star (Boyajian et al., Reference Boyajian, LaCourse, Rappaport, Fabrycky, Fischer, Gandolfi, Kennedy, Korhonen, Liu, Moor, Olah, Vida, Wyatt, Best, Brewer, Ciesla, Csák, Deeg, Dupuy, Handler, Heng, Howell, Ishikawa, Kovács, Kozakis, Kriskovics, Lehtinen, Lintott, Lynn, Nespral, Nikbakhsh, Schawinski, Schmitt, Smith, Szabo, Szabo, Viuho, Wang, Weiksnar, Bosch, Connors, Goodman, Green, Hoekstra, Jebson, Jek, Omohundro, Schwengeler and Szewczyk2016).
If this occurs, it is important that the team that is analysing the signal make a clear announcement to the media (via various forms of communication), of their signal's current status.
What if a signal defies refutation and attains the status of ‘candidate signal’? Multiple groups should continue to assign Rio scores as more data are collected. A large collection of Rio scores gives the public a useful barometer for measuring the degree of consensus in the community's opinion of a signal, especially if that opinion is deeply divided.
The following principles should be adopted by SETI scientists using Rio:
(i) Score a signal immediately.
(ii) Score it repeatedly, as new data arrive.
(iii) Have it scored independently, by experts not participating in the observations.
Ideally, press releases announcing the signals of a possible alien origin will include:
(i) The team's Rio score.
(ii) At least one Rio score from an independent team.
We would encourage science journalists where possible to compute their own score based on the available data. When the public read an article about SETI signals, they should check whether a Rio score is computed and ascribe more credence to stories that have multiple Rio scores from inside and outside the collaboration responsible for the signal. We would also encourage the public where possible to compute their own scores, to learn about the verification process for SETI signals and to see how their scores align with others available for a given news item.
Evaluating the effectiveness of Rio 2.0
Despite our best efforts to build an objective Rio scale, it is clear that there will always remain a subjective element to any attempt to determine a SETI signal's ‘significance’.
In the past, Rio 1.1's objectivity has been evaluated by considering scores for fictional scenarios (Shostak and Almár, Reference Shostak and Almár2002). The authors validated Rio 2.0 in a similar fashion, computing (Q, J, δ, R) for several fictional signal scenarios, with the resulting scores in a relative good agreement. This of course is not particularly surprising, as the authors have all contributed to the scale's production.
The full calibration of Rio 2.0 represents a ‘chicken-and-egg’ problem. To calibrate the scale, it must be widely used by the community to find the areas of subjectivity and disagreement. To be widely used, it must be reasonably calibrated. We therefore have decided to take an adaptive approach. We deliberately label this scale ‘Rio 2.0’, as we expect that the scale (and questionnaires to deliver values) will continue to evolve as the science of SETI continues to evolve.
Hence, we recommend that Rio 2.0 be revisited after an appropriate time interval and a reasonable amount of use by all interested parties. It should then be evaluated for:
(a) Its level of use by SETI practitioners and the media.
(b) Its ability to deliver an objective score for test examples.
To achieve this, we recommend collecting test score data from users on a set of well-defined fictional examples, as well as survey data regarding the scale's efficacy. For each fictional example, the distribution of scores for each parameter (Q, J, δ, R) should be interrogated, in particular the sample mean and standard deviation, as well as the general distribution shape. Combined with a qualitative analysis of reviews/comments from survey respondents, this should provide sufficient calibration data for the next-generation Rio scale.
Summary
We have revisited the Rio scale, a numerical tool used by SETI scientists to inform the public of the level of attention or excitement a SETI signal merits. Since Rio was first established 17 years ago, it has seen steady use by limited sections of the SETI community and has a respectable (if limited) media profile.
The last 17 years have seen a significant increase in the number of groups active in SETI, coupled with an explosion in the production of media for public consumption. Stories about SETI are eagerly converted into newspaper articles, blogs and videos, in many notable cases without due diligence being paid to the credibility of the signal.
Our revision of Rio (Rio 2.0) aims to quickly calibrate the public expectations of a reported signal and to educate them as to how SETI scientists evaluate a signal, from its initial detection through the various verification stages needed to determine if a signal is credibly from ETI.
This article details questionnaires for the two parameters that construct the scale, Q and δ. We have also provided a consistent set of terminology for the SETI community to use when discussing signals, so that the public understands clearly what has been observed, and what level of verification a signal has received.
As the science of SETI evolves, we expect the make-up of the Rio scale to also evolve– we therefore recommend that the scale's use and efficacy be reviewed on an ongoing basis to ensure that Rio remains a highly regarded objective, widely used tool for communicating with the public regarding SETI signals.
A browser-based version of the questionnaire is available at https://dh4gan.github.io/rioscale2, with the source code published on GithubFootnote 3. We have run every possible iteration of each questionnaire and collated the results to determine the distribution of values for Q, δ and R. The majority of questionnaire responses rightly result in a score of R = 0, reminding us that extraordinary claims require extraordinary evidence.
Acknowledgements
DHF gratefully acknowledges support from the ECOGAL project, grant agreement 291227, funded by the European Research Council under ERC-2011-ADG. The authors thank Kathryn Denning for stimulating discussions. The Center for Exoplanets and Habitable Worlds is supported by the Pennsylvania State University, the Eberly College of Science, and the Pennsylvania Space Grant Consortium. This research has made use of NASA's Astrophysics Data System Bibliographic Services. Breakthrough Listen is managed by the Breakthrough Initiatives, sponsored by the Breakthrough Prize FoundationFootnote 4.


