


1. Introduction
In the deep oceans much sediment is transported by turbidity currents, which are mixtures of sediment and water that flow downslope, driven by gravity (Kuenen, Reference Kuenen1937; Lowe, Reference Lowe1982; Altinakar et al. Reference Altinakar, Graf and Hopfinger1996; Meiburg & Kneller, Reference Meiburg and Kneller2010). Turbidity currents flow through and create deep-water sediment routing systems that distribute clastic sediments, nutrients, and organic carbon, but also man-made pollutants like microplastics across the continental slope and ocean floor (Galy et al. Reference Galy, France-Lanord, Beyssac, Faure, Kudrass and Palhol2007; Mutti et al. Reference Mutti, Bernoulli, Lucchi and Tinterri2009; Pohl et al. Reference Pohl, Eggenhuisen, Kane and Clare2020 b). These sediment routing systems are composed of different subsystems, which facilitate the transport or deposition of sediment (Mutti et al. Reference Mutti, Bernoulli, Lucchi and Tinterri2009; Breien et al. Reference Breien, De Blasio, Elverhoi, Nystuen and Harbitz2010; Talling et al. Reference Talling, Allin, Armitage, Arnott, Cartigny, Clare, Felletti, Covault, Girardclos, Hansen, Hill, Hiscott, Hogg, Hughes Clarke, Jobe, Malgesini and Mozzato2015; Hessler & Fildani, Reference Hessler and Fildani2019). For instance, submarine canyons and channels facilitate sediment transport and bypass of turbidity currents (Fildani et al. Reference Fildani, Hubbard, Covault, Maier, Romans, Traer and Rowland2013; Stevenson et al. Reference Stevenson, Jackson, Hodgson, Hubbard and Eggenhuisen2015), while farther downstream deep-sea fans represent depositional systems where turbidity currents deposit sediment (Normark, Reference Normark1970; Prélat et al. Reference Prélat, Hodgson and Flint2009; Stacey et al. Reference Stacey, Hill, Talling, Enkin, Hughes Clarke and Lintern2018). In the transition zone between channels and lobes, turbidity currents transform from a net bypassing to a net depositional behaviour. This transformation is commonly associated with a complex zone of erosional and depositional morphologies, often referred to as the channel–lobe transition zone (CLTZ) (Mutti & Normark, Reference Mutti, Normark, Leggett and Zuffa1987; Wynn et al. Reference Wynn, Kenyon, Masson, Stow and Weaver2002; Ito et al. Reference Ito, Ishikawa and Nishida2014; Hofstra et al. Reference Hofstra, Hodgson, Peakall and Flint2015; Brooks et al. Reference Brooks, Hodgson, Brunt, Peakall, Hofstra and Flint2018 a; Pohl et al. Reference Pohl, Eggenhuisen, Tilston and Cartigny2019). CLTZs may represent a potential trapping mechanism for hydrocarbons which might be stored in the sandy lobe deposits farther downstream (Amy, Reference Amy2019). Thus, understanding of the flow processes and associated structures in CLTZs could help to better assess potential hydrocarbon reservoirs.
The CLTZ was originally defined as the area separating well-defined channels from well-defined lobes and is usually characterized by erosion and sediment bypass (Mutti & Normark, Reference Mutti, Normark, Leggett and Zuffa1987). Bathymetric studies on modern CLTZs on the ocean floor have revealed that these zones can extend for >tens of kilometres, comprising scour fields with individual scours hundreds of metres long and tens of metres deep (Kenyon & Millington, Reference Kenyon, Millington, Pickering, Hiscott, Kenyon, Ricci Lucchi and Smith1995; Palanques et al. Reference Palanques, Kenyon, Alonso and Limonov1996; Wynn et al. Reference Wynn, Kenyon, Masson, Stow and Weaver2002; Macdonald et al. Reference Macdonald, Wynn, Huvenne, Peakall, Masson, Weaver and McPhail2011; Carvajal et al. Reference Carvajal, Paull, Caress, Fildani, Lundsten, Anderson, Maier, McGann, Gwiazda and Herguera2017; Maier et al. Reference Maier, Paull, Caress, Anderson, Nieminski, Lundsten, Erwin, Gwiazda and Fildani2020). These types of studies reveal the seabed bathymetry on a metre scale and only allow identification of sediment types and detailed sedimentary structures if they are coupled with sediment coring and/or subsurface seismic-reflection profiles. In contrast, outcrop studies or data from sediment cores can provide detail on small-scale sedimentary structures, but often lack a larger palaeogeographical context. In this paper a detailed multiscale analysis of sedimentary structures and stratigraphic architectures in a documented CLTZ is linked to the net erosive or net depositional behaviour of the turbidity currents that formed these features.
A previously recognized Permian CLTZ in the Karoo Basin, South Africa, reveals erosive patterns in a bypass zone and deposits of an associated lobe complex farther downstream (here referred to as the deposition zone: van der Merwe et al. Reference van der Merwe, Hodgson, Brunt and Flint2014; Brooks et al. Reference Brooks, Hodgson, Brunt, Peakall, Hofstra and Flint2018 a). The dominant morphological feature controlling the transition from bypass to deposition was interpreted to have been a slope break (Brooks et al. Reference Brooks, Hodgson, Brunt, Peakall, Hofstra and Flint2018 a), an interpretation that is based on extensive and detailed regional datasets (Hodgson, Reference Hodgson2009; Figueiredo et al. Reference Figueiredo, Hodgson, Flint and Kavanagh2010, Reference Figueiredo, Hodgson, Flint and Kavanagh2013; van der Merwe et al. Reference van der Merwe, Flint and Hodgson2010, Reference van der Merwe, Hodgson, Brunt and Flint2014; Flint et al. Reference Flint, Hodgson, Sprague, Brunt, Van der Merwe, Figueiredo, Prélat, Box, Di Celma and Kavanagh2011; Hodgson et al. Reference Hodgson, Di Celma, Brunt and Flint2011; Spychala et al. Reference Spychala, Hodgson, Flint and Mountney2015). This body of literature provides an exceptional and independent control on the palaeogeographic interpretation of this exhumed CLTZ, which makes it the ideal study site of sediment types, sedimentary structures and architecture as indicators of turbidity current processes in CLTZs.
Objectives of this study are to: (1) document the characteristic sedimentary structures in the bypass zone on various scales; (2) develop a sediment facies scheme associated with the potential for erosion or deposition; and (3) analyse the palaeoflow distribution in the bypass and the deposition zone.
2. Geological setting
The Karoo Basin in South Africa is a retro-arc foreland basin that was active from the Late Carboniferous to the Early Jurassic (Smith, Reference Smith1990; Smith et al. Reference Smith, Eriksson and Botha1993; Visser & Praekelt, Reference Visser and Praekelt1996; Visser, Reference Visser1997; Catuneanu et al. Reference Catuneanu, Hancox and Rubidge1998; López Gamundí & Rossello, Reference López Gamundí and Rossello1998). It is filled with ∼5500 m thick sediments of the Karoo Supergroup (Tankard et al. Reference Tankard, Welsink, Aukes, Newton and Stettler2009; Flint et al. Reference Flint, Hodgson, Sprague, Brunt, Van der Merwe, Figueiredo, Prélat, Box, Di Celma and Kavanagh2011), and subdivided into the Dwyka, Ecca and Beaufort Groups (Fig. 1a; e.g. Smith, Reference Smith1990; HDV Wickens, unpub. PhD thesis, Univ. Port Elizabeth, 1994). This study focuses on the Permian Ecca Group, which comprises a shallowing-upward succession of deep-water to deltaic deposits, recording the eastward progradation of the basin margin (e.g. van der Merwe et al. Reference van der Merwe, Flint and Hodgson2010; Flint et al. Reference Flint, Hodgson, Sprague, Brunt, Van der Merwe, Figueiredo, Prélat, Box, Di Celma and Kavanagh2011). Provenance analysis of the predominantly fine-grained sandstones of the Ecca Group does not match the signature of the adjacent Cape Fold Belt (Fig. 1a), indicating no nearby source area (Johnson, Reference Johnson1991; Scott et al. Reference Scott, Bouma, Wickens, Bouma and Stone2000). Plausible source areas are Palaeozoic granite intrusions in the North Patagonian Massif, as suggested by age constraints and geochemical analyses that indicate a felsic igneous source area associated with an active continental-margin setting (B van Lente, unpub. PhD thesis, Univ. Stellenbosch, 2004; Fildani et al. Reference Fildani, Drinkwater, Weislogel, McHargue, Hodgson and Flint2007; Flint et al. Reference Flint, Hodgson, Sprague, Brunt, Van der Merwe, Figueiredo, Prélat, Box, Di Celma and Kavanagh2011; McKay et al. Reference McKay, Weislogel, Jackson, Dean and Fildani2018).

Fig. 1. (a) Location map of the Laingsburg depocentre within the Western Cape (South Africa). Indicated are the main stratigraphic subunits of the Karoo Supergroup. The study area is marked with a black box and shown in Figure 2a. Modified from Flint et al. (Reference Flint, Hodgson, Sprague, Brunt, Van der Merwe, Figueiredo, Prélat, Box, Di Celma and Kavanagh2011). (b) Lithostratigraphy of the Ecca Group in the Laingsburg depocentre. This study focuses on Units E2 and E3 of the Fort Brown Formation. From HDV Wickens, unpub. PhD thesis, Univ. Port Elizabeth, 1994, and Figueiredo et al. (Reference Figueiredo, Hodgson, Flint and Kavanagh2013). FM: Formation.
The Ecca Group is up to 1300 m thick (van der Merwe et al. Reference van der Merwe, Hodgson and Flint2009, Reference van der Merwe, Flint and Hodgson2010 Reference van der Merwe, Hodgson and Flint2011) and subdivided into seven formations (Fig. 1b; HDV Wickens, unpub. PhD thesis, Univ. Port Elizabeth, 1994). The upper part comprises the Laingsburg, Fort Brown and Waterford Formations, which are interpreted as sand-prone basin-floor deposits (van der Merwe et al. Reference van der Merwe, Flint and Hodgson2010), channelized submarine slope deposits (Di Celma et al. Reference Di Celma, Brunt, Hodgson, Flint and Kavanagh2011; Flint et al. Reference Flint, Hodgson, Sprague, Brunt, Van der Merwe, Figueiredo, Prélat, Box, Di Celma and Kavanagh2011; Hodgson et al. Reference Hodgson, Di Celma, Brunt and Flint2011) and shelf-edge and shelf-top deltas (Jones et al. Reference Jones, Hodgson and Flint2015; Poyatos-Moré et al. Reference Poyatos-Moré, Jones, Brunt, Hodgson, Wild and Flint2016). The focus of this study is on the Fort Brown Formation (Fig. 1b).
The deposits of the Fort Brown Formation are characterized, from east to west, by slope valleys, channel–levee systems, intraslope lobe complexes and basin-floor lobe complexes over a distance of 80–100 km (Figueiredo et al. Reference Figueiredo, Hodgson, Flint and Kavanagh2010, Reference Figueiredo, Hodgson, Flint and Kavanagh2013; Di Celma et al. Reference Di Celma, Brunt, Hodgson, Flint and Kavanagh2011; Spychala et al. Reference Spychala, Hodgson, Flint and Mountney2015; Brooks et al. Reference Brooks, Hodgson, Brunt, Peakall, Hofstra and Flint2018 a, b). The slope gradient of the Karoo Basin margin is estimated to have been <0.7° based on reconstructions of the clinoforms in the Waterford Formation (Poyatos-Moré et al. Reference Poyatos-Moré, Jones, Brunt, Hodgson, Wild and Flint2016). Early research estimated a water depth during deposition of the Fort Brown Formation of <500 m, mainly based on trace fossils (Visser & Loock, Reference Visser and Loock1978). A more recent study, however, estimates the water depth to have been c. 1800 m, based on the uncompacted thickness of the succession from basin-floor fans to the first delta deposits (Flint et al. Reference Flint, Hodgson, Sprague, Brunt, Van der Merwe, Figueiredo, Prélat, Box, Di Celma and Kavanagh2011). Following the strike dip of the palaeoslope reconstructed by Brooks et al. (Reference Brooks, Hodgson, Brunt, Peakall, Poyatos-Moré and Flint2018 b), deepening direction was towards E.
The Fort Brown Formation is subdivided into five units (C, D, E, F and G), each of which is interpreted to represent a low-stand sequence set (Flint et al. Reference Flint, Hodgson, Sprague, Brunt, Van der Merwe, Figueiredo, Prélat, Box, Di Celma and Kavanagh2011). The focus of this study is Unit E, which is 40–100 m thick and divided into three cycles (E1, E2 and E3; Fig. 1b). The lowermost unit E1 is only exposed in the northwestern part of the Laingsburg depocentre and interpreted as a set of intra-slope lobes (Spychala et al. Reference Spychala, Hodgson, Flint and Mountney2015). Units E2 and E3 comprise tabular, sand-rich bodies, with multiple regional transitions between bypass and deposition and vice versa. The latest interpretation indicates that these transitions between bypass and deposition were controlled by a ramp–step slope geometry, with ∼20 km long ramps and steps (van der Merwe et al. Reference van der Merwe, Hodgson, Brunt and Flint2014; Brooks et al. Reference Brooks, Hodgson, Brunt, Peakall, Hofstra and Flint2018 a, b). This interpretation is based on the exceptional control of the regional palaeogeography due to previous studies and the identification of intra-slope lobes (e.g. Figueiredo et al. Reference Figueiredo, Hodgson, Flint and Kavanagh2010; Spychala et al. Reference Spychala, Hodgson, Flint and Mountney2015), showing characteristic features of stepped slope profiles similar to the Niger Delta Slope (Prather et al. Reference Prather, Pirmez, Sylvester, Prather, Prather, Deptuck, Mohrig, van Hoorn and Wynn2012; Jobe et al. Reference Jobe, Sylvester, Howes, Pirmez, Parker, Cantelli, Smith, Wolinsky, O’Byrne, Slowey and Prather2017) and the northern margin of the Gulf of Mexico (Prather et al. Reference Prather, Booth, Steffens and Craig1998, Reference Prather, Pirmez, Sylvester, Prather, Prather, Deptuck, Mohrig, van Hoorn and Wynn2012, Reference Prather, O’Byrne, Pirmez and Sylvester2017). The lower bypass zone on the stepped slope, and its downstream transition into a thick composite sandstone body, are exposed in the Slagtersfontein outcrop. Here, the transition from bypass to deposition takes place over a downstream distance of ∼600 m, and is characterized by an increase in thickness from a few metres to ∼40 m (Brooks et al. Reference Brooks, Hodgson, Brunt, Peakall, Hofstra and Flint2018 a), an average thickening rate of 0.06 m m−1. This zone is interpreted as a CLTZ with associated lobe deposits related to a slope break (Brooks et al. Reference Brooks, Hodgson, Brunt, Peakall, Hofstra and Flint2018 a).
3. Methodology and dataset
3.a. The Slagtersfontein outcrop area
Forty sedimentary logs measured on a centimetre scale were collected along a 5.6 km long transect through Unit E in the Slagtersfontein outcrop area (Fig 2a, b). The spacing between individual logs was mainly controlled by the availability of high-quality outcrops in gullies. The position of the base of Unit E was measured with a handheld GPS using a built-in waypoint averaging function that considers errors due to satellite orbit geometry, resulting in a horizontal accuracy of ±2.5 m. The bed-normal distance from the base of Unit E to the underlying Unit D was measured with a 50 m long measuring tape. A correlation panel was constructed, revealing the sedimentary architecture of Unit E in palaeoflow direction (Fig. 2c). The datum level for the correlation panel is the top of the underlying Unit D. This datum was chosen because of minor thickness variations in the study area documented for Unit D (van der Merwe et al. Reference van der Merwe, Hodgson, Brunt and Flint2014; Hodgson et al. Reference Hodgson, Kane, Flint, Brunt and Ortiz-Karpf2016).

Fig. 2. (a) Satellite photograph showing part of the Laingsburg outcrop area. See Figure 1 for location. (b) Satellite photograph of the Slagtersfontein outcrop area including the locations of the sedimentary logs. Images taken from Google Earth. See Figure 1a for location. (c) Correlation panel of the collected sedimentary logs of Unit E and the thickness to the underlying Unit D. The correlation panel is parallel to the palaeoflow direction. A zone characterized by thin deposits gradually passes, over a downstream distance of ∼600 m, into a zone marked by thicker deposits.
Based on the deposit thickness the outcrop complex is subdivided into two areas. The first comprises the proximal ∼2 km of the studied outcrop, is marked by an overall unit thickness of 0 m to ∼5 m and is termed the bypass zone (Fig. 2c). The second area is referred to as the deposition zone, with thicknesses of up to ∼40 m, and is located downstream of the bypass zone (Fig. 2c).
Sedimentary structures up to a scale of several metres were documented with photographic mosaics and detailed sketches. Prior to this, the outcrop was cleaned with a broom to expose detailed structures. A measurement tape was used to ensure geometric accuracy of the sketches.
Only unequivocal and precise flow indicators such as groove and flute marks were measured to reconstruct the palaeoflow directions. The bedding of Unit E in the Slagtersfontein outcrop area is sub-vertical, and the measured palaeoflow directions were corrected for the local bed dip using stereographic projection, and plotted in equal-area rose diagrams (Nemec, Reference Nemec1988; Baas, Reference Baas2000). Statistical analysis yields the frequency distribution, the mean palaeoflow vector M and the circular standard deviation S B (Baas, Reference Baas2000). Palaeoflow results show that the logs are aligned parallel to the palaeoflow direction in the bypass zone and the proximal depositional zone (ENE; ∼70°), which allows the investigation of variations in the deposits along the downflow trajectory.
3.b. Sampling and thin-section grain-size analysis
Some of the sediment beds have been selected for detailed grain-size distribution analysis. Sediment beds were selected for sampling based on field relations (e.g. Injectites together with the overlying sandstone) or simply for practical reasons such as suitability for sampling in the field. A total of 44 samples were taken c. 3–5 cm above the base of these beds, using either a geological hammer or a drill. The three-dimensional orientation of each sample was documented in the field. From these samples, 30 µm thick thin-sections were prepared, which were oriented perpendicular to the bedding and parallel to the mean palaeoflow direction. Of each thin-section an area of >1 cm2 (1.27 × 0.95 cm) was photographed using an optical microscope (Leica DM6000 B). Photographs were taken in plane-polarized light with a magnification of 20×. The microscope was equipped with an automated stage to generate a stitched image with a resolution of 13,584 × 10 088 pixels, resulting in a resolution of 1.08 µm per pixel.
The thin-section images were overlain by a grid with a mesh width of 400 µm. The grains that were crossed by a line intersection of the grid were manually outlined using a drawing tablet (Wacom Cintiq 13HD) and the image analysis software ImageJ (Version 1.52a). Preliminary tests revealed that a minimum of 300 grains were needed to obtain a grain-size distribution that was not biased by the number of measured grains. A grain-size distribution obtained from a thin-section is always biased toward a finer grain-size because the centre of an individual grain is rarely located at the intersection of the thin-section surface with that grain. This bias was corrected using the method from Johnson (Reference Johnson1994):
 $$D' = d' + 0.4{(a' - d')^2},$$
where D′ is the corrected grain size and d′ is equal to (a′b′)1/2; with a′ and b′ as the measured long and short axes from the outlined grains. The obtained grain-size distributions were statistically evaluated with standard methods to calculate the sorting (e.g. Boggs, Reference Boggs and Boggs2009).
4. Results
4.a. Sedimentary facies and structures
The sediments of Unit E in the outcrop complex comprise mainly sandstones, siltstones and mudclast breccias. Sixteen sedimentary facies have been recognized on the basis of lithology, grain size, texture and sedimentary structures (see Figs 3 and 4). These sedimentary facies and structures are interpreted and classified with regard to the erosive/depositional tendency of the parent turbidity currents at the time of their formation. Facies descriptions and interpretations are provided in Table 1.

Fig. 3. (a) Thin-bedded mudstones. (b) Tabular thin-beds. (c) Slumped units. (d) Sandstones with loaded bed-bases. (e) Hybrid beds. (f) Structureless sandstone. (g) Convoluted beds. (h) Climbing-ripple cross-laminated sandstone.

Fig. 4. (a) Ripple-laminated sandstone. (b) Laminated sandstone. (c) Sandstone with flute marks. (d) Lensoid packages. (e) Filled dish-shaped scours. (f) Amalgamated beds with mud-clast horizons. (g) Injectites. (h) Mudclast breccia.
Table 1. Description and interpretations of the 16 sediment facies.

4.b. Sedimentary facies ranking scheme
Here, we organize the sedimentary facies by the erosive or depositional tendency of the turbidity currents from each of the facies. This approach contrasts with the conventional grouping in facies associations, groups of co-occurring facies in outcrops. The suite of physical, biological and chemical processes that can be interpreted from the facies association can then lead to an interpretation of the depositional environment in which it was formed. An example for the application of this type of facies scheme to the present outcrops can be found in Brooks et al. (Reference Brooks, Hodgson, Brunt, Peakall, Hofstra and Flint2018 a). Here, the facies are ranked according to the erosional or depositional tendency of the parent turbidity currents (Fig. 5). Sedimentary facies that were not related to flow processes and predominantly related to background sedimentation or distal turbidity currents are not included in this facies ranking. The remaining 13 facies were sorted into six groups and colour-coded according to the erosion strength or depositional tendency of the flows that created them (Fig. 5). This colour scheme is used in later panels to illustrate the facies distribution, and hence the turbidity-current behaviour.

Fig. 5. Facies ranking according to the erosion strength or depositional tendency of the flows.
4.c. Bed-scale structures in the bypass zone
Bed-scale structures in the bypass zone are characterized by deformed sediment beds, rip-up of the seabed and chaotic deposition. Figure 6 shows a deformed sandstone bed (F6) with folded mudstones (F1 and F2) underneath. In other locations erosive surfaces cut down into the underlying sediments, forming troughs and irregularities on the ocean floor, filled with a chaotic mixture of ripped sandstone beds (F6, F11 and F14) and mudclast breccias (F16) (Fig. 7a, b).

Fig. 6. Deformed interval within the deposits of the bypass zone. The lower one of the two sandstones shows an irregular and erosive top. On top of that erosion surface lies a deformed muddy interval with a discontinuous sandstone on top. See Figure 2 for location.

Fig. 7. (a) Surfaces that are cutting down into the underlying sand deposit of previous flows. (b) An erosive surface forming a trough filled with a chaotic mixture of sandstone beds and mudclast breccia. See Figure 2 for location.
4.c.1. Interpretation
The bed-scale structures in the bypass zone are dominantly related to erosion and sediment bypass, suggesting mainly erosive turbidity currents in that zone. These flows are intercalated with the fine hemipelagic deposits deforming and eroding previous deposits and cause rip-ups of the seabed (Figs 6 and 7). The rip-up structures represent bed defects which may have led to the establishment of large-scale scours. The overturned sandstone bed was likely eroded further upstream, dragged and overturned by the flow and deposited at this location (Fig. 6). Comparable deformation structures (i.e. folded beds) have been described in sediment beds underneath mass-transport complexes (Ogata et al. Reference Ogata, Mutti, Pini and Tinterri2012). Alternatively, the sandstone beds might have been deformed by slide events caused by restricted collapses that were probably related to local oversteepening of the bed slope.
4.d. Large-scale sedimentary structures and architecture
4.d.1. Incision in the bypass zone
In the bypass zone the sediment of Unit E fills a ∼2 m deep incision into the underlying mudstone (F1) over a downstream distance of ∼25 m (Fig. 8). The incision is filled with massive mostly structureless sand (F6, F9, F10) with floating mudclasts (F14). The contact of this sandstone with the underlying mudstone is sharp and undular and interpreted as an erosive surface. The sandstone is draped by a ∼10 cm thick mudclast breccia (F16; Fig. 8). The mudstone below the incision is affected by injected sand (F15; Fig. 8). Injectites are also present up- and downstream of the scour. The massive sandstone filling the incision is overlain by a sandstone (F7 and F8) with large-scale backsets that are up to ∼1.5 m thick (Fig. 8). Downstream of these backsets, beds are wavy with a wavelength of ∼3 m to 5 m and a wave-amplitude of ∼1 m. Both the backsets and the wavy beds are truncated by a continuous major erosion surface producing an undular contact that is overlain by a mudclast breccia (F16).

Fig. 8. Incision in the bypass zone (see Fig. 2 for location). The incision is ∼2 m deep and ∼25 m long and cuts into the underlying hemipelagic mud. The erosive horizon at the base of Unit E is marked by injectites. The incision is filled with structureless sandstone with floating mudclasts. Large-scale backsets and wavy beds are on top of the sandstone filling the incision. Sample positions for grain-size analysis are indicated with red dots.
Differences in grain-size distribution between the injectites and the overlying sandstone do unravel their correlation. The grain size of the injected sand is c. 40 µm coarser than the overlying sandstone at the same location, suggesting no link of the injected sand to the sand that was deposited on top of it (Fig. 8). The injected sand underneath and downstream of the incision is slightly coarser-grained than the injectite upstream of the incision. The sandstone filling the incision has a similar grain size to the sandstone forming the backsets and the wavy beds, with the difference that the grain-size distribution of the incision infill is slightly coarse-tailed. The sandstone upstream of the incision shows a slight shift toward a finer grain-size distribution (see blue grain-size distribution curve in Fig. 8).
4.d.2. Thinning of the mudstone package underneath Unit E
The hemipelagic mudstones (F1) that separate the sandstones of Unit E from the underlying sandstones of Unit D shows an average thickness ranging from ∼35 m to ∼50 m (Figs 2c, 9a). However, the thickness of the mudstone package is reduced to a minimum of ∼20 m at the end of the bypass zone. Thickness decreases over a downstream distance of ∼150 m to its minimum and increases to its normal thickness of ∼43 m over a downstream distance of ∼350 m, resulting in an asymmetric trough shape with a length of ∼500 m and a depth of ∼25 m (Fig. 9a). This asymmetric trough shape was also captured by the GPS points and is noticeable as an offset of the base of Unit E from its general stratigraphic level (Fig. 10). By contrast, the satellite images show a continuous, straight stratigraphic level for the sandstones of the underlying Unit D along the entire length of the outcrop (Fig. 10).

Fig. 9. (a) Correlation panel of the zone with thin mudstones, with sampling locations indicated (see Fig. 2 for location). (b) Grain-size distribution of the sediment at the location indicated in the correlation panel. The average grain-size distribution of all samples taken in that location is displayed. The grain-size distribution of the individual samples is shown in Figure 11.

Fig. 10. GPS-points captured at the base of Unit E of each measured section. View toward the east. Noticeable in the GPS data is an offset from the general stratigraphic level of Unit E, while the stratigraphic level of Unit D remains constant.
Upstream of the zone with the thin mudstone area, i.e. in the bypass zone, Unit E is less than 1 m thick and characterized by sedimentary facies indicating scouring and erosion such as mudclast breccia (F16) and injectites (F15) (Injectite in Fig. 9a). On top of the thin mudstone area, the deposits of Unit E are up to ∼8 m thick (zone with thin mudstones in Fig. 9a). At the base is an up to 4 m thick package of thin-bedded and fine-grained sandstones (F2) that are overlain by a structureless up to 3.5 m thick sandstone (F6). Farther downstream, the thickness of the deposits of Unit E increases to ∼12 m and the sediments are dominated by depositional sedimentary facies (i.e. F4–F10) (Deposition zone I in Fig. 9a).
Variations in deposit thickness and the sediment facies between the different zones are also reflected in the average grain-size distribution of the sediment beds (Fig. 9). Samples for grain-size analysis have been taken from injectites upstream, and from sediments at two locations downstream of the zone with thin mudstones (Figs 9a, b, 11). Grain-size measurements of the injectites upstream revealed a very fine to fine grain size with moderately good sorting (Figs 9b, 11). The sandy deposits on top of the thin mudstone are slightly finer than the upstream injectites and poorly sorted. The sediments deposited ∼0.6 km farther downstream of the zone with thin mudstones, i.e. in the deposition zone, were finer-grained with a poor sorting (Figs 9b, 11). The grain-size distribution ∼1.4 km downstream of the thin mudstone zone revealed a similar grain size in combination with a moderate sorting.

Fig. 11. Grain-size distributions of the samples obtained by image analysis from thin-sections. Sample locations are shown in Figure 9a. The grey lines mark the grain-size distribution of individual samples. The black line marks the average grain-size distribution of all individual samples at that location.
4.d.3. Transition from the bypass to deposition zone
The transition from bypass to deposition zone is marked by a thickness increase of the Unit E sediments from ∼5 m to ∼ 40 m over a downstream distance of ∼600 m (Fig. 2). The contact of the Unit E sediments with the underlying mudstones (F1) is generally non-erosive, with exceptions at some locations, where the base of Unit E is undular and the underlying mudstones are deformed (Fig. 12). The bed architecture shows that the beds in the lower part of Unit E are cut off by an erosive surface that is dipping upstream (Fig. 12). The erosive surface is draped by a mudclast breccia (F16), which is overlain by sandstone beds (F6) with an upward-thinning pattern. The sandstones overlying the mudclast breccia are thinning in the upstream direction. The sandstones at the top of Unit E are overlain by hemipelagic mudstones (F1).

Fig. 12. Sketch of the transition from the bypass zone to the deposition zone (see Fig. 2 for location). The beds in the lower part of Unit E are cut off and draped by a mudclast breccia, which is dipping upstream. Sandstone beds on top of the mudclast breccia are thinning upwards and laterally in the upstream direction.
4.e. Palaeoflow distribution
One hundred and eighty-four palaeoflow indicators were measured in the outcrop complex. For this study, only unequivocal and precise palaeoflow indicators (i.e. groove and flute marks; Fig. 4c) were used. Groove marks were found at the base of sediment beds from various sediment facies while flute marks were, by definition, only present in facies F11 – sandstone with flute marks. Palaeoflow measurements were divided into three populations based on their downstream location: the bypass zone, the proximal and the distal deposition zone (Figs 13, 14). The mean palaeoflow direction in the bypass zone and in the proximal deposition zone is toward the ENE (∼70°), and hence, the W–E correlation panel is oriented broadly parallel to the palaeoflow direction. Farther downstream, however, in the distal deposition zone, the mean palaeoflow direction has changed toward the NNE (Fig. 13). The circular standard deviation s B describes the variability of the measured vectors and thus the palaeoflow direction. The data show a higher variability in palaeoflow direction in the bypass zone than in the deposition zone (Fig. 13).

Fig. 13. Equal-area rose diagrams of the palaeoflow measurements in the outcrop complex. Palaeoflow directions in the distal deposition zone deviate from the direction in the proximal deposition zone and in the bypass zone (see Fig. 14 for location). Furthermore, the palaeoflow direction in the bypass zone shows a higher variability than the flows in the lobe. The grey sector describes the mean vector orientation (black line) and length (sector length), and the circular standard deviation (sector width). M: mean vector; R: Mean vector length; s B : Circular standard deviation; K: Vectorial concentration; d°: Confidence interval of the mean vector. Statistics and equal-area rose diagrams were calculated with EZ-ROSE (Baas, Reference Baas2000).

Fig. 14. Correlation panel of Unit E showing the measured sections and the dominant sedimentary facies in the colour scheme of Figure 5. Palaeoflow direction is from left (W) to right (E) and oriented broadly parallel with the alignment of the sections. The bypass zone is characterized by thinner deposits and erosive sedimentary facies. Further downstream the onset of deposition is recorded, reflected by a significant increase of deposit thickness and a deposition zone marked by thicker deposits and sedimentary facies that are indicative of fast deposition.
5. Discussion
The aim of this study is to identify sedimentary facies, sedimentary structures and stratigraphic architectures, which can help to identify CLTZs in datasets with limited palaeogeographical context. The CLTZ exposed in the Slagtersfontein outcrop area reveals a complex pattern of both erosive and depositional structures on various scales. This diversity of sedimentary structures makes it difficult to pinpoint a single feature to characterize zones of predominant erosion and sediment bypass. Here, we demonstrate how a process-based sediment facies scheme can be used to distinguish zones of bypass from zones of deposition solely by the distribution and frequency of sediment facies. In addition, a process-based reconstruction of the sedimentary structures and stratigraphic architectures shows how net erosional processes can result in complex patterns of erosional and depositional structures. Finally, the variability of the palaeoflow direction may also serve as a possible criterion to distinguish zones of bypass from zones of deposition.
5.a. Distribution of the sedimentary facies
The definition of sedimentary facies is a method which is commonly used to describe and interpret sedimentological datasets ranging from basin scale down to individual sediment cores (e.g. Anderton, Reference Anderton1985; Pickering et al. Reference Pickering, Watson, Stow and Hiscott1986; Reading, Reference Reading1996). Usually, individual sedimentary facies are defined on sedimentary features such as grain size, fabric and bed-internal structures, and associations of these sedimentary facies are then linked to a particular depositional environment (e.g. Brooks et al. Reference Brooks, Hodgson, Brunt, Peakall, Hofstra and Flint2018 a). Thus, environments dominated by deposition are linked to different facies associations than environments dominated by bypass and erosion. However, this relation may become obscure in environments marked by both erosive and depositional structures, which is common in areas marked by scours and seafloor erosion. As such, alternations of erosive and depositional facies have been recognized in sediment cores from the Navy Fan and the La Jolla Fan systems (Carvajal et al. Reference Carvajal, Paull, Caress, Fildani, Lundsten, Anderson, Maier, McGann, Gwiazda and Herguera2017; Maier et al. Reference Maier, Paull, Caress, Anderson, Nieminski, Lundsten, Erwin, Gwiazda and Fildani2020; Fildani et al. Reference Fildani, Kostic, Covault, Maier, Caress and Paull2021), as well as in studies on CLTZs in outcrops (Gardner et al. Reference Gardner, Borer, Melick, Mavilla, Dechesne and Wagerle2003; Pemberton et al. Reference Pemberton, Hubbard, Fildani, Romans and Stright2016; Navarro & Arnott, Reference Navarro and Arnott2020). In settings characterized by complex patterns of erosion and deposition, a distinct link of facies associations to this environment might be difficult and interpretation would benefit from a process-oriented facies classification approach like the one presented here (5).
For this study a sediment facies scheme was employed based on the erosional strength or depositional tendency of the flows. This facies scheme allows identification of zones of bypass or deposition not only based on the architecture of the outcrop complex (i.e. unit thickness; Fig. 2), but on the spatial distribution and frequency of certain sediment facies. The advantage of this approach is that it may allow zones of bypass or deposition in datasets with limited information to be identified. Figure 14 illustrates the spatial distribution of the sediment facies and, in consequence, the spatial distribution of erosive and depositional flows in the outcrop complex. The facies distribution in the bypass zone is marked by alternating erosive and depositional sedimentary facies. A high degree of spatial variability over short length scales turns out to be a defining characteristic of the studied CLTZ. This variability may even express strongly differencing erosive and depositional tendencies within single flow events, though the complexity prevents identification of event beds over the necessary distances to confirm this. The transition from bypass to deposition zone is characterized by a rapid thickness increase of Unit E from ∼5 m to ∼40 m over a distance of ∼600 m. This increase in thickness is accompanied by the transition from erosive to predominantly depositional facies (Fig. 14).
Various approaches to facies classification of turbidite deposits have been applied in literature previously. Many studies of specific stratigraphic successions have tailored classifications at specific deposits and research questions. Some have proven useful more generally, and these have gained broader use in literature. We will compare our facies approach to two notable schemes in use (Lowe, Reference Lowe1982; Mutti, Reference Mutti1992).
Mutti (Reference Mutti1992) devised a facies scheme containing nine facies. This classification scheme is organized along the interpreted flow-rheology and sedimentary process of the parent flows. F1–F9 cover deposit types formed by the entire breadth of gravity flow processes from cohesive debris flows to low-density subcritical turbidity currents. Rapid deposition as well as erosion is present in facies F2–5, F7 and F8. Only cohesive debris flows (F1), cross-strata near the top of beds (F6) and (cross-)laminated sandstones (F9) are devoid of indicators of erosion or bypass. The classification presented in this paper emphasizes this erosion, bypass and deposition. It can thus be seen as a complementary axis to Mutti’s (Reference Mutti1992) process perspective on turbidite sandstones.
Lowe (Reference Lowe1982) established a more detailed scheme with special reference to high-density turbidity current deposits. The focus of this landmark publication is a careful correlation between depositional processes in high-density turbidity currents and deposit characteristics. Erosion and bypass is present implicitly in this facies scheme due to its focus on deposition. Scour surfaces at the base of beds are unspecified, wavy surfaces overlain directly by gravelly and sandy facies. Eroded mudstone clasts are incorporated in some of the facies. They are primarily included towards the top of idealized event beds, where they give reason to infer cohesive flow processes (Lowe, Reference Lowe1982). This is a contrast to the scheme presented here, in which mudclasts are commonly preserved in close association to scour surfaces (Figs 4h, 7, 8). The association of mudclast horizons with scouring was also observed in active seafloor systems (Carvajal et al. Reference Carvajal, Paull, Caress, Fildani, Lundsten, Anderson, Maier, McGann, Gwiazda and Herguera2017; Maier et al. Reference Maier, Paull, Caress, Anderson, Nieminski, Lundsten, Erwin, Gwiazda and Fildani2020; Fildani et al. Reference Fildani, Kostic, Covault, Maier, Caress and Paull2021). This contrast to the scheme of Lowe (Reference Lowe1982) could indicate that the latter scheme is tailored to positions down-dip of the CLTZ, further away from erosion loci, presumably scaling with the size of the CLTZ.
A striking aspect of this comparison is that previous publications associate erosion and bypass with coarse-grained deposits, commonly with pebbles and cobbles, and almost without exception containing coarse-grained sand – granules (F2–7 of Mutti; S1 of Lowe). This correlation can be correct, and is based in the intuitive reasoning that stronger flows have both the competence to transport larger sediment particles and the capacity to erode more sediment. Our study, however, was performed in the Permian Fort Brown Formation of the Karoo Basin. Even the sandy turbidites here seldom contain grains as coarse as coarse sand (Figs 9b, 11). Yet, the process-based facies scheme demonstrates ample evidence for highly dynamic and erosive behaviour despite this lack of coarse-grained source material. This insight highlights that grain-size and process dynamics cannot always be correlated one-to-one. Systems in which supply of coarse material is limited can still experience strong flows with erosive ability.
In summary, the classification scheme presented here is complementary to previous schemes and seafloor observations. It generally expands the range of features that can be interpreted as indicators of erosion and bypass, where previous schemes emphasize deposition. This makes the scheme especially useful as an additional tool to characterize deposits in CLTZs and for fine-grained systems, respectively.
5.b. Interpretation of the sedimentary structures and architectures
5.b.1. Thinning of the mudstone package underneath Unit E: a mega-scour?
The decrease in thickness of the mudstone package separating Unit E from Unit D defined by using GPS data and satellite images suggests that this zone reflects a local depression in the palaeo-bathymetry (Figs 8a, 9a). A decrease in thickness of the mudstone package between Units D and E was also recognized in a previous study by Brooks et al. (Reference Brooks, Hodgson, Brunt, Peakall, Hofstra and Flint2018 a). However, in contrast to the findings of the present study, Brooks et al. (Reference Brooks, Hodgson, Brunt, Peakall, Hofstra and Flint2018 a) describe an abrupt, rather than a gradual, thinning of the mudstone package. In addition, they also describe a fanning pattern of beds within the mudstones with a thickness increase toward the W (see fig. 11 in Brooks et al. Reference Brooks, Hodgson, Brunt, Peakall, Hofstra and Flint2018 a). Based on those observations, Brooks et al. (Reference Brooks, Hodgson, Brunt, Peakall, Hofstra and Flint2018 a) interpreted the thickness of the mudstones to reflect a depression in the palaeo-bathymetry caused by a listric syn-sedimentary normal fault that ends in a zone of detachment between Units D and E. Indeed, seafloor data from the Navy Fan suggest that scouring can be controlled by activity and location of faults (Carvajal et al. Reference Carvajal, Paull, Caress, Fildani, Lundsten, Anderson, Maier, McGann, Gwiazda and Herguera2017).
An alternative interpretation is suggested here, which interprets the local depression in the palaeo-bathymetry as a mega-scour. The dimensions of this scour with a length of ∼500 m and an incision depth of ∼25 m are similar to those of scours observed in CLTZs on the modern ocean floor, and in some cases are related to fault activity (Normark et al. Reference Normark, Piper and Hess1979, Reference Normark, Paull, Caress, Ussler and Sliter2009; Kenyon & Millington, Reference Kenyon, Millington, Pickering, Hiscott, Kenyon, Ricci Lucchi and Smith1995; Migeon et al. Reference Migeon, Savoye, Zanella, Mulder, Faugères and Weber2001; Wynn et al. Reference Wynn, Kenyon, Masson, Stow and Weaver2002; Macdonald et al. Reference Macdonald, Wynn, Huvenne, Peakall, Masson, Weaver and McPhail2011; Carvajal et al. Reference Carvajal, Paull, Caress, Fildani, Lundsten, Anderson, Maier, McGann, Gwiazda and Herguera2017; Maier et al. Reference Maier, Paull, Caress, Anderson, Nieminski, Lundsten, Erwin, Gwiazda and Fildani2020). The asymmetric shape of the infill of the scour, as well as the location within the bypass zone are further aspects that are consistent with a scour interpretation. Scours of similar size and shape have been observed adjacent to the channel thalweg in seafloor datasets (Carvajal et al. Reference Carvajal, Paull, Caress, Fildani, Lundsten, Anderson, Maier, McGann, Gwiazda and Herguera2017; Maier et al. Reference Maier, Paull, Caress, Anderson, Nieminski, Lundsten, Erwin, Gwiazda and Fildani2020; Fildani et al. Reference Fildani, Kostic, Covault, Maier, Caress and Paull2021). In contrast, scours within the channel thalweg of modern systems tend to be significantly larger in the order of 1–2 km (Carvajal et al. Reference Carvajal, Paull, Caress, Fildani, Lundsten, Anderson, Maier, McGann, Gwiazda and Herguera2017; Heijnen et al. Reference Heijnen, Clare, Cartigny, Talling, Hage, Lintern, Stacey, Parsons, Simmons, Chen, Sumner, Dix and Hughes Clarke2020; Maier et al. Reference Maier, Paull, Caress, Anderson, Nieminski, Lundsten, Erwin, Gwiazda and Fildani2020; Fildani et al. Reference Fildani, Kostic, Covault, Maier, Caress and Paull2021). After their formation such scours can remain unfilled (‘open’) for over 0.2 Ma without capturing significant amounts of sediment (Macdonald et al. Reference Macdonald, Wynn, Huvenne, Peakall, Masson, Weaver and McPhail2011). Common sedimentary facies associated with large scours are fine-grained, thin-bedded and structured sediments with several internal erosive horizons draping a major erosion surface (Macdonald et al. Reference Macdonald, Wynn, Huvenne, Peakall, Masson, Weaver and McPhail2011; Hofstra et al. Reference Hofstra, Hodgson, Peakall and Flint2015; Stevenson et al. Reference Stevenson, Jackson, Hodgson, Hubbard and Eggenhuisen2015). We were not able to identify a distinct erosion surface underneath, or erosive horizons within the thin bedded fine-grained sandstones at the base of the scour. However, the type and structure of the scour infill are similar to the structures observed in push cores taken from scour surfaces in the Navy Fan (Carvajal et al. Reference Carvajal, Paull, Caress, Fildani, Lundsten, Anderson, Maier, McGann, Gwiazda and Herguera2017). In addition, highly erosive flows might have emplaced the injectites upstream of the scour showing the coarsest grain-size distribution of all sampling locations (Figs 9b, 11). Nevertheless, the deposits at the base of the scour seem to represent sediments that were captured within the scour during the period it was kept open and underfilled.
On top of the thin-bedded fine-grained sandstones lies a 3.5 m thick structureless and poorly sorted sandstone. These sediments are interpreted as the deposits from turbidity currents that were collapsing upon flowing into the scour depression, resulting in the poor grain-size sorting of the deposited sand (Fig. 11).
After the shutdown of the sediment supply and the end of deposition of Unit E the scour still represented a depression on the ocean floor and was draped and filled with hemipelagic mud and silt-sized deposits from small turbidity currents.
5.b.2. Incision in the bypass zone
The ∼20 m long, ∼2 m deep incision in the bypass zone is interpreted as a scour (Fig. 6). This interpretation is based on the shape of the incision, the association with the sedimentary facies and structures, and the grain-size distribution of the collected samples. Based on these data, different phases of the development and evolution of the scour have been reconstructed (Fig. 15).
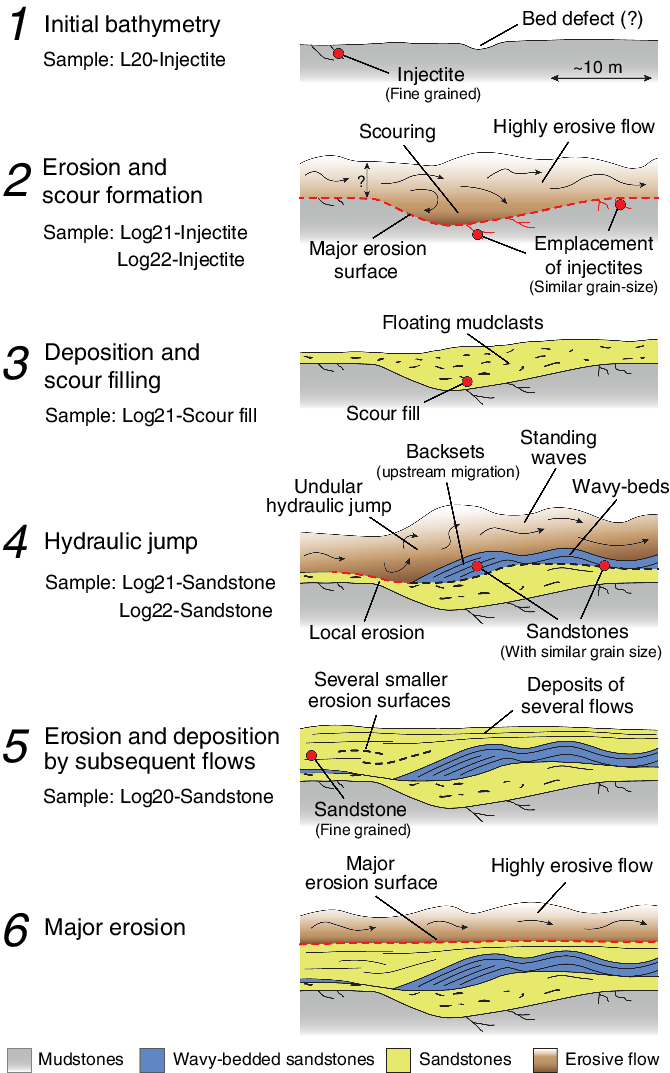
Fig. 15. Phases of the development and evolution of the incision in the bypass zone shown in Figure 8.
Phases 1 and 2: The scour was cut into the underlying mudstone by a highly erosive turbidity current, where a local defect in the ocean floor might have facilitated the formation of the scour at this particular location (see ‘defect model’ in Allen, Reference Allen1971). This local defect could have looked like the locally eroded and ripped seafloor as observed in other locations in the bypass zone (Fig. 7a, b). The turbidity current that was incising the scour probably also emplaced the two injectites underneath and downstream of the scour (sensu Eggenhuisen et al. Reference Eggenhuisen, McCaffrey, Haughton and Butler2011) as suggested by their similar grain-size distribution (Fig. 8). The injectite farther upstream of the scour shows a finer grain-size distribution and is therefore probably related to a previous turbidity current (Fig. 15).
Phase 3: After its incision, the scour was filled with sand and mudclasts. It is not clear whether the infill of the scour is related to the same turbidity current event that incised the scour. However, the finer grain-size distribution of the sandstone within the scour compared to that of the injectites underneath suggests that the scour was filled by one or multiple subsequent flows (Figs 8, 15).
Phase 4: The next phase was characterized by the deposition of the backsets and the wavy beds further downstream (Fig. 15). Backsets are typical for bedforms resulting from an upstream-migrating hydraulic jump (e.g. Macdonald et al. Reference Macdonald, Alexander, Bacon and Cooker2009; Cartigny et al. Reference Cartigny, Ventra, Postma and van Den Berg2014; Vellinga et al. Reference Vellinga, Cartigny, Eggenhuisen and Hansen2018). The wavy beds immediately downstream of the backsets are interpreted to have been deposited by standing waves that typically form downstream of undular hydraulic jumps (e.g. Lennon & Hill, Reference Lennon and Hill2006; Cartigny et al. Reference Cartigny, Ventra, Postma and van Den Berg2014; Slootman et al. Reference Slootman, Cartigny, Moscariello, Chiaradia and de Boer2016, Reference Slootman, Simpson, Castelltort and de Boer2018). Grain-size samples from the backsets and the wavy beds show a similar grain-size distribution, supporting the (cor)relation of these two. Experiments demonstrate the formation of hydraulic jumps in scenarios where deposits formed a slope with an adverse gradient (Pohl et al. Reference Pohl, Eggenhuisen, Cartigny, Tilston, de Leeuw and Hermidas2020 a). It is likely that the hydraulic jump in this fourth phase of the scour evolution was triggered by deposits downstream of the scour (i.e. a topographic rampart) forming a slope with an adverse gradient.
Phases 5 and 6: The fifth phase is characterized by erosion and deposition due to several subsequent flows (Fig. 15). The bathymetry that was formed by the previous phases was draped and filled by several sandstone beds showing multiple small erosion surfaces, suggesting that this phase was dominated by depositional and less erosive flows (Fig. 8). The following, sixth phase is characterized by a major erosion surface that can be traced over the entire length/width of the outcrop (Fig. 8). This erosion surface was formed by a highly erosive turbidity current, probably similar to the flow that was incising the scour in the second phase. The erosive horizon is covered by a thin sandstone bed covered by mudstones indicating low-energy sedimentation and a decrease in sediment supply.
5.b.3. Transition from the bypass to the deposition zone
The architecture of the bedding exactly at the transition between the bypass and the deposition zone reveals three phases of sedimentation and erosion. In the first phase, sediment was deposited as tabular and mainly structureless sandstones. At this location, the character of the contact of the deposits of this phase with the underlying mudstones is mainly depositional with only local erosion, suggesting low- to non-erosive turbidity currents (Figs 12, 16a). The second phase describes the progradation of the bypass zone across the deposition zone (Fig. 16b). The deposits of the first phase were partly eroded by subsequent flows, resulting in an upstream-dipping major erosive surface and a cut-off of the underlying sandstone beds (Fig. 12). The amount of sediment, and the thickness of the stratigraphy which was eroded during the second phase, is unknown. The erosive surface was draped with an up to 0.5 m thick mudclast breccia, which is interpreted to represent the end of the second erosive phase (Fig. 12). In the third phase the mudclast breccia was draped with sandstone beds with an upwards-thinning pattern, suggesting a decrease in system activity and sediment supply or a lateral shift of the system (Fig. 16c). In addition, the sandstone beds show upstream thinning, and a backstepping of the deposition zone. At the end of the third phase, sediment supply was shut off, resulting in deposition of hemipelagic mud.

Fig. 16. Reconstruction of the progradation and backstepping of the bypass zone. (a) During the first phase, the bypass zone marked by erosion is followed down-dip by the depositional zone. In the depositional zone the contact of the sandstones to the underlying mudstones is mainly depositional with only local erosion. (b) The second phase, where establishment of the systems resulted in a propagation of the bypass zone across the depositional zone. (c) In the third phase a decrease of the system’s activity resulted in the backstepping of the deposits and a contraction of the bypass zone.
5.c. Palaeoflow distribution
In the bypass zone and the proximal deposition zone, the main palaeoflow direction is toward the ENE (∼70°), suggesting the connection of these two zones. (Fig. 13). The variability in palaeoflow direction between these two zones is different. The higher variability in the bypass zone (s B = 37.2°; Fig. 13) could be explained by bathymetric irregularities of the seabed such as scours or focal points of deposition. These irregularities steer the gravity-driven turbidity currents toward depressions in the ocean floor, resulting in local changes in flow direction over short distances (e.g. Eggenhuisen et al. Reference Eggenhuisen, McCaffrey, Haughton and Butler2010). The presence of these irregularities in the bathymetry is supported by our field observations of substantial seabed erosion and scouring in the bypass zone (e.g. Figs 6, 7, 8). In contrast, the lower variability in palaeoflow direction in the deposition zone (s B = 14.7°; Fig. 13) suggests less local topographic steering and a less irregular seabed. This is supported by the predominantly flat tops of the sandstone beds that were deposited in the deposition zone, implying a flat and uniform ocean floor rather than irregularities. The increased variability in palaeoflow direction may represent an additional criterion to identify zones of bypass and erosion in sparse datasets. However, for this assessment a significant number of reliable palaeoflow indicators would be required. Palaeoflow indicators used for this study are grooves and flutes, which are commonly associated with fast and stronger flows that are capable of leaving marks in the seabed (Peakall et al. Reference Peakall, Best, Baas, Hodgson, Clare, Talling, Dorrell and Lee2020). Depositional flows might not leave such palaeoflow indicators, especially flutes (Peakall et al. Reference Peakall, Best, Baas, Hodgson, Clare, Talling, Dorrell and Lee2020). Thus, our palaeoflow results would only capture the direction of the fast and strong flows in the depositional zone. Predominantly depositional or even collapsing flows might have a higher variability in palaeoflow direction, but that would not be documented in flute and groove marks. The measured palaeoflow indicators were commonly found at the base of sandstone beds that were decimetres thick, and displayed facies characteristic for the depositional zone (Fig. 4c). This indicates that at least the flutes and grooves were representative of part of the depositional flows in this zone.
Palaeoflow measurements show a change in the mean direction from ENE in the bypass zone and the proximal deposition zone to NNE in the distal deposition zone (Fig. 13). We suggest two different explanations for the change in mean flow direction. First, the change could have been caused by topographic steering of the turbidity currents. In this scenario a bathymetric high formed by sediment accumulations deposited by former turbidity currents forced a change in mean flow direction. Such variability in palaeoflow direction is also commonly observed in high-resolution modern seafloor data (Carvajal et al. Reference Carvajal, Paull, Caress, Fildani, Lundsten, Anderson, Maier, McGann, Gwiazda and Herguera2017; Maier et al. Reference Maier, Paull, Caress, Anderson, Nieminski, Lundsten, Erwin, Gwiazda and Fildani2020). Second, the turbidity currents flowing out into the depositional zone might be more readily diverted by oceanographic effects such as contour currents or geostrophic flow that were flowing along slope to the NW. This effect has recently been brought to attention in literature on other datasets (Fuhrmann et al. Reference Fuhrmann, Kane, Clare, Ferguson, Schomacker, Bonamini and Contreras2020; Miramontes et al. Reference Miramontes, Eggenhuisen, Silva Jacinto, Poneti, Pohl, Normandeau, Campbell and Hernández-molina2020). While there is no documentation yet of deposits that would suggest the existence of geostrophic flows or contour current activity in the Permian Karoo Basin, this interpretation would be consistent with the position on the western margin of a large marine body of water at a palaeolatitude of 60° on the Southern Hemisphere in the Permian (Van Hinsbergen et al. Reference Van Hinsbergen, De Groot, Van Schaik, Spakman, Bijl, Sluijs, Langereis and Brinkhuis2015).
6. Conclusions
This study provides documentation of detailed sedimentary characteristics that indicate zones dominated by sediment bypass and erosion applicable for identifying CLTZs in other datasets, such as outcrops with limited palaeogeographical context and sediment cores obtained from subsurface systems, and to make predictions away from points of control in sparse datasets.
A process-based facies classification scheme was developed allowing us to distinguish zones of bypass from zones of deposition by sedimentary facies on a bed scale rather than from the overall thickens of the deposits. In the bypass zone, sediment facies were dominated by erosion but show a complex alternation with depositional structures. Common erosive facies were mudclast breccias, injectites, and amalgamated beds with mudclast. Typical depositional facies were rippled and laminated beds, structureless sandstones and convoluted beds. In contrast to the bypass zone, the depositional zone was dominated by depositional facies, and erosive facies could only be recognized occasionally. The spatial distribution and frequency of process-based sedimentary facies can provide a criterion to identify zones of erosion and deposition in other datasets.
Metre-scale structures in the bypass zone indicate highly erosive turbidity currents resulting in ocean-floor erosion and scour formation. In the specific outcrop, GPS data and field relations suggest the presence of a ∼500 m long scour. Such scours are difficult to identify in outcrop but represent common features in CLTZs identified in seafloor bathymetry. This study provides an example how a ∼500 m long scour could be identified based on field relations and sedimentary facies.
In addition to facies associations and large-scale structures, zones of bypass could also be identified based on variation in the local palaeoflow direction. In the bypass zone the variation in palaeoflow direction was higher than in the depositional zone. This increased variability may be attributed to topographic steering of the turbidity currents due to irregularities on the seabed such as scours or focal points of deposition. However, variations of the palaeoflow distribution could only serve as a potential criterion to identify zones of bypass if a significant number of reliable palaeoflow measurements is available.
The here presented process-based documentation of CLTZ features can help to identify areas dominated by bypass or erosion in sparse datasets with limited palaeogeographic context encountered elsewhere.
Supplementary material
To view supplementary material for this article, please visit https://doi.org/10.1017/S0016756822000693
Acknowledgements
This contribution is part of EuroSEDS (Eurotank Studies of Experimental Deepwater Sedimentology), supported by the NWO (Netherlands Organization for Scientific Research) (grant no. NWO 864.13.006), ExxonMobil, Shell and Equinor. We thank the local farmers of the Laingsburg region for permission to undertake field studies on their land, especially Henk Steyn. Katherine Maier, Cristian Carvajal, Andrea Fildani and Editor Peter Clift provided detailed and constructive reviews that helped us to improve our paper.
Conflict of interest
None.


 Open access