


1. Introduction
This study presents a detailed analysis of the middle Cenomanian planktonic foraminifera from the Lydden Spout section near Folkestone (Kent, UK) (Fig. 1). This section is particularly important because it records the middle Cenomanian Event 1 (MCE 1), a carbon isotope excursion first described by Paul et al. (Reference Paul, Mitchell, Marshal, Leary, Gale, Duane and Ditchfield1994) in northwest European sections from the Anglo-Paris Basin and Cleveland Basin, that is characterized by a prominent double-peak δ13Ccarb positive excursion of up to 1 ‰ named MCE 1 by Mitchell et al. (Reference Mitchell, Paul and Gale1996) in a study of the δ13C record at Folkestone, Speeton in the Cleveland Basin (North Yorkshire, UK), and Wünstorf in the Lower Saxony Basin. In these sections, Mitchell et al. (Reference Mitchell, Paul and Gale1996) described the lower isotopic peak of the bipartite excursion as MCE 1a and the upper one as MCE 1b, and observed that the early portion above MCE 1b has a relatively flat δ13C signature followed by increasing δ13C values that at Speeton and Folkestone are interrupted by a small negative δ13C excursion that was named MCE 2.

Fig. 1. (a) Map of the British Isles. (b) Location of the section between Dover and Folkestone in Kent. (c) Google Earth image of region west of Samphire Hoe to show location of Lydden Spout.
The MCE 1 is a globally recognized carbon cycle perturbation that has been identified in the US Western Interior Basin (Gale et al. Reference Gale, Voigt, Sageman and Kennedy2008; Joo & Sageman, Reference Joo and Sageman2014; Eldrett et al. Reference Eldrett, Ma, Bergman, Lutz, Gregory, Dodsworth, Phipps, Hardas, Minisini, Ozkan, Ramezani, Bowring, Kamo, Ferguson, Macaulay and Kelly2015; Ma et al. Reference Ma, Hinnov, Eldrett, Meyers, Bergman, Minisini and Lutz2022), Atlantic Ocean (Ando et al. Reference Ando, Huber, MacLeod, Ohta and Khim2009; Friedrich et al. Reference Friedrich, Erbacher, Wilson, Moriya and Mutterlose2009; Hardas et al. Reference Hardas, Mutterlose, Friedrich and Erbacher2012), northern Europe (Wilmsen, Reference Wilmsen2003, Reference Wilmsen2007; Voigt et al. Reference Voigt, Gale and Flögel2004; Erbacher et al. Reference Erbacher, Bornemann, Petrizzo and Huck2020), Italy (Erbacher et al. Reference Erbacher, Thurow and Littke1996; Stoll & Schrag, Reference Stoll and Schrag2000; Coccioni & Galeotti, Reference Coccioni and Galeotti2003; Gambacorta et al. Reference Gambacorta, Jenkyns, Russo, Tsikos, Wilson, Faucher and Erba2015), France (Giraud et al. Reference Giraud, Reboulet, Deconinck, Martinez, Carpentier and Bréziat2013; Reboulet et al. Reference Reboulet, Giraud, Colombié and Carpentier2013), Spain (Rodriguez-Lazaro et al. Reference Rodriguez-Lázaro, Pascual and Elorza1998), north Africa (Kuhnt et al. Reference Kuhnt, Holbourn, Gale, Chellai and Kennedy2009; Gertsch et al. Reference Gertsch, Adatte, Keller, Tantaw, Berner, Mort and Fleitmann2010; Beil et al. Reference Beil, Kuhnt, Holbourn, Aquit, Flögel, Chellai and Jabour2018) and Tibet (Li et al. Reference Li, Jenkyns, Wang, Hu, Chen, Wei, Huang and Cui2006). Changes in benthic and planktonic foraminifera, radiolaria, calcareous nannofossils and nektonic assemblages characterize the MCE 1 (e.g. Paul et al. Reference Paul, Mitchell, Marshal, Leary, Gale, Duane and Ditchfield1994; Erbacher et al. Reference Erbacher, Thurow and Littke1996; Mitchell & Carr, Reference Mitchell and Carr1998; Rodriguez-Lazaro et al. Reference Rodriguez-Lázaro, Pascual and Elorza1998; Coccioni & Galeotti, Reference Coccioni and Galeotti2003; Wilmsen et al. Reference Wilmsen, Niebuhr and Hiss2005, Reference Wilmsen2007; Friedrich et al. Reference Friedrich, Erbacher, Wilson, Moriya and Mutterlose2009; Hardas et al. Reference Hardas, Mutterlose, Friedrich and Erbacher2012), but the interpretations of these changes are contradictory. For instance, the benthic foraminiferal assemblages suggest that the MCE 1 was associated with dysaerobia of lower-intermediate water masses (Basque Basin, Spain: Rodriguez-Lazaro et al. Reference Rodriguez-Lázaro, Pascual and Elorza1998), stratification of the water column (Anglo-Paris Basin: Mitchell & Carr, Reference Mitchell and Carr1998; tropical Atlantic Ocean: Friedrich et al. Reference Friedrich, Erbacher, Wilson, Moriya and Mutterlose2009; Hardas et al. Reference Hardas, Mutterlose, Friedrich and Erbacher2012) or decreased ventilation on the sea floor (Umbria–Marche Basin, Italy: Coccioni & Galeotti, Reference Coccioni and Galeotti2003). The MCE 1 was interpreted as an event of increased marine primary productivity (Umbria–Marche Basin: Erbacher & Thurow, Reference Erbacher and Thurow1997; Stoll & Schrag, Reference Stoll and Schrag2001; Coccioni & Galeotti, Reference Coccioni and Galeotti2003; northern Germany: Wilmsen, Reference Wilmsen2003), but in the tropical Atlantic Ocean, calcareous nannofossils indicate increased stratification of the water column that resulted in more oligotrophic conditions of the upper photic zone (Hardas et al. Reference Hardas, Mutterlose, Friedrich and Erbacher2012). In the Basque Basin, planktonic foraminiferal assemblages do not change across the MCE 1 (Rodriguez-Lazaro et al. Reference Rodriguez-Lázaro, Pascual and Elorza1998), whereas they vary in composition and size throughout the excursion in the Anglo-Paris Basin (Paul et al. Reference Paul, Mitchell, Marshal, Leary, Gale, Duane and Ditchfield1994). Radiolarian assemblages of the western Tethys and the North Atlantic show an extinction of 26 % of all species, and the loss of deep habitats was interpreted as being related to the expansion of the oxygen minimum zone during sea-level rise (Erbacher et al. Reference Erbacher, Thurow and Littke1996).
The MCE 1 was proposed as a precursor to the late Cenomanian – early Turonian Oceanic Anoxic Event 2 (OAE 2, e.g. Jenkyns, Reference Jenkyns2010), although of lower amplitude (e.g. Coccioni & Galeotti, Reference Coccioni and Galeotti2003; Friedrich et al. Reference Friedrich, Erbacher, Wilson, Moriya and Mutterlose2009; Zheng et al. Reference Zheng, Jenkyns, Gale, Ward and Henderson2016) and currently much less well understood than OAE 2. The location of the carbon-burial sink responsible for the MCE 1 positive carbon-isotope excursion is poorly known, but Gale (Reference Gale1995, fig. 11) noted the presence of laminated, organic-rich sediments at one level in the Vocontian Basin (southeast France). Laminated black shales corresponding to the δ13C positive excursion also occur in the tropical Atlantic Ocean (Demerara Rise, total organic content values from 5 to 18 %, Friedrich et al. Reference Friedrich, Erbacher, Wilson, Moriya and Mutterlose2009).
The relationships between MCE 1 and OAE 2 are poorly constrained, although similarities and differences are observed. In western Europe, boreal belemnites (Praectinocamax primus) and bivalves (Chlamys arlesiensis and Oxytoma seminudum) spread southwards during the MCE 1, indicating two cooling pulses (e.g. Paul et al. Reference Paul, Mitchell, Marshal, Leary, Gale, Duane and Ditchfield1994; Gale & Christensen, Reference Gale and Christensen1996; Wilmsen, Reference Wilmsen2003). Similarly, a southward incursion of boreal assemblages containing Praectinocamax plenus characterizes cooling episodes known as the Plenus Cold Event (PCE; Gale & Christensen, Reference Gale and Christensen1996; Jarvis et al. Reference Jarvis, Lignum, Gröcke, Jenkyns and Pearce2011; Jenkyns et al. Reference Jenkyns, Dickson, Ruhl and van den Boorn2017; Gale et al. Reference Gale, Kennedy and Walaszczyk2019a; O’Connor et al. Reference O’Connor, Remmelzwaal, Robinson, Batenburg, Jenkyns, Parkinson and Gale2019) that interrupted the supergreenhouse conditions during part of the Cenomanian–Turonian positive δ13C excursion that identifies the OAE 2.
The MCE 1 and OAE 2 differ in the amplitude and shape of the δ13C excursion and in the rates of organic carbon burial. The size of the MCE 1 excursion is smaller than the 2–3 ‰ positive excursion recorded during OAE 2 and is of shorter duration (Jarvis et al. Reference Jarvis, Gale, Jenkyns and Pearce2006; Joo & Sageman, Reference Joo and Sageman2014; Eldrett et al. Reference Eldrett, Ma, Bergman, Lutz, Gregory, Dodsworth, Phipps, Hardas, Minisini, Ozkan, Ramezani, Bowring, Kamo, Ferguson, Macaulay and Kelly2015; Gambacorta et al. Reference Gambacorta, Jenkyns, Russo, Tsikos, Wilson, Faucher and Erba2015). Astronomical age models from the US Western Interior Seaway indicate a duration of c. 0.21 Ma for the MCE 1 compared to the estimation of OAE 2 that varies between 0.52 and 0.92 Ma (Sageman et al. Reference Sageman, Meyers and Arthur2006; Eldrett et al. Reference Eldrett, Ma, Bergman, Lutz, Gregory, Dodsworth, Phipps, Hardas, Minisini, Ozkan, Ramezani, Bowring, Kamo, Ferguson, Macaulay and Kelly2015; Batenburg et al. Reference Batenburg, de Vleesschouwer, Sprovieri, Hilgen, Gale, Singer, Koeberl, Coccioni, Claeys and Montinari2016).
The carbon isotope record during the onset of the MCE 1 and OAE 2 suggests comparable triggering mechanisms and climate–carbon cycle feedbacks during the two events, although there is no undeniable evidence for a similar initiation mechanism. Volcanic activity and emplacement of Large Igneous Provinces (LIPs: Caribbean, High Arctic, Madagascar and Ontong-Java) were suggested to be responsible for the initiation of OAE 2. For instance, evidence of volcanism based on the osmium-isotope record suggests that a major pulse of volcanism and associated sea-floor hydrothermal weathering began prior to the onset of the carbon isotope excursion at the base of OAE 2 (e.g. Turgeon & Creaser, Reference Turgeon and Creaser2008; Du Vivier et al. Reference Du Vivier, Selby, Sageman, Jarvis, Gröcke and Voigt2014, Reference Du Vivier, Selby, Condon, Takashima and Nishi2015; Jenkyns et al. Reference Jenkyns, Dickson, Ruhl and van den Boorn2017). Neodynium-isotope positive excursion during OAE 2 in the European epicontinental sea (Zheng et al. Reference Zheng, Jenkyns, Gale, Ward and Henderson2013) and in the tropical Atlantic Ocean (MacLeod et al. Reference MacLeod, Martin and Blair2008; Martin et al. Reference Martin, MacLeod, Jiménez Berrocoso and Bourbon2012) were interpreted to reflect transport of radiogenic neodynium released from LIP volcanism under anoxic conditions. By contrast, no neodynium-isotope increase was observed across the MCE 1 (Jiménez Berrocoso et al. Reference Jiménez Berrocoso, MacLeod, Martin, Bourbon, Londoño and Basak2010; Zheng et al. Reference Zheng, Jenkyns, Gale, Ward and Henderson2016), although its record supports reorganization of ocean circulation during the MCE 1 and OAE 2 and high productivity in surface waters, with nutrients probably deriving from deep waters and/or LIPs sources (Zheng et al. Reference Zheng, Jenkyns, Gale, Ward and Henderson2016). According to Scaife et al. (Reference Scaife, Ruhl, Dickson, Mather, Jenkyns, Percival, Hesselbo, Cartwright, Eldrett, Bergman and Minisini2017), sedimentary mercury concentration data from the US Western Interior Seaway and North Atlantic Ocean are consistent with an initial magmatic pulse at the time of the MCE 1 followed by a second greater pulse at the onset of OAE 2, possibly related to the emplacement of LIPs in the Pacific Ocean and/or the High Arctic.
Cenomanian times (100.5–93.9 Ma) register one of the best-documented episodes of eustatic rise in sea-level in Earth history and the beginning of the Late Cretaceous Thermal Maximum, driving the global expansion of epicontinental seas and the onset of widespread pelagic and hemipelagic carbonate deposition (e.g. Giorgioni et al. Reference Giorgioni, Weissert, Bernasconi, Hochuli, Keller, Coccioni, Petrizzo, Lukeneder and Garcia2015). It was also a time when the evolutionary diversification of planktonic foraminifera took place at a fast rate. After the major turnover across the Aptian–Albian boundary interval (Kennedy et al. Reference Kennedy, Gale, Bown, Caron, Davey, Gröcke and Wray2000; Leckie et al. Reference Leckie, Bralower and Cashman2002; Huber & Leckie, Reference Huber and Leckie2011; Petrizzo et al. Reference Petrizzo, Huber, Gale, Barchetta and Jenkyns2012, Reference Petrizzo, Huber, Gale, Barchetta and Jenkyns2013; Kennedy et al. Reference Kennedy, Gale, Huber, Petrizzo, Bown, Barchetta and Jenkyns2014), the progressive appearance of new lineages is observed throughout the Albian and Cenomanian.
A marked phase of high evolutionary rates is registered in the Cenomanian within the polyphyletic Rotalipora group (Rotalipora Brotzen, Reference Brotzen1942; Thalmanninella Sigal, Reference Sigal1948; Pseudothamanninella Wonders, Reference Wonders1978; Parathalmanninella Lipson-Benitah, Reference Lipson-Benitah2008), that includes trochospiral taxa with sutural or umbilical supplementary aperture and a peripheral keel (Wonders, Reference Wonders1980; González-Donoso et al. Reference González-Donoso, Linares and Robaszynski2007). Rotaliporids are the major component of the assemblages until the end of the Cenomanian when the last representative (Rotalipora cushmani) disappears. The morphological plasticity and species variation within the Rotalipora lineages (e.g. Robaszynski et al. Reference Robaszynski, Caron, Amédro, Dupuis, Hardenbol, González-Donoso, Linares and Gartner1994; Petrizzo & Huber, Reference Petrizzo and Huber2006; González-Donoso et al. Reference González-Donoso, Linares and Robaszynski2007; Lipson-Benitah, Reference Lipson-Benitah2008) has influenced the planktonic foraminiferal biozonation (e.g. Ando et al. Reference Ando, Huber and MacLeod2010; Petrizzo et al. Reference Petrizzo, Caron and Premoli Silva2015; Falzoni et al. Reference Falzoni, Petrizzo, Caron, Leckie and Elderbak2018; Petrizzo & Gilardoni, Reference Petrizzo and Gilardoni2020). Specifically, the classic Tethyan biozonations made by Robaszynski & Caron (Reference Robaszynski and Caron1995) and Premoli Silva & Sliter (Reference Premoli Silva and Sliter1995), that were incorporated in the Geological Time Scales (Gradstein et al. Reference Gradstein, Ogg and Smith2004, Reference Gradstein, Ogg, Schmitz and Ogg2012; Ogg et al. Reference Ogg, Ogg and Gradstein2016; Gale et al. Reference Gale, Mutterlose, Batenburg, Gradstein, Agterberg, Ogg, Petrizzo, Gradstein, Ogg, Schmitz and Ogg2020 in Gradstein et al. Reference Gradstein, Ogg, Schmitz and Ogg2020), have recently been revised by Petrizzo and Gilardoni (Reference Petrizzo and Gilardoni2020) who introduced the Thalmanninella greenhornensis Zone. This is defined as the stratigraphic interval between the lowest occurrence (LO) of T. greenhornensis and the LO of R. cushmani, to overcome the difficulty in identifying the Thalmanninella reicheli Zone of previous authors because of the rarity and absence of the species in many western and eastern Tethyan localities and in the US Western Interior Basin record. The appearance of T. greenhornensis is demonstrated to be an easy identifiable bioevent as the species is characterized by a wider geographic distribution and is often reported to appear in the same stratigraphic level as T. reicheli when the latter species is present (see discussion in Petrizzo & Gilardoni, Reference Petrizzo and Gilardoni2020). Moreover, the middle to late Cenomanian planktonic foraminiferal record is also characterized by the evolutionary appearance of the unkeeled trochospiral and heavily muricate Whiteinella and of the double-keeled genera Dicarinella and Marginotruncana (Premoli Silva & Sliter, Reference Premoli Silva and Sliter1995; Fraass et al. Reference Fraass, Kelly and Peters2015; Falzoni et al. Reference Falzoni, Petrizzo, Caron, Leckie and Elderbak2018; Falzoni & Petrizzo, Reference Falzoni and Petrizzo2020; Petrizzo & Gilardoni, Reference Petrizzo and Gilardoni2020).
In this study, the planktonic foraminifera stratigraphic distribution, abundance, species richness and population dynamics are coupled with the inferred palaeoecological preferences of taxa to interpret the palaeoceanographic changes and the trophic features of the surface waters across the MCE 1 positive δ13C excursion, which is also characterized by a series of positive δ18O shifts indicating episodes of remarkable cooling.
2. Folkestone section: background and methods
2.a. Location and stratigraphy
The sea-cliff at Lydden Spout, 500 m west of Samphire Hoe, on the coast between Folkestone and Dover, Kent (Fig. 1), provides 25 m of accessible exposure of lower and middle Cenomanian chalks of the Westbury and Zigzag Chalk Formations (Fig. 2). The chalks are rhythmically bedded on a scale of several decimetres, darker marly levels alternating with paler chalky beds, interpreted as precession cycles driven by dilution from the input of clay (Gale et al. Reference Gale, Young, Shackleton, Crowhurst and Wray1999). The stratigraphy and ammonite zonation of the succession between Dover and Folkestone was described by Kennedy (Reference Kennedy1969). The detailed stratigraphy of the middle Cenomanian succession at Lydden Spout was illustrated by Gale (Reference Gale1989), who provided a detailed log and identified a succession of distinctive beds which could be correlated across the Anglo-Paris Basin (Gale, Reference Gale1990, Reference Gale1995). These papers also demonstrated the presence of macrofossil taxa with Boreal affinities at this level, previously recorded from the upper part of the late Cenomanian Plenus Marl Member (Jefferies, Reference Jefferies1962, Reference Jefferies1963). These include two species of bivalve, Chlamys arlesiensis and Oxytoma seminudum, and a nektonic belemnite, Praectinocamax. In the middle Cenomanian, Boreal species are concentrated in a lower C. arlesiensis Bed and a higher P. primus Bed (Fig. 2; Gale, Reference Gale1995: the Cast Bed of Gale, Reference Gale1989).

Fig. 2. Succession of Cenomanian chalk at Lydden Spout, Folkestone, showing sequence-stratigraphic interpretation (Gale & Kennedy, Reference Gale and Kennedy2021), lithostratigraphy (Gale, Reference Gale1989) and ammonite biostratigraphy (Wright et al. Reference Wright, Kennedy, Hancock and Gale2017). The carbon-isotope and oxygen-isotope curves are based on 5 cm spaced samples, analysed at Cambridge University in 1997. The data show the double carbon-isotope positive excursion of the MCE 1. The Chlamys arlesiensis Bed, Praectinocamax primus Bed and Cast Bed are according to Gale (Reference Gale1995). Foraminiferal abundances, planktonic foraminiferal species distribution and species richness and per cent planktonic foraminifera (% P) according to this study. Planktonic foraminifera zonation after Petrizzo & Gilardoni (Reference Petrizzo and Gilardoni2020). To the right are records of important macrofaunal elements, including benthic macrofossils with Boreal affinities, ammonites and an inoceramid bivalve (Gale & Kennedy, Reference Gale and Kennedy2021). Light orange band = middle Cenomanian Event 1 (MCE 1); light blue rectangles = δ18O positive peaks and occurrence of Boreal fauna; PF = planktonic foraminifera.
2.b. The stable carbon-isotope and oxygen-isotope record
A positive carbon isotope excursion containing two peaks was identified in the lower part of the middle Cenomanian of the Lydden Spout succession by Paul et al. (Reference Paul, Mitchell, Marshal, Leary, Gale, Duane and Ditchfield1994) and was correlated with detailed records of macrofossils and foraminifera. This carbon isotope excursion was subsequently named MCE 1 by Mitchell et al. (Reference Mitchell, Paul and Gale1996; see also Jarvis et al. Reference Jarvis, Gale, Jenkyns and Pearce2006) who described the lower peak of the bipartite excursion as MCE 1a and the upper peak as MCE 1b. The MCE 1a begins in the Cunningtoniceras inerme ammonite Zone (Jarvis et al. Reference Jarvis, Murphy and Gale2001, Reference Jarvis, Gale, Jenkyns and Pearce2006), and is associated with a lowstand systems tract (Gale, Reference Gale1995; Gale & Kennedy, Reference Gale and Kennedy2021); the MCE 1b falls in the lowermost part of the ammonite Acanthoceras rhotomagense Zone (Jarvis et al. Reference Jarvis, Murphy and Gale2001, Reference Jarvis, Gale, Jenkyns and Pearce2006) and is associated with a transgressive systems tract (Gale, Reference Gale1995; Mitchell et al. Reference Mitchell, Paul and Gale1996).
The carbon isotope record at Folkestone in the studied stratigraphic interval records the MCE 1 excursion (Fig. 2) similar to that reported by Paul et al. (Reference Paul, Mitchell, Marshal, Leary, Gale, Duane and Ditchfield1994) and Zheng et al. (Reference Zheng, Jenkyns, Gale, Ward and Henderson2016). In this study, bulk-chalk δ13C was measured every ∼5 cm and registered peak values of ∼2.5 ‰ in the C. arlesiensis Bed at 31.7 m which are followed by a trough of ∼2.2 ‰ and by a subsequent δ13C rise to ∼2.5 ‰ toward the top of the P. primus Bed before decreasing again at ∼35.2 m (Fig. 2). The stratigraphic position of the double-peak δ13C positive excursion is in agreement with that reported by Paul et al. (Reference Paul, Mitchell, Marshal, Leary, Gale, Duane and Ditchfield1994), although δ13C values are slightly different between the two studies. Here we define the MCE 1 event as the positive carbon excursion extending from the rise in values at the base of the C. arlesiensis Bed (31.5 m), to the fall in values at 36 m (Fig. 2).
The δ18O bulk carbonate record at Folkestone documents cyclic fluctuations within MCE 1 related to individual couplets with heavier values in marls and lighter values in chalks (Fig. 2; Paul et al. Reference Paul, Mitchell, Marshal, Leary, Gale, Duane and Ditchfield1994; Voigt et al. Reference Voigt, Gale and Flögel2004) that indicate a primary temperature change in sea-surface waters (Ditchfield & Marshall, Reference Ditchfield and Marshall1989). The interval from 31.5 to 34 m registers the heaviest values, with a positive peak of 1.68 ‰ in the C. arlesiensis Bed at 31.75 m followed by subsequent positive peaks of 1.95 ‰ at 32.55 m, 2.0 ‰ at 33.3 m, and 2.07 ‰ at 33.85 m; the latter peak is registered in the P. primus Bed (Fig. 2; Supplementary Material Table S1). The observed δ18O positive peaks in the C. arlesiensis Bed and in the P. primus Bed were also previously documented by measurements on brachiopod shells collected from Lydden Spout (Voigt et al. Reference Voigt, Gale and Flögel2004; Gale & Kennedy, Reference Gale and Kennedy2021).
2.c. Sequence stratigraphy
There are marked changes in sea-level during the MCE 1 in the Anglo-Paris Basin, interpreted from sequence-stratigraphical analysis (Robaszynski et al. Reference Robaszynski, Gale, Juignet, Amédro and Hardenbol1998) as representing the boundary between their Cenomanian sequences 3 and 4 (see summary in Gale & Kennedy, Reference Gale and Kennedy2021). The sequence boundary at the top of sequence Ce3 has been identified within the upper Mantelliceras dixoni Zone, and over the London Platform, to the north, this surface erodes down into older Cenomanian chalks. Subsequent sea-level rise, commencing at the time of deposition of the C. arlesiensis Bed and Cast Bed, resulted in onlap of the condensed Totternhoe Stone (Acanthoceras rhotomagense Zone) over lower Cenomanian chalks across the Transitional Province of southern England (Gale & Kennedy, Reference Gale and Kennedy2021). The Lydden Spout succession is uncondensed and was deposited in shallow waters (<200 m) in a pelagic epicontinental environment at the junction of the Boreal Sea, Tethys and proto-North Atlantic. The Ce3–Ce4 sequence boundary has been identified very widely, from the US Western Interior (Gale et al. Reference Gale, Voigt, Sageman and Kennedy2008), Texas (Eldrett et al. Reference Eldrett, Ma, Bergman, Lutz, Gregory, Dodsworth, Phipps, Hardas, Minisini, Ozkan, Ramezani, Bowring, Kamo, Ferguson, Macaulay and Kelly2015), Germany (Wilmsen, Reference Wilmsen2003, Reference Wilmsen2007), north Africa (Kuhnt et al. Reference Kuhnt, Holbourn, Gale, Chellai and Kennedy2009), Ukraine and Kazakhstan (Gale et al. Reference Gale, Young, Shackleton, Crowhurst and Wray1999) and southeast India (Gale et al. Reference Gale, Kennedy and Walaszczyk2019b). The events involved sea-level fall and subsequent rise of c. 30 m over a relatively short timespan (200 kyr) based on observation of precession cycles (Gale, Reference Gale1995).
A sustained cooling phase that may even have resulted in ephemeral glaciations in Antarctica was also suggested for the MCE 1 based on a bulk carbonate δ18O increase in combination with sequence-stratigraphic evidence for a high-amplitude sea-level fall from the Contessa Quarry (Gubbio, Umbria–Marche Basin, Italy) and the New Jersey Coastal Plain (Stoll & Schrag, Reference Stoll and Schrag2000; Miller et al. Reference Miller, Sugarman, Browning, Kominz, Hernández, Olsson, Wright, Feigenson and Van Sickel2003, Reference Miller, Kominz, Browning, Wright, Mountain, Katz, Sugarman, Cramer, Christie-Blick and Pekar2005). Significant cooling pulses during the MCE 1 were determined from brachiopod shells from the mid-latitudinal shelf of Europe, including Folkestone, by Voigt et al. (Reference Voigt, Gale and Flögel2004) that, to the contrary, related it to major reorganization of ocean circulation in the North Atlantic that probably favoured increased oceanic ventilation and upwelling of nutrient-rich waters. Subsequently, the middle Cenomanian glaciation hypothesis was challenged by isotope records of glassy planktonic and benthic foraminifera that did not indicate a measurable ice volume signal in δ18O records across the MCE 1 (Moriya et al. Reference Moriya, Wilson, Friedrich, Erbacher and Kawahata2007; Ando et al. Reference Ando, Huber, MacLeod, Ohta and Khim2009).
2.d. Planktonic foraminifera
The Lydden Spout section was sampled for planktonic foraminiferal analyses using a sampling resolution of c. 50 cm from 26.70 to 42.75 m (Fig. 2). A total of 32 samples were processed following the standard procedure using hydrogen peroxide to obtain washed residues for micropaleontological analyses. Biostratigraphic and quantitative analyses were carried out for all the washed residues of the >125 μm size-fraction. In addition, the 125–38 μm size-fraction was scanned for marker species. Abundance counts of planktonic vs benthic foraminifera were made by microsplitting samples to obtain aliquots of equal volume for all samples, from which the foraminifera were counted (Supplementary Material Table S2).
Planktonic foraminiferal genera and species were identified according to holotypes and paratypes illustrated on the pforams@mikrotax portal (Huber et al. Reference Huber, Petrizzo, Young, Falzoni, Gilardoni, Bown and Wade2016, online taxonomic dictionary updated by the Mesozoic Planktonic Foraminifera Working Group, http://www.mikrotax.org/pforams/index.html) and in the Ellis and Messina Catalogues (Micropaleontology Press, http://www.micropress.org/em/). In addition, several publications were used to ameliorate the species identification (i.e. Caron & Spezzaferri, Reference Caron and Spezzaferri2006; Ando & Huber, Reference Ando and Huber2007; González-Donoso et al. Reference González-Donoso, Linares and Robaszynski2007; Desmares et al. Reference Desmares, Grosheny and Beaudoin2008; Georgescu, Reference Georgescu2009; Petrizzo et al. Reference Petrizzo, Caron and Premoli Silva2015; Huber et al. Reference Huber, Petrizzo and Falzoni2022). Biozonation follows Petrizzo and Gilardoni (Reference Petrizzo and Gilardoni2020).
3. Composition and distribution of the planktonic foraminiferal assemblage
The foraminiferal population in the size-fraction >125 μm is composed of planktonic and benthic foraminifera that are almost equally abundant, although the proportion of planktonic foraminifera as a percentage of the total foraminiferal assemblage (% P) shows values between 30 and 50 % in one-third of the samples and only in eight samples are planktonic foraminifera less than 30 % (% P: Fig. 2; Supplementary Material Table S2). However, planktonic foraminifera are always rare in the >250 μm size-fractions and they are totally absent at the base of the section from 26.70 to 29.30 m and within the upper part of the MCE 1 interval from 34.20 to 35.70 m (Fig. 2). An increase in total abundance of both benthic and planktonic foraminifera is observed from above 38 m, and the latter group exceeds 50 % of the foraminiferal assemblage in almost all samples (Fig. 2; Supplementary Material Table S2).
The planktonic foraminiferal assemblage shows poor to moderate preservation that improves toward the top of the studied section. Diversity ranges from 6 species near the base to 15 species at the top except for a minimum value of 5 species recorded in the upper part of the MCE 1 interval above the P. primus Bed (Fig. 2; Supplementary Material Table S2).
The most common and abundant species that consistently occur throughout the section are Muricohedbergella delrioensis, Pseudoclavihedbergella simplicissima, Praeglobotruncana stephani, Praeglobotruncana delrioensis, Praeglobotruncana cf. compressa and Whiteinella brittonensis (Table 1). Keeled rotaliporids show a scattered occurrence, are limited to the lower and the upper part of the studied section and are absent in the stratigraphic interval from 32.80 to 35.15 m within the MCE 1 interval (from the peak values of ∼2.5 ‰ in the C. arlesiensis Bed to the second peak value of ∼2.5 ‰ above the P. primus Bed). Thalmanninella reicheli and Thalmanninella micheli are only observed at 30.20 and 30.80 m, respectively. One specimen of Thalmanninella deckeei was present at 31.75 m (Table 1). The lowest occurrence of Rotalipora cushmani is recorded at 38.80 m and is preceded by forms that show intermediate features between Rotalipora montsalvensis and R. cushmani. Muricohedbergella portsdownensis have a restricted stratigraphic range from 25 cm above the base of MCE 1 at 31.75 m to 1.80 m above the termination of the MCE 1 at 37.80 m. The evolutionary appearance of the double-keeled Dicarinella is marked by the subsequent first occurrence of D. hagni within the MCE 1 at 33.25 m and of D. takayanagii at 38.80 m and of D. algeriana at 41.60 m. Helvetoglobotruncana praehelvetica is first observed at 38.80 m (Table 1).
Table 1. Distribution of planktonic foraminiferal species in the Lydden Spout section

4. Planktonic foraminifera biozonation
According to the composition of the assemblages and the position of the marker events, the stratigraphic interval from the base of the studied section at 26.70 m to 38.80 m is assigned to the Thalmanninella greenhornensis Zone, whereas the interval above is assigned to the Rotalipora cushmani Zone (Fig. 2). No specimens of T. greenhornensis were found in the assemblages; however, the occurrence of Whiteinella aprica from the base of the studied section (Table 1) demonstrates that the stratigraphic interval corresponds to the upper part of the T. greenhornensis zone following the biozonation by Petrizzo and Gilardoni (Reference Petrizzo and Gilardoni2020). This assignment is supported by the presence of a rare specimen of T. reicheli at 30.20 m, of R. montsalvensis that occurs from 27.80 m upwards, of Thalmanninella gandolfii first observed at 28.80, and of T. deckeei identified at 31.75 m (Fig. 2; Table 1).
5. Comparison with previous studies of the planktonic foraminiferal assemblages at Folkestone
Comparison of the data acquired in this study with those obtained in previous studies on the same stratigraphic sequence (Paul et al. Reference Paul, Mitchell, Marshal, Leary, Gale, Duane and Ditchfield1994; Mitchell & Carr, Reference Mitchell and Carr1998; Moghadam & Paul, Reference Moghadam and Paul2000) highlights some differences. In the present study, the appearance of R. cushmani is recorded at 38.80 m whereas it was first observed by Paul et al. (Reference Paul, Mitchell, Marshal, Leary, Gale, Duane and Ditchfield1994) above this level at c. 40.5 m. The difference is minor and is probably related to the different sampling resolution (1 m in Paul et al. Reference Paul, Mitchell, Marshal, Leary, Gale, Duane and Ditchfield1994 compared to 50 cm in this study), to the preservation of the specimens and to the rarity of the first representatives of R. cushmani. In fact, R. cushmani evolved from R. montsalvensis (González-Donoso et al. Reference González-Donoso, Linares and Robaszynski2007; Petrizzo & Gilardoni, Reference Petrizzo and Gilardoni2020) and occurs together with common specimens that are morphologically transitional with its ancestor, making the identification of the first R. cushmani sometimes difficult to detect (Ando et al. Reference Ando, Huber, MacLeod and Watkins2015; Erbacher et al. Reference Erbacher, Bornemann, Petrizzo and Huck2020).
A discrepancy is also observed in the stratigraphic range of T. reicheli which was found in only one sample below the MCE 1 level at 30.20 m in this study. Moghadam and Paul (Reference Moghadam and Paul2000) recorded T. reicheli at c. 30.5 m. Paul et al. (Reference Paul, Mitchell, Marshal, Leary, Gale, Duane and Ditchfield1994) reported T. reicheli from two samples below these levels at c. 28–29 m. By contrast, only Mitchell and Carr (Reference Mitchell and Carr1998) observed specimens related to T. reicheli (identified as Rotalipora ex gr. reicheli) discontinuously occurring from the base of the section to within the MCE 1 level at c. 34 m. These differences in the identification of T. reicheli are not surprising considering the known discontinuous occurrences and rarity of this species in many Tethyan localities (northern Israel: Lipson-Benitah et al. Reference Lipson-Benitah, Almogi-Labin and Sass1997; southern Spain, central Tunisia and northern Italy: Wonders, Reference Wonders1980; Poland: Peryt, Reference Peryt1983; Dubicka & Machalski, Reference Dubicka and Machalski2017) and in the western North Atlantic Ocean (Blake Nose: Bellier et al. Reference Bellier, Moullade, Huber, Kroon, Norris and Klaus2000), and its absence in the US Western Interior Seaway (Pessagno, Reference Pessagno1969; Eicher & Worstell, Reference Eicher and Worstell1970; Denne et al. Reference Denne, Hinote, Breyer, Kosanke, Lees, Engelhardt-Moore, Spaw and Tur2014; Eldrett et al. Reference Eldrett, Ma, Bergman, Lutz, Gregory, Dodsworth, Phipps, Hardas, Minisini, Ozkan, Ramezani, Bowring, Kamo, Ferguson, Macaulay and Kelly2015) and northern California (Douglas, Reference Douglas1969), that limit its reliability for intra- and inter-basin correlation. Favusella washitensis, observed by Paul et al. (Reference Paul, Mitchell, Marshal, Leary, Gale, Duane and Ditchfield1994) and Mitchell and Carr (Reference Mitchell and Carr1998) within the MCE 1 level at c. 34–35 m, has not been observed in this study.
A significant increase in the proportion of planktonic foraminifera was first recognized by Carter and Hart (Reference Carter and Hart1977) in the middle Cenomanian of southern England and northern France and was suggested to record a significant break in the succession; the so-called ‘mid-Cenomanian non-sequence’. Subsequently, the abrupt increase in abundance of planktonic foraminifera proved to be a useful marker horizon, named the P/B break (a level at which the proportion of planktonics increases from c. 5 % to as much as 50 %) by Paul et al. (Reference Paul, Mitchell, Marshal, Leary, Gale, Duane and Ditchfield1994), and also identified in other stratigraphic sections of the Anglo-Paris Basin (Mitchell et al. Reference Mitchell, Paul and Gale1996; Moghadam & Paul, Reference Moghadam and Paul2000), coinciding with the first occurrence of R. cushmani or falling close to the base of its stratigraphic range. In the Cenomanian of the Anglo-Paris Basin, values of % P in excess of 40 % have not been recorded below the appearance level of R. cushmani (Hart et al. Reference Hart, Bailey, Crittenden, Fletcher, Price and Sweicicki1989; Paul et al. Reference Paul, Mitchell, Marshal, Leary, Gale, Duane and Ditchfield1994) and only Mitchell and Carr (Reference Mitchell and Carr1998) reported % P higher than 40 % in the C. arliesiensis Bed at c. 32 m in the Folkestone section. By contrast, our data reveal that the abundance of planktonic foraminifera exceeds 50 % at only a few levels throughout the stratigraphic section studied (Fig. 2). The P/B break is placed at c. 40.5 m at Folkestone by Paul et al. (Reference Paul, Mitchell, Marshal, Leary, Gale, Duane and Ditchfield1994) and Moghadam and Paul (Reference Moghadam and Paul2000); we record a systematic increase of planktonic foraminifera with values higher than 50 % from above the termination of the MCE 1 interval at 37.80 to the top of the section, although in this interval some samples show lower % P values (23 to 34 %: Fig. 2; Supplementary Material Table S2). Therefore, we continue to use the term P/B break as employed in previous publications as we observe a cyclic alternation in abundance of the foraminiferal assemblages in the upper part of the section.
Paul et al. (Reference Paul, Mitchell, Marshal, Leary, Gale, Duane and Ditchfield1994) documented a decrease in size of rotaliporids and muricohedbergellids (=Hedbergella in Paul et al. Reference Paul, Mitchell, Marshal, Leary, Gale, Duane and Ditchfield1994) in the lower part of the MCE 1 interval from 31 to 34 m that has not been observed in the current study. The reasons for this discrepancy are difficult to explain in the absence of detailed information on how the decrease in size was measured by Paul et al. (Reference Paul, Mitchell, Marshal, Leary, Gale, Duane and Ditchfield1994) who analysed samples with 1 m resolution, examined the >250 μm size-fraction and only scanned the smaller size-fractions for smaller species. In the present study, samples were collected at 50 cm intervals and the size-fractions >125 μm were studied. Interestingly, we observed planktonic foraminifera larger than 250 μm only in the interval where Paul et al. (Reference Paul, Mitchell, Marshal, Leary, Gale, Duane and Ditchfield1994) observed the decrease in size (31 to 34 m); by contrast, the increase in size near the top of the section from 40 to 42 m (at the P/B break) shown by Paul et al. (Reference Paul, Mitchell, Marshal, Leary, Gale, Duane and Ditchfield1994) correlates with our data documenting an increase in abundance of planktonic foraminifera in the >250 μm size-fraction (Fig. 2).
6. Palaeoceanographic inferences
The planktonic foraminiferal assemblage in the middle Cenomanian at Folkestone is composed of common muricohedbergellids and praeglobotruncanids followed in abundance by whiteinellids, rotaliporids and dicarinellids. The palaeoenvironmental setting can be determined by considering the palaeoecological preferences of Cenomanian planktonic foraminiferal taxa which are mainly based on their stable isotope (δ18O and δ13C) composition, and on their biogeographic distributions across latitudes, with additional information provided by their abundances. Studies focused in near-coastal, hemipelagic and pelagic settings indicate that planktonic foraminifera may have tolerated variations in salinity levels and are capable of completing their life cycles in both shallow- and deeper-water environments (e.g. Leckie, Reference Leckie1987; Hart, Reference Hart1999; Huber et al. Reference Huber, Leckie, Norris, Bralower and CoBabe1999; Premoli Silva & Sliter, Reference Premoli Silva and Sliter1999; Bornemann & Norris, Reference Bornemann and Norris2007; Petrizzo et al. Reference Petrizzo, Huber, Wilson and MacLeod2008, Reference Petrizzo, Huber, Falzoni and MacLeod2020; Ando et al. Reference Ando, Huber and MacLeod2010).
According to the literature (see reviews in Petrizzo et al. Reference Petrizzo, Huber, Falzoni and MacLeod2020 and Falzoni & Petrizzo, Reference Falzoni and Petrizzo2022), Rotalipora and Thalmanninella inhabited cold/deep layers of the water column close to the thermocline, although with some differences observed among species and through time. Rotaliporids found in pelagic settings of the Tethyan Realm have been interpreted as oligotrophic, and thus required a relatively thick and stratified upper water column to complete their life cycle. Muricohedbergellids are adapted to relatively cold/deep layers of the water column in open ocean settings at low latitudes (Norris & Wilson, Reference Norris and Wilson1998; Wilson et al. Reference Wilson, Norris and Cooper2002; Petrizzo et al. Reference Petrizzo, Huber, Wilson and MacLeod2008; Ando et al. Reference Ando, Huber and MacLeod2010), but they may have inhabited shallower layers at the higher latitudes of the Southern Hemisphere, probably because sea-surface waters were cooler (Falzoni et al. Reference Falzoni, Petrizzo, Jenkyns and Gale2016; Petrizzo et al. Reference Petrizzo, Huber, Falzoni and MacLeod2020, Reference Petrizzo, Watkins, MacLeod, Hasegawa, Huber, Batenburg and Kato2021, Reference Petrizzo, MacLeod, Watkins, Wolfgring and Huber2022a,b). Moreover, muricohedbergellids are commonly found in low-salinity coastal environments to normal-salinity open-ocean settings, indicating they had an opportunist meso-eutrophic life strategy (e.g. Leckie, Reference Leckie1987, Reference Leckie, Yuretrich, West, Finkelstein and Schmidt1998; Hart, Reference Hart1999; Premoli Silva & Sliter, Reference Premoli Silva and Sliter1999). Praeglobotruncana species have been interpreted as intermediate- or winter mixed-layer dwellers (Petrizzo et al. Reference Petrizzo, Huber, Wilson and MacLeod2008, Reference Petrizzo, Huber, Falzoni and MacLeod2020; Falzoni et al. Reference Falzoni, Petrizzo, Jenkyns and Gale2016), and adapted to cool and poorly stratified surface waters (Ando et al. Reference Ando, Huber and MacLeod2010). Dicarinella were adapted to cold waters and lived close to the permanent thermocline in different localities at low to middle latitudes (Huber et al. Reference Huber, Leckie, Norris, Bralower and CoBabe1999; Wendler et al. Reference Wendler, Huber, MacLeod and Wendler2013; Falzoni et al. Reference Falzoni, Petrizzo, Jenkyns and Gale2016; Petrizzo et al. Reference Petrizzo, Huber, Falzoni and MacLeod2020). Data from the Southern Hemisphere indicate a shallower habitat at higher latitudes (Petrizzo et al. Reference Petrizzo, Huber, Falzoni and MacLeod2020, Reference Petrizzo, Watkins, MacLeod, Hasegawa, Huber, Batenburg and Kato2021, Reference Petrizzo, MacLeod, Watkins, Wolfgring and Huber2022a,b). Therefore, water depth, ocean circulation patterns (e.g. currents) and boundaries between different water masses (Schiebel & Hemleben, Reference Schiebel and Hemleben2017) are the main factors controlling the presence or absence of taxa in ecological niches. Other ecological factors are the thickness of the mixed layer, the position and stability of the thermocline, trophic conditions, and salinity (e.g. Hart, Reference Hart1999; Abramovich et al. Reference Abramovich, Keller, Stüben and Berner2003; Ando et al. Reference Ando, Huber, MacLeod, Ohta and Khim2009, Reference Ando, Huber and MacLeod2010; Falzoni et al. Reference Falzoni, Petrizzo, MacLeod and Huber2013, Reference Falzoni, Petrizzo, Jenkyns and Gale2016; Petrizzo et al. Reference Petrizzo, Jiménez Berrocoso, Falzoni, Huber and MacLeod2017; and discussions therein).
Our knowledge of the palaeoecological preferences of planktonic foraminifera coupled with their abundance and distribution is consistent with a palaeoceanographic scenario at Folkestone that implies changes in circulation patterns. Specifically, in the MCE 1 interval the absence of the thermocline-dwelling oligotrophic rotaliporids is balanced by the appearance of the intermediate-depth and cold-water adapted dicarinellids. Moreover, the assemblage is characterized by the relatively high abundance of the eutrophic–mesotrophic Praeglobotruncana and Muricohedbergella. Interestingly, M. portsdownensis, a species also documented as occurring in the middle Cenomanian record of the North German Basin at Wünstorf (Erbacher et al. Reference Erbacher, Bornemann, Petrizzo and Huck2020), shows a stratigraphic distribution limited to the carbon isotope excursion identifying the MCE 1 at Folkestone. The species first appears in the C. arlesiensis Bed at the same level of the occurrence of Boreal macrofossils species and coincident with a positive δ18O shift of 1 ‰ and disappears slightly after the termination of the MCE 1 at the level (37.80 m) that records the increase in % P and the appearance of the intermediate forms between R. montsalvensis and R. cushmani (Fig. 2). According to the observed record we infer that M. portsdownensis had a meso-eutrophic life strategy, proliferated in cold water and is probably a Boreal species. However, further studies are needed to confirm the stratigraphic and geographical distribution of this species which has rarely been mentioned in the literature, and, as discussed in the Taxonomic remarks section further below, additional studies are required to investigate its possible synonymy with Muricohedbergella kyphoma, a species coinciding with the coldest episode (Falzoni & Petrizzo, Reference Falzoni and Petrizzo2022) of the late Cenomanian Plenus Cold Event (PCE).
7. Remarks on the cooling pulses within the MCE 1 and comparison with the Plenus Cold Event (PCE)
At Lydden Spout, and in other sections in the Anglo-Paris Basin, the occurrence of Boreal benthic macrofossils (C. arlesiensis, O. seminudum and P. primus) is recorded within the MCE 1 δ13C excursion (Paul et al. Reference Paul, Mitchell, Marshal, Leary, Gale, Duane and Ditchfield1994; Gale, Reference Gale1995) and coincides with a positive excursion in δ18O (Voigt et al. Reference Voigt, Gale and Flögel2004; Gale & Kennedy, Reference Gale and Kennedy2021) and isotopically light neodymium values (Zheng et al. Reference Zheng, Jenkyns, Gale, Ward and Henderson2016). The shelf–sea cooling pulses observed within the MCE 1 at the C. arlesiensis Bed and P. primus Bed by Voigt et al. (Reference Voigt, Gale and Flögel2004) were interpreted as coinciding with transgressive phases during a major third-order sea-level lowstand and reflecting a major reorganization of the North Atlantic circulation.
Our new oxygen-isotope data (bulk chalk) through MCE 1 at Lydden Spout (Fig. 2; Supplementary Material Table S1) show a heavy shift of c. 1 ‰ in the C. arlesiensis Bed. This level is precisely coincident with the base of the MCE 1 carbon-isotope excursion, the occurrence of Boreal macrofossils, the disappearance of rotaliporids and the appearance of M. portsdownensis. This change translates into a cooling of c. 4 °C (temperature equation of Anderson & Arthur, Reference Anderson, Arthur, Arthur, Anderson, Kaplan, Vizier and Land1983), probably in sea-surface waters as the values are derived from calcareous nannofossils in the bulk sediment. Brachiopod shells through the C. arlesiensis Bed (Gale & Kennedy, Reference Gale and Kennedy2021, fig. 6) also show a 1 ‰ heavy shift in δ18O, but to values which are consistently 1 ‰ heavier than those from the bulk sediment record. These data thus provide evidence of a significant temperature gradient from the surface to the sea floor (c. 4° C) in the middle Cenomanian Chalk Sea. The fluctuating values of δ18O coincide precisely with the boundaries of chalk:marl couplets, and heavier values are consistently present in the marls, lighter values in chalks. The absolute heavy values of δ18O decrease progressively in the three couplets succeeding the C. arlesiensis Bed (Fig. 2). The couplets have been identified as precession cycles (Gale et al. Reference Gale, Young, Shackleton, Crowhurst and Wray1999) and it can therefore be argued that orbital forcing was a primary control on the fluctuating temperature values.
The cold-water planktonic foraminiferal assemblages occurring in the MCE 1 interval indicate the presence of poorly thermally stratified water masses characterized by a reduced/collapsed thermocline that disrupted the ecological niches of the oligotrophic rotaliporids which, thus, are totally absent in the MCE 1 interval at Folkestone (Fig. 2). Keeled planktonic foraminifera are also absent across the MCE 1 interval identified in the Boreal North German Basin at Wünstorf, and their absence was controlled by sea-level changes in an epicontinental sea where environmental conditions were unsuitable for keeled planktonic foraminiferal species (Erbacher et al. Reference Erbacher, Bornemann, Petrizzo and Huck2020).
Together, these observations indicate that the enhanced influence of Boreal seawater in the European epicontinental sea resulted in a sensitive response of ocean circulation to climate fluctuations and support the hypothesis of the inflow into the Anglo-Paris seaway of cold Boreal waters originating in the Norwegian Sea (Fig. 3). A similar interpretation was proposed to explain the planktonic foraminiferal assemblage changes and the occurrence of the Boreal macrofauna C. arlesiensis, O. seminudum and P. plenus in the PCE interval at Eastbourne (UK) (O’Connor et al. Reference O’Connor, Remmelzwaal, Robinson, Batenburg, Jenkyns, Parkinson and Gale2019; Falzoni & Petrizzo, Reference Falzoni and Petrizzo2022).

Fig. 3. Palaeogeographic reconstruction (Scotese, Reference Scotese2016) for the middle Cenomanian (96 Ma) with location of Folkestone (UK) and Wünstorf (Germany). The blue arrow shows the inferred inflow into the Anglo-Paris seaway and North German Basin of cold Boreal waters.
Comparison between the planktonic foraminiferal assemblages during the cooling episodes within the MCE 1 and those occurring at the PCE reveals a similar composition, with dominance of taxa more adapted to cooler and relatively poorly stratified water masses (Muricohedbergella, Praeglobotruncana, Dicarinella). Additional evidence for a Boreal origin of these assemblages is provided by the occurrence of common M. portsdownensis at Folkestone and M. kyphoma at Eastbourne (Falzoni & Petrizzo, Reference Falzoni and Petrizzo2022). Regardless of the taxonomic assignments of these species (as explained in the Taxonomic remarks section further below), they are only observed in the levels containing Boreal macrofossils and are therefore interpreted as mesotrophic–eutrophic species that did not require a thermally stratified water column. The absence of oligotrophic rotaliporids in the MCE 1 interval at Folkestone and the extinction in the PCE interval of R. cushmani (the last representative of the rotaliporid group) are probably related to the ingress of cold Boreal waters that temporally disrupted the stratified oligotrophic water column. Therefore, the equatorward expansion of the Boreal macrofossils and the dominance of cold-water and meso-eutrophic planktonic foraminifera observed at the MCE 1 and PCE may reflect cyclic latitudinal shifts of the proto-Arctic Front of c. 10–20° that forced a major reorganization of the surface and deep ocean circulation patterns in the middle and late Cenomanian (Zheng et al. Reference Zheng, Jenkyns, Gale, Ward and Henderson2016; Falzoni & Petrizzo, Reference Falzoni and Petrizzo2022). Using an orbitally tuned dataset, Batenburg et al. (Reference Batenburg, de Vleesschouwer, Sprovieri, Hilgen, Gale, Singer, Koeberl, Coccioni, Claeys and Montinari2016) suggested that the MCE 1 and OAE 2 carbon isotope events were driven by the long eccentricity cycle (mode at 2.4 Ma) with positive excursions coincident with minima. In parallel, the southerly extensions of cold Boreal water during the MCE 1 and the PCE may also have been caused by long eccentricity-driven reorganization of ocean circulation.
8. Conclusions
Planktonic foraminifera at Folkestone were studied across the MCE 1 positive δ13C excursion and are correlated with the occurrence of Boreal macrofossils and of heavy δ18O excursions in bulk carbonate values, indicating a cooling of c. 4 °C. In general, planktonic foraminifera stratigraphically below the MCE 1 level indicate a pelagic epicontinental environment characterized by a stratified water column with a well-defined mixed layer and a thin thermocline, as confirmed by the occurrence of both surface- and deep-water dwelling taxa. This palaeoenviromental setting is interrupted at the onset of the δ13C excursion of the MCE 1 as revealed by changes in the composition of the planktonic foraminiferal assemblage and in the stratigraphic distribution of species. The double-keeled Dicarinella first evolved within the MCE 1, indicating the availability of favourable ecological niches in a thick mixed layer. By contrast, the total absence of the single-keeled rotaliporids within the MCE 1 interval is interpreted to reflect a substantial disruption of water mass stratification and of the ecological niches occupied by the thermocline-dwelling oligotrophic rotaliporids. Cooling phases within the MCE 1 are also confirmed by the occurrence of the Boreal macrofossils C. arlesiensis, O. seminudum and P. primus, the occurrences of which identify the C. arlesiensis Bed and P. primus Bed. Remarkable is the appearance of the species M. portsdownensis at the base of the MCE 1 interval at the same level of the occurrence of Boreal benthic macrofossils (C. arlesiensis Bed). This observation suggests that M. portsdownensis was a surface and cold-water dweller and it is probably a useful middle Cenomanian marker species that permits identification of the MCE 1 interval. After the termination of the perturbation associated with the MCE 1, planktonic foraminifera increase in abundance and species richness as testified by the occurrence of keeled and deep-water species, indicating the return of a stratified water column with a mixed layer and well-defined thermocline.
Overall, the planktonic foraminiferal assemblages recorded in the MCE 1 interval reflect conditions of eutrophy associated with cold surface waters. In addition, the occurrence of Boreal benthic fauna associated with heavy oxygen isotope excursions provides evidence of cooling episodes which might coincide with transgressive mixing over the epicontinental Anglo-Paris Basin. These falls in temperature possibly resulted from the southerly extension of cold Boreal low-salinity and poorly stratified water masses which originated in the Norwegian Sea, as previously postulated to explain the occurrence of Boreal macrofossils within the positive δ13C excursion that identifies MCE 1. Finally, similarities in the composition of benthic macrofossils and planktonic foraminiferal assemblages, and in the heavy oxygen isotope excursions which occurred during the MCE 1 and the PCE, suggest that two latitudinal shifts of the proto-Arctic Front of c. 10–20° took place in these intervals. The changes may be related to orbital configurations driven by long eccentricity maxima (cf. Batenburg et al. Reference Batenburg, de Vleesschouwer, Sprovieri, Hilgen, Gale, Singer, Koeberl, Coccioni, Claeys and Montinari2016).
9. Taxonomic remarks
Foraminifera genera and species with authors and years identified in the studied sediments (Table 1) are listed in alphabetical order and comments are included for some species so as to clarify the taxonomic concepts followed in this study. Remarks on significant morphological and evolutionary features are provided when necessary. Selected species are illustrated in Figs. 4–7.

Fig. 4. Scanning electron microscope (SEM) images of planktonic foraminifera. 1a–c, Rotalipora cushmani, sample A+11. 2a–c, Rotalipora cushmani, sample A+10.5. 3a–c, Rotalipora cushmani, sample A+9. 4a–c, Rotalipora cushmani, sample A+7. 5a–c, intermediate form between Rotalipora montsalvensis and Rotalipora cushmani, sample A+6. 6a–c, Rotalipora montsalvensis, sample A+4. 7a–c, Rotalipora montsalvensis, sample A 0. 8a–c, Rotalipora praemontsalvensis, sample A−-4. 9a–c, Thalmanninella micheli, sample A−1. 10a–c, Thalmanninella reicheli, sample A−1.5. a, umbilical view; b, side view; c, spiral view.
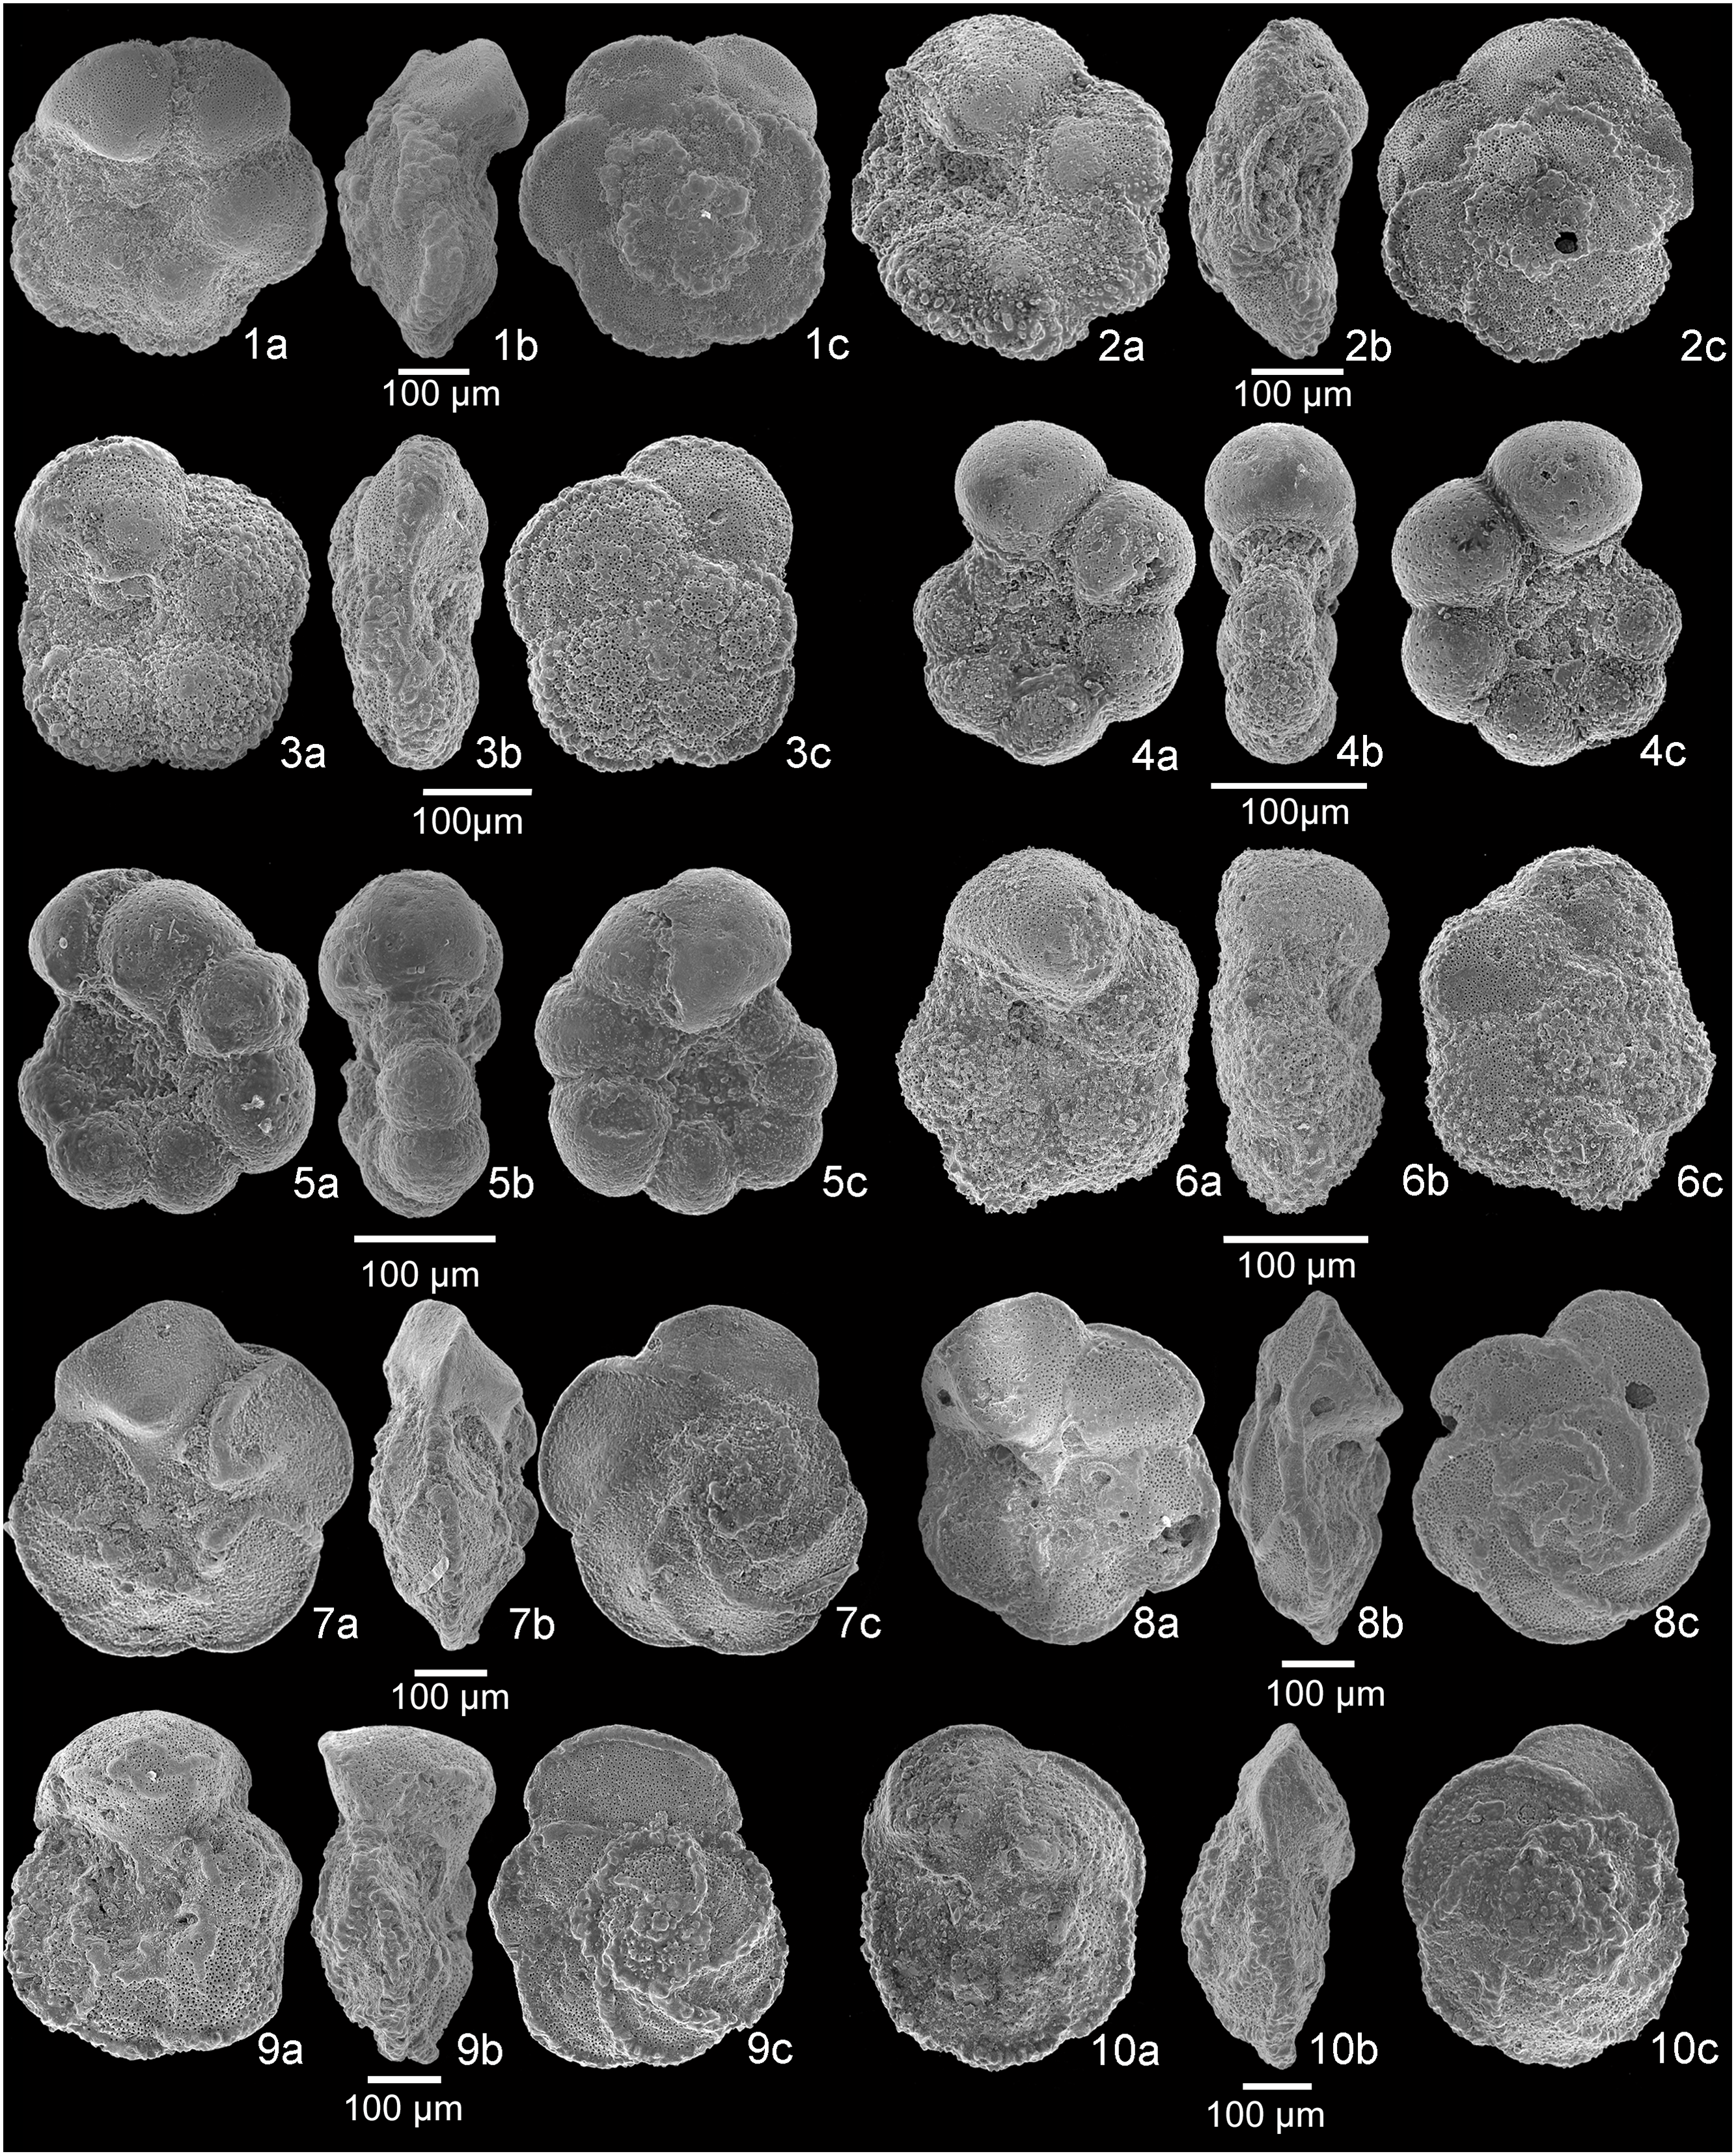
Fig. 5. SEM images of planktonic foraminifera. 1a–c, Dicarinella hagni, sample A+10.5. 2a–c, Dicarinella algeriana, sample A+11. 3a–c, Dicarinella takayanagii, sample A+10. 4a–c, Laeviella bentonensis, sample A+11. 5a–c, Laeviella bentonensis, sample A+1.5. 6a–c, Helvetoglobotruncana praehelvetica, sample A+7. 7a–c, Thalmanninella globotruncanoides, sample A+10. 8a–c, Thalmanninella globotruncanoides, sample A+9.5. 9a–c, Thalmanninella gandolfii, sample A−2. 10a–c, Thalmanninella brotzeni, sample A+6. a, umbilical view; b, side view; c, spiral view.
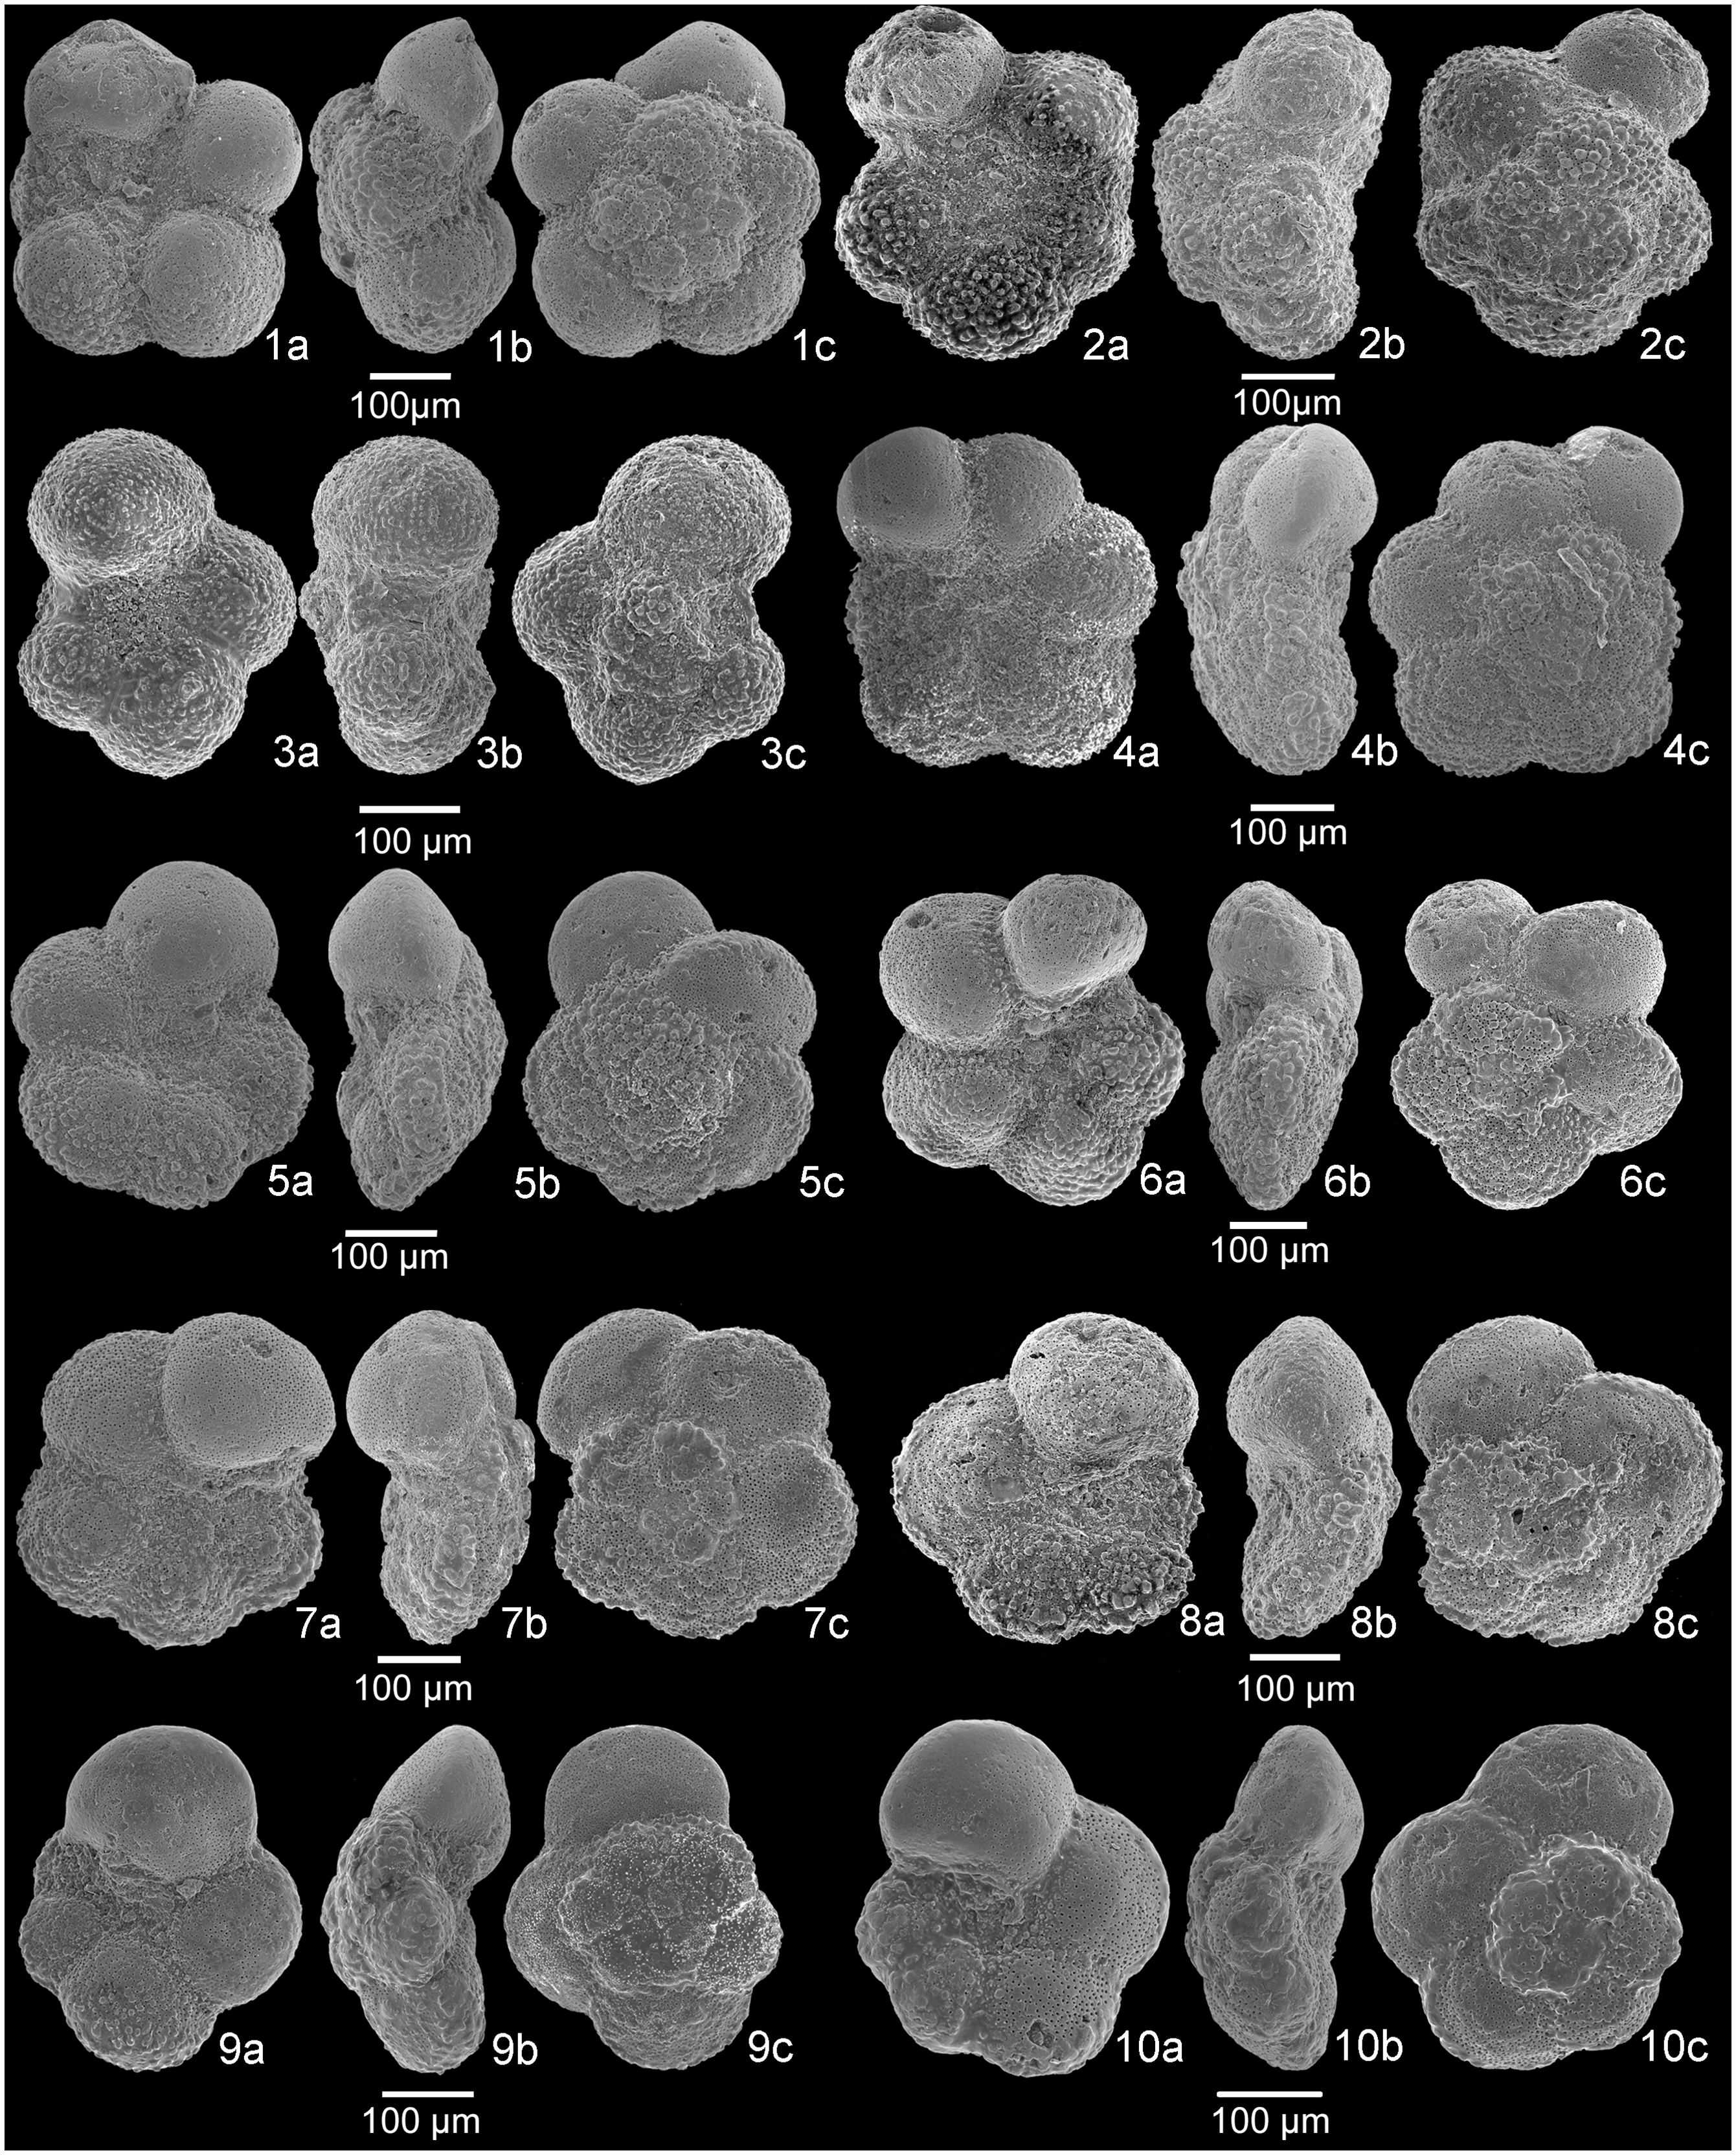
Fig. 6. SEM images of planktonic foraminifera. 1a–c, Whiteinella brittonensis, sample A+7.5. 2a–c, Whiteinella paradubia, sample A 0. 3a–c, Whiteinella baltica, sample A−5. 4a–c, Whiteinella aumalensis, sample A+8.5. 5a–c, Praeglobotruncana stephani, sample A+10.5. 6a–c, Praeglobotruncana oraviensis, sample A 0. 7a–c, Praeglobotruncana delrioensis, sample A−1.5. 8a–c, Praeglobotruncana delrioensis, sample A+6. 9a–c, Praeglobotruncana cf. compressa, sample A+5.5. 10a–c, Praeglobotruncana cf. compressa, sample A+0.5. a, umbilical view; b, side view; c, spiral view.

Fig. 7. SEM images of planktonic foraminifera. 1a–c, Pseudoclavihedbergella simplicissima, sample A−4. 2a–c, Muricohedbergella planispira, sample A+5. 3a–c, Muricohedbergella delrioensis, sample A+11. 4a–c, Muricohedbergella crassa, sample A−5. 5a–c, Globigerina portsdownensis, illustrated holotype P 38283 (repository Natural History British Museum) from Williams-Mitchell (Reference Williams-Mitchell1948). 6a–c, Muricohedbergella portsdownensis, holotype P 38283 (image from www.mikrotax.org). 7a–c, Muricohedbergella portsdownensis, sample A+5. 8a–d, Muricohedbergella portsdownensis, sample A+5.5. 9a–c, Muricohedbergella portsdownensis, sample A+4. 10a–c, Muricohedbergella portsdownensis, sample A+3. a, umbilical view; b, side view; c, spiral view; d, detail.
Genus Dicarinella Porthault, Reference Porthault1970.
Type species: Globotruncana indica Jacob & Sastry, Reference Jacob and Sastry1950, p. 267, fig. 2A–C.
Dicarinella algeriana (Caron, Reference Caron1966), pp. 74–5, pl. 16, fig. 8 (lower Turonian, Sidi Aïssa, Algeria).
Dicarinella hagni (Scheibnerova, Reference Scheibnerova1962), pp. 225–6, fig. 6 (middle Turonian, Horné Srnie, west Carpathians, Czechoslovakia).
Dicarinella takayanagii Hasegawa, Reference Hasegawa1999, p. 187, fig. 8, fig. 3A–C (uppermost Cenomanian, Takinosawa Formation, Hokkaido, Japan).
Genus Helvetoglobotruncana Reiss, Reference Reiss1957.
Type species: Globotruncana helvetica Bolli, Reference Bolli1945, pp. 226, 227, pl. 9, figs 6–8 (middle Turonian, ‘Knollen-Schichten’, eastern Switzerland).
Helvetoglobotruncana praehelvetica (Trujillo, Reference Trujillo1960) p. 340, pl. 49, fig. 6 (early Turonian, California).
Genus Laeviella Huber, Petrizzo & Falzoni, Reference Huber, Petrizzo and Falzoni2022.
Type species: Anomalina bentonensis Morrow, Reference Morrow1934, p. 201, pl. 30, figs 4a–b (Cenomanian, Hartland Member of Greenhorn Limestone of Kansas).
Laeviella bentonensis (Morrow, Reference Morrow1934), p. 201, pl. 30, figs 4a–b (Cenomanian, Hartland member of Greenhorn Limestone of Kansas).
Remarks. Previously included in Globigerinelloides, see taxonomic revision in Huber et al. (Reference Huber, Petrizzo and Falzoni2022).
Genus Muricohedbergella Huber and Leckie (Reference Huber and Leckie2011).
Type species: Globigerina cretacea var. delrioensis Carsey (Reference Carsey1926, pp. 43–4).
Muricohedbergella crassa (Bolli, Reference Bolli1959), p. 265, figs 1–2 (Upper Cretaceous, Naparima Hill formation, Trinidad).
Muricohedbergella delrioensis (Carsey, Reference Carsey1926), pp. 43–4 (lower Cenomanian, Del Rio Clay, Grayson Formation, Austin, TX).
Muricohedbergella planispira (Tappan, Reference Tappan1940), p. 12, pl. 19, fig. 12 (Cenomanian, Grayson Formation, Denton County, TX).
Muricohedbergella portsdownensis (Williams-Mitchell, Reference Williams-Mitchell1948), p. 96, pl. 8, fig. 4 (Cenomanian, Portsdown No. 1 well, Hampshire, England).
Remarks. It is an overlooked species rarely reported in the literature (Loeblich & Tappan, Reference Loeblich and Tappan1961; Pessagno, Reference Pessagno1967; Douglas & Rankin, Reference Douglas and Rankin1969; Hermes, Reference Hermes1969; Eicher & Worstell, Reference Eicher and Worstell1970). The species was discussed by Carter and Hart (Reference Carter and Hart1977) who inspected the holotype and regarded it as falling into the species variability of Hedbergella delrioensis. Moreover, Carter and Hart (Reference Carter and Hart1977) included in Whiteinella brittonensis the specimens previously identified as portsdownensis by reason of having a high trochospire. The examination of the image of the holotype reproduced in Fig. 7(5a–c) confirms that portsdownensis is morphologically very similar to W. brittonensis, but in our opinion it differs by having a low trochospire and a slightly muricate wall texture instead of heavy pustules and by having the last two chambers of the final whorl smooth. Recently, M. portsdownensis was identified by Erbacher et al. (Reference Erbacher, Bornemann, Petrizzo and Huck2020) in the North German Basin occurring in the stratigraphic interval across the MCE.
Muricohedbergella portsdownensis is very similar to Muricohedbergella kyphoma, a species described from Japan (Hasegawa, Reference Hasegawa1999) as occurring discontinuously from below the first appearance of Rotalipora cushmani to above the extinction of R. cushmani. The species has been recognized within the Plenus Cold Event (PCE) at Eastbourne and Clot Chevalier (Gale et al. Reference Gale, Jenkyns, Tsikos, van Breugel, Sinninghe Damsté, Bottini, Erba, Russo, Falzoni, Petrizzo, Dickson and Wray2019a) by Falzoni & Petrizzo (Reference Falzoni and Petrizzo2020, Reference Falzoni and Petrizzo2022) in the interval recording the extinction of R. cushmani and the occurrence of the Boreal macrofossils (C. arlesiensis and P. plenus), and thus interpreted as a marker species indicative of the coolest episodes of the PCE.
Muricohedbegella portsdownensis and M. kyphoma are here regarded as separate species although the possibility that they are morphotypes of the same species cannot be excluded since they show a similar muricate and pustulose wall texture and only differ by the sutures on the ultimate chambers of the spiral side that are curved in M. kyphoma and straight in M. portsdownensis. However, for the time being, we separate the two species until detailed stratophenetic studies of the planktonic foraminiferal assemblages are performed in stratigraphic sections containing a continuous record from the interval below the MCE 1 to the interval above the PCE in order to investigate the timing and the mode in the evolution and distribution of the two species.
Genus Planohedbergella Boudagher-Fadel, Banner, Whittaker & McCarthy, Reference BouDagher-Fadel, Banner, Whittaker and Simmons1997, in BouDagher-Fadel et al. (Reference BouDagher-Fadel, Banner, Whittaker and Simmons1997), emended Huber et al. (Reference Huber, Petrizzo and Falzoni2022).
Type species: Planomalina ehrenbergi Barr, Reference Barr1962 [=Planomalina yaucoensis Pessagno Reference Pessagno1960].
Planohedbergella ultramicra (Subbotina, Reference Subbotina1949), p. 33, pl. 2, figs 17–18 (Cenomanian, Kapustnaya Gorge, southern slope of Caucasus, Russia).
Remarks. Previously included in Globigerinelloides, see taxonomic revision in Huber et al. (Reference Huber, Petrizzo and Falzoni2022).
Genus Planoheterohelix Georgescu and Huber (Reference Georgescu and Huber2009).
Type species: Planoheterohelix postmoremani Georgescu and Huber (Reference Georgescu and Huber2009), p. 346, pl. 5, figs 1–11.
Planoheterohelix moremani (Cushman, Reference Cushman1938), p. 10, pl. 2, figs 1, 2 (Cenomanian, Eagle Ford Shale, Texas, USA).
Genus Praeglobotruncana Bermudez (Reference Bermudez1952).
Type species: Globorotalia delrioensis Plummer (Reference Plummer1931), p. 199, pl. 13, fig. 2.
Praeglobotruncana compressa Hasegawa (Reference Hasegawa1999), p. 181, fig. 5, 5A–C (upper Cenomanian, Takinosawa Formation, Hokkaido, Japan).
Remarks. The specimens identified in this study as P. cf. compressa closely resemble the holotype of P. compressa and only differ by having a slightly high trochospire and a biconvex lateral profile.
Praeglobotruncana delrioensis (Plummer, Reference Plummer1931), p. 199, pl. 13, fig. 2 (Lower Cretaceous, Del Rio Formation, on right bank of Shoal Creek, Austin, Travis Country, TX).
Praeglobotruncana stephani (Gandolfi, Reference Gandolfi1942), p. 130, pl. 3, fig. 4 (Cenomanian, Gorge of the Breggia River, near Chiasso, southeastern Switzerland).
Praeglobotruncana gibba Klaus (Reference Klaus1960), pp. 209, 304–5, pl. 16–17, fig. 6a–c (Cenomanian, Gorge of the Breggia River, near Chiasso, southeastern Switzerland).
Praeglobotruncana oraviensis Scheibnerova (Reference Scheibnerova1960), p. 87, tf. 4A–C (lower Turonian, Czechoslovakia).
Genus Pseudoclavihedbergella Georgescu (Reference Georgescu2009).
Type species: Hedbergella amabilis Loeblich and Tappan (Reference Loeblich and Tappan1961), p. 274, pl. 3, figs 1–10.
Pseudoclavihedbergella amabilis Loeblich and Tappan (Reference Loeblich and Tappan1961), p. 274, pl. 3, figs 1–10 (Cenomanian, Britton Clay, Eagle Ford Group, Texas).
Pseudoclavihedbergella simplicissima (Magné & Sigal, Reference Magné and Sigal1954), p. 487, pl. 14, fig. 11 (lower Cenomanian, Rhazouane, Tunisia).
Genus Rotalipora Brotzen (Reference Brotzen1942).
Type species: Rotalipora turonica Brotzen (Reference Brotzen1942), p. 32, text-fig. 11–4, = Globorotalia cushmani Morrow (Reference Morrow1934), p. 199, pl. 31, fig. 4.
Rotalipora cushmani (Morrow, Reference Morrow1934), p. 199, pl. 31, fig. 4 (Upper Cretaceous, Hodgeman County, Kansas, USA).
Rotalipora montsalvensis (Mornod, Reference Mornod1950), p. 584, fig. 4(1) (upper Cenomanian, Ruisseau des Covayes, southern east slope of the Montsalvens chain, north of Cerniat, Préalpes fribourgeoises, Switzerland).
Remarks. This study supports previous interpretation that R. montsalvensis is the ancestor species of R. cushmani (González-Donoso et al. Reference González-Donoso, Linares and Robaszynski2007; Petrizzo & Gilardoni, Reference Petrizzo and Gilardoni2020) as transitional specimens between the two species were observed.
Rotalipora praemontsalvensis Ion (Reference Ion1976), pp. 43–4, figs 1–4 (middle Cenomanian, Western Carpathians, Romania).
Genus Thalmanninella Sigal (Reference Sigal1948).
Type species: Thalmanninella brotzeni Sigal (Reference Sigal1948), p. 102, pl. 1, fig. 5.
Thalmanninella brotzeni Sigal (Reference Sigal1948), p. 102, pl. 1, fig. 5 (middle Cenomanian, Sidi Aïssa, Algeria).
Remarks. Considered a junior synonym of Th. globotruncanoides for a long time (Robaszynski & Caron, Reference Robaszynski and Caron1995; Gale et al. Reference Gale, Kennedy, Burnett, Caron and Kidd1996; Ando & Huber, Reference Ando and Huber2007; González-Donoso et al. Reference González-Donoso, Linares and Robaszynski2007; Lipson-Benitah, Reference Lipson-Benitah2008; Robaszynski et al. Reference Robaszynski, Amédro, González-Donoso and Linares2008) until Caron & Premoli Silva (Reference Caron and Premoli Silva2007) and Petrizzo et al. (Reference Petrizzo, Caron and Premoli Silva2015) demonstrated they are two distinct species.
Thalmanninella deeckei (Franke, Reference Franke1925), pp. 88–90, pl. 8, fig. 7 (Cenomanian, Jordanshutte auf Wollin, Pommern, Germany).
Thalmanninella gandolfii (Luterbacher & Premoli Silva, Reference Luterbacher and Premoli Silva1962), p. 267, pl. 19, fig. 3 (Gorge of the Breggia River, Canton Ticino, southeastern Switzerland).
Thalmanninella globotruncanoides Sigal (Reference Sigal1948), p. 100, pl. 1, fig. 4 (middle Cenomanian, Sidi Aïssa, Algeria).
Remarks. The description of the species was emended in Petrizzo et al. (Reference Petrizzo, Caron and Premoli Silva2015).
Thalmanninella micheli (Sacal & Debourle, Reference Sacal and Debourle1957), p. 58, pl. 25, figs 4–5 (Upper Cretaceous, Bidache, Aquitaine, France).
Thalmanninella reicheli (Mornod, Reference Mornod1950), p. 583, fig. 5(4) (upper Cenomanian, Ruisseau des Covayes, southern east slope of the Montsalvens chain, north of Cerniat, Préalpes fribourgeoises, Switzerland).
Remarks. Neotype described and illustrated by Caron and Spezzaferri (Reference Caron and Spezzaferri2006).
Genus Whiteinella Pessagno (Reference Pessagno1967).
Type species: Whiteinella archaeocretacea Pessagno (Reference Pessagno1967), pp. 298–9, pl. 51, figs 22–24.
Whiteinella aumalensis (Sigal, Reference Sigal1952), p. 28, fig. 29 (middle Cenomanian, probably Aumale, southeast of Algiers, northern Algeria).
Whiteinella aprica (Loeblich & Tappan, Reference Loeblich and Tappan1961), p. 292, pl. 4, fig. 16 (Cenomanian, US Highway 80, west of Dallas, Texas).
Whiteinella baltica Douglas and Rankin (Reference Douglas and Rankin1969), p. 193, pl. 9, figs A–C (lower Santonian, east of Bavnodde Pynt, Bornholm, Denmark).
Whiteinella brittonensis (Loeblich & Tappan, Reference Loeblich and Tappan1961), p. 274, pl. 4, fig. 1 (Cenomanian, Eagle Ford Group, west of Cedar Hills, Dallas County, Texas).
Whiteinella paradubia (Sigal, Reference Sigal1952), p. 28, fig. 28 (Cenomanian, probably northern Algeria).
Supplementary material
To view supplementary material for this article, please visit https://doi.org/10.1017/S0016756822000991
Acknowledgements
MRP acknowledges financial support by the Italian Ministry of University and Research (MUR) ‘Dipartimenti di Eccellenza 2018–2022, Le Geoscienze per la Società: Risorse e loro evoluzione’. S Crespi is thaked for assistance at the SEM. Open Access funding provided by the Università degli Studi di Milano within the CRUI-CARE Agreement. We thank the editor B Van de Schootbrugge, HC Jenkyns and an anonymous reviewer for their careful revisions and thoughtful comments and suggestions that greatly improved the quality of this manuscript. WJ Kennedy is warmly thanked for his useful comments on an earlier version of the manuscript.
Conflict of interest
None.


 Open access