


1. Introduction
Studies on the inheritance of fertility play an important role in crop breeding. Substantial progress has been achieved in the genetic mechanism of male sterility and fertility restoration. More than 70 kinds of wheat male sterile lines, such as the T, K, V, D, A and P types of the cytoplasmic male sterile line and genic male sterile line, have been identified (Kihara, Reference Kihara1951; Liang & Wang, Reference Liang and Wang2003; Cao et al., Reference Cao, Guo, Liu, Zhang and Zhang2004). Several genes controlling male sterility, including some photo-thermo-sensitive male sterility genes, have been genetically characterized by quantitative trait loci (QTLs) mapping approach (Tan et al., Reference Tan, Yu and Yang1992; Wang, Reference Wang, Li and Zhou1996; Rong et al., Reference Rong, Cao, Tu and Gao1999; Xing et al., Reference Xing, Ru, Zhou, Liang, Yang, Jin and Wang2003; Guo et al., Reference Guo, Sun, Tan, Rong and Li2006). Meanwhile, many female sterile lines in barley (Ahokas, Reference Ahokas1977), wheat (Gotzov, Reference Gotzov1979), rice (Ling et al., Reference Ling, Ma, Chen and Chen1991), sugar beet (Jassem, Reference Jassem1971), pearl millet (Hanna & Powell, Reference Hanna and Powell1973) and roselle (Vaidya, Reference Vaidya1994) have been found; many studies have been reported, which isolated and characterized the female sterility genes in Arabidopsis (Wilson & Yang, Reference Wilson and Yang2004; Watanabe, Reference Watanabe2008) and rice (Chen et al., Reference Chen, Ding, Ouyang, Du, Yang, Cheng, Zhao, Qiu, Zhang, Yao, Liu, Wang, Xu, Li, Xue, Xia, Ji, Lu, Xu and Zhang2008); and several epistatic QTLs responsible for female sterility have been detected in the studies of rice hybrid sterility (Kubo & Yoshimura, Reference Kubo and Yoshimura2005). However, little effort has been devoted to female sterility in wheat. Therefore, investigating the genetic mechanism of female sterility in wheat is warranted.
In capsicum and clover, female sterile lines have been used as the pollinator in hybrid seed production to shorten the parental distance and to obtain a higher seed yield (Brown & Bingham, Reference Brown and Bingham1984; Daskalov & Mihailov, Reference Daskalov and Mihailov1988). In wheat, Gotzov (Reference Gotzov1979) firstly reported a female sterile material. However, some key issues, i.e. self-reproduction and genetic mechanism, need to be further addressed. Recently, a new female sterile line in wheat (Triticum aestivum L.), a spontaneously mutant, named as XND126, was identified (Dou et al., Reference Dou, Zhang, Ma, Feng and Sun2001). This novel mutation possesses a striking characteristic: female sterile under normal autumn sowing but normal female fertility under late winter sowing conditions (Dou et al., Reference Dou, Zhang, Ma, Feng and Sun2001). Obviously, the characteristic is helpful to solve the issue of self-reproduction. Meanwhile, studies on the inheritance of the female fertility are of great importance in wheat breeding. Using joint segregation analysis of P1, F1, P2 and F2 populations, Hou et al. (Reference Hou, Dou, Zhang, Li, Yang, Liu, Du and Sun2006) suggest that the female sterility is controlled by two major-gene plus polygenes. Recently, evidence shows that a major gene locus (taf1) on chromosome 2DS, accounting for 21·54–41·20% of the total phenotypic variance in 2004–2005 and 2006–2007, is responsible for the female sterility in wheat (Dou et al., Reference Dou, Hou, Xu, Lou, Chi, Yang, Wang, Ni and Sun2009). The above results present some problems. First, the above two results are inconsistent. Then, only five or nine markers presented in Dou et al. (Reference Dou, Hou, Xu, Lou, Chi, Yang, Wang, Ni and Sun2009) are located on the chromosome 2D. Finally, environmental interaction is not taken into account and epistasis is not detected. Accordingly, further investigation should be carried out.
Epistasis, the interaction between QTLs, plays an important role in the dissection of the genetic architecture for complex traits (Carlborg & Haley, Reference Carlborg and Haley2004). The model, including potential pair-wise interaction effects of all loci, is saturated quickly as the number of loci increases. To overcome this issue, several methods are available, e.g. penalized maximum likelihood (PML) (Zhang & Xu, Reference Zhang and Xu2005). The PML method assumes that there is one putative QTL residing on each marker in the entire genome, considers all main and epistatic effects in one model, adopts a penalty that depends on the values of the parameters, and allows spurious QTL effects to be shrunk towards zero and large QTL effects to be estimated without shrinkage. Therefore, a current focal point is to study the interaction involving the new female sterility gene(s) in wheat using the PML approach.
2. Materials and methods
(i) Plant materials and phenotyping
A female sterile line, XND126, a spontaneous mutation, was crossed as the male parent to cultivar Gaocheng 8901. The F1 plants were selfed to develop F2 seeds. All F2 seeds were planted at Urumqi experimental station (at ~87° east longitude and ~43° north latitude) under natural autumn sowing conditions on 15 September 2006, after growing for 45 days, half of the strong tillers for each F2 individual at the seedling tillering stage were split and moved to the Huai'an experimental stations (at ~119° east longitude and 33° north latitude) on 31 October 2006. The performance of female fertility for each of 243 F2 plants was evaluated after maturation at Huan'an experiment station in the end of May and at Urumqi experiment station in the beginning of July 2007. The indicator for the female sterility was the ratio of the number of seed setting to the total number of base floret on a spike (Zhang et al., Reference Zhang, Zhang, Li, Niu and Wang2007).
(ii) Simple sequence repeat (SSR) analysis
DNA was extracted from the fresh leaf tissues of P1, P2, F1 and F2 plants following the procedure described by Röder et al. (Reference Röder, Korzun, Wendehake, Plaschke, Tixier, Leroy and Ganal1998).
Primer sequences for SSR markers (Röder et al., Reference Röder, Korzun, Wendehake, Plaschke, Tixier, Leroy and Ganal1998; Pestsova et al., Reference Pestsova, Ganal and Röder2000; Somers et al., Reference Somers, Isaac and Edwards2004) were obtained from the reference map (http://wheat.pw.usda.gov). PCR was performed in a volume of 10 μl containing 50 ng of template DNA, 50 ng primers, 200 μmol/l dNTPs, 2·0 mmol/l MgCl2, 1·0 unit of Taq DNA polymerase, and 10×PCR buffer. The PCR profile included: one cycle of 94°C for 5 min, followed by 45 cycles of 94°C for 1 min, 50–60°C (depending on the specific primers) for 1 min, 72°C for 2 min and a final extension at 72°C for 10 min. PCR products were separated on 8% non-denaturing polyacrylamide gels with a 39:1 ratio of acrylamide and bisacrylamide, and then silver-stained as described by Santos et al. (Reference Santos, de Miranda, Sarno, Suffys and Degrave1993).
(iii) Linkage maps
The recessive class approach described by Zhang et al. (Reference Zhang, Shen, Dai, Mei, Saghai Maroof and Li1994) was used to calculate the recombination fraction between the marker and the female sterility gene. Its purpose was to obtain candidate markers for the construction of linkage groups. The critical value for the recombinant fraction was 0·4 (Kong, Reference Kong2006). From the cost and efficiency point of view, only the potential linked markers were used to survey F2 population to construction partial linkage maps, instead of whole genome maps.
Mapmaker/EXP 3.0 (Lander et al., Reference Lander, Green, Abrahamson, Barlow, Daley, Lincoln and Newburg1987) was used to construct a genetic linkage map of Triticum aestivum L. The recombination fraction was converted to genetic map distance using the Kosambi function (Kosambi, Reference Kosambi1944). LOD scores ⩾3 were used to determine all linkage groups. Linkage groups were assigned to chromosomes based on the publicly available linkage map (http://wheat.pw.usda.gov).
(iv) Genetic model
The phenotypic value of the ith F2 plant at the jth environment, yij , may be described by the following model:
where μ is population mean, E is environmental effect, G is the genetic effect including consideration of main and epistatic effects of QTL or marker, GE is QTL-by-environment interaction effect and ∊ i is a residual error with an assumed N(0, σ2) distribution. These effects were further partitioned as below:

where r is environmental effect, R is the number of environments, m is the number of markers on the genome, a is the additive effect, d is the dominant effect, ae and de are additive-by-environment and dominant-by-environment interaction effects, respectively, and (aa) kl , (ad) kl , (da) kl and (dd) kl are additive-by-additive, additive-by-dominant, dominant-by-additive and dominant-by-dominant interaction effects between the kth and lth loci, respectively.
(v) Parameter estimation
Because of incomplete marker genotypic information in real data analysis, multiple imputations for incomplete marker genotypes (Sen & Churchill, Reference Sen and Churchill2001) were adopted here to simulate the incomplete marker genotypes. This requires multiple analyses of the data, each for one imputed data set. Although 10–20 imputed data sets may suffice (Sen & Churchill, Reference Sen and Churchill2001; Xu & Jia, Reference Xu and Jia2007), we imputed 200 samples in this study. For each sample, the complete marker genotypes sampled were used to construct the design matrix for QTL effects in model (1). All the effects in model (1) were simultaneously estimated by the PML method. The samples in which the LOD statistic had passed 2 were counted. A detected QTL in which the ratio of the number of such samples to the total number of imputed samples (200) had passed 10% was considered as a true QTL. The QTL position is an average weighted by the total genetic variance of QTL detected.
3. Results
(i) Frequency distribution for female fertility in F2
The frequency distribution for female fertility in F2, along with the characteristics of the parents (Gaocheng 8901: 1·27±0·24; XND126: 0·10±0·09) and their F1 progeny (1·42±0·23), is shown in Fig. 1. The results show that the fertility difference between the two parents is obvious, their F1 shows a phenotype similar to that of the normal parent of Gaocheng 8901, and the distribution of female fertility in the F2 is continuous, bimodal and skewed (Fig. 1). This outcome indicates that there are major genes or epistasis dominating the female sterility in wheat.
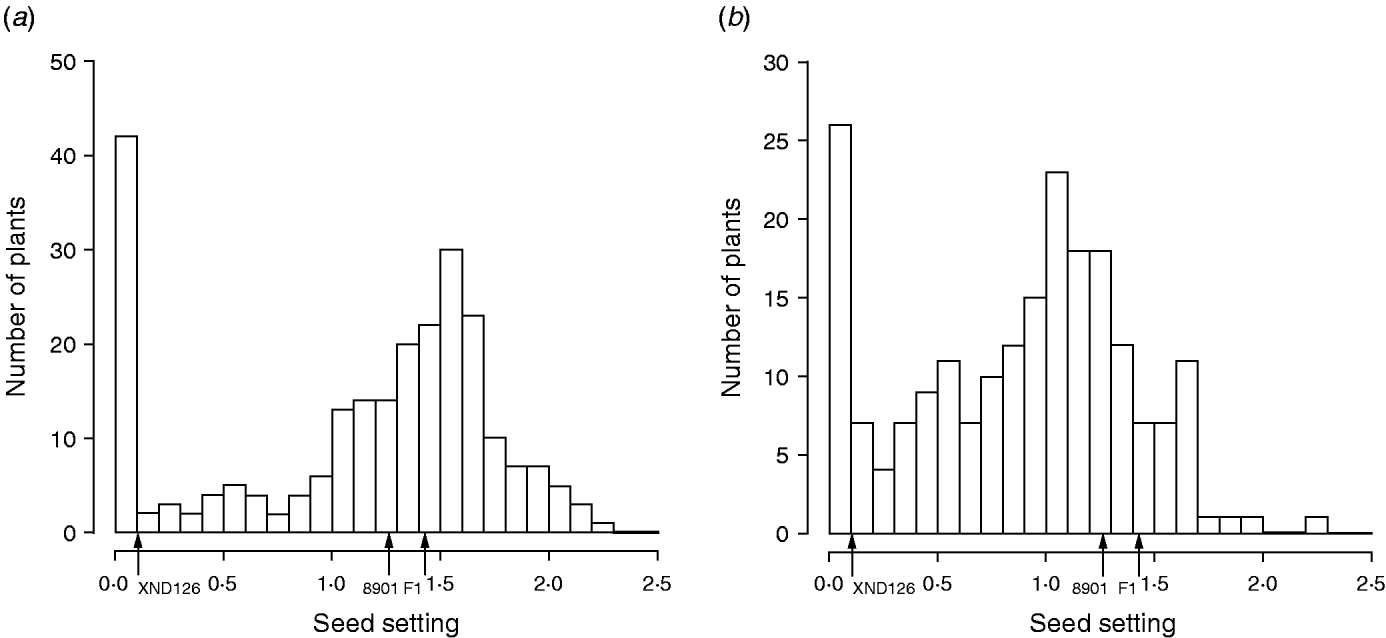
Fig. 1. Frequency distribution for seed-setting rates on fully pollinated spikes at Urumqi (a) and Huai'an (b) experimental stations in 2006–2007 in the F2 population derived from one cross between Gaocheng 8901 and XND126.
(ii) Construction of the linkage map
A total of 1250 SSR primer pairs in the whole genome were used to screen for polymorphisms between the parents and 70 pairs of them amplified polymorphisms between the two parents. In the analysis of the recessive class of 39 extreme sterile F2 plants, only 21 primer pairs amplified with lower recombination fraction (c value), with other 10 tightly linked markers on reference maps in wheat, totally 31 primer pairs were used to survey 243 F2 individuals. As a result, 28 molecular markers are mapped into five linkage groups (Fig. 2). The total length of linkage maps is 357·30 cM, with an average marker spacing of 15·53 cM.
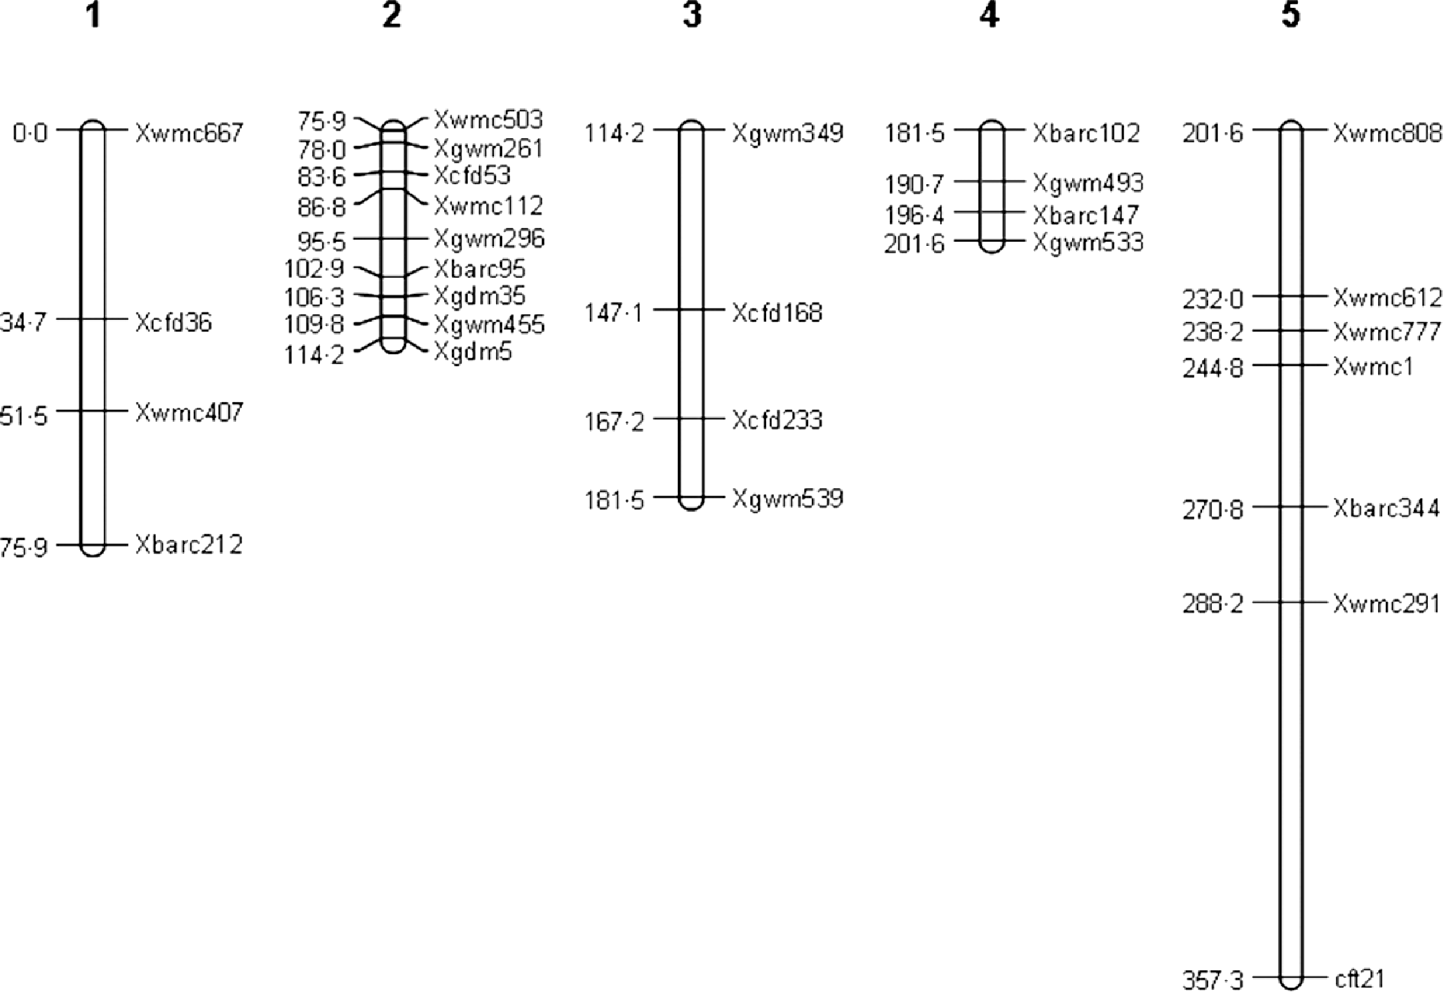
Fig. 2. Genetic linkage maps in the inheritance analysis of female sterility in wheat.
(iii) Mapping QTL for female sterility
A total of six QTLs, including two main-effect QTLs, three epistatic QTLs and one QTL-by-environment interaction, and accounting for 0·67–24·55% of the total phenotypic variance, are detected (Tables 1 and 2). All effects together account for 53·26% of the total phenotypic variation.
Table 1. Estimated positions and effects of main-effect QTL and QTL-by-environment interaction for female sterile in wheat (200 imputed datasets)
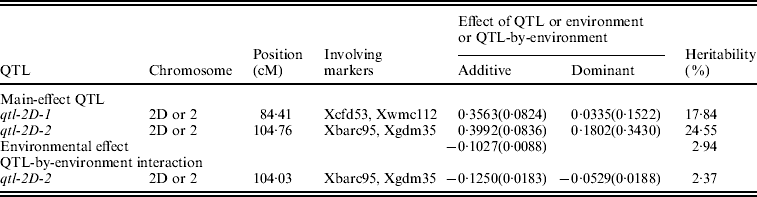
The standard deviations are in parentheses. The same is true for Table 2.
Table 2. Estimated positions and effects of QTL-by-QTL interaction for female sterile in wheat (200 imputed datasets)
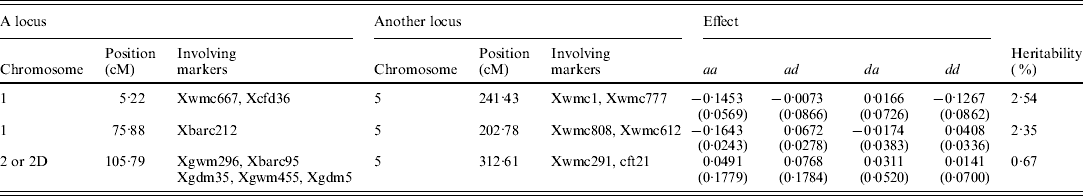
aa, ad, da and dd: additive-by-additive, additive-by-dominant, dominant-by-additive and dominant-by-dominant effects, respectively.
Two adjacent markers Xbarc95 and Xgdm35 have been identified to link with QTL responsible for female sterility in wheat. This indicates that a QTL, named as qtl-2D-2, exists between the above two markers. The QTL position is at 104·76 cM on chromosome 2D. The additive and dominant effects are 0·3992±0·0836 and 0·1802±0·3430, respectively, so its genetic variance is 0·0878 and the heritability is 24·55%. Meanwhile, the QTL has an interaction with environment. Its additive and dominant effects are −0·1250±0·0183 and −0·0529±0·0188, respectively, so its genetic variance is 0·0085 and the heritability is 2·37%.
Similarly, another main-effect QTL between markers Xcfd53 and Xwmc112, named as qtl-2D-1, is mapped. The QTL position is at 84·41 cM on chromosome 2D. The additive and dominant effects are 0·3563±0·0824 and 0·0335±0·1522, respectively, so its genetic variance is 0·0638 and the heritability is 17·84%.
Three epistatic QTLs, named by QTL1×QTL2, QTL3×QTL4 and qtl-2D-2×QTL5, with the heritabilties of 2·54, 2·35 and 0·67%, are identified (Table 2). Among these loci, QTL1 and QTL3 are respectively located at 5·22 and 75·88 cM of linkage group 1; and QTL2, QTL4 and QTL5 are placed on 241·43, 202·78 and 312·61 cM of linkage group 5, respectively. It should be noted that all loci except for qtl-2D-2, contributing to the three epistatic interactions, have no main effects. This may result in the difficulty in the detection of epistasis using the traditional approach.
4. Discussion
How does female sterility in plants arise? In the past several decades, many attempts have been made to dissect the genetic mechanism. At early stage, female sterility is treated as a qualitative trait and controlled by two major genes plus epistasis in ramie (Liu & Zhou, Reference Liu and Zhou2005), by one or two genes in rice (Yokoo, Reference Yokoo1986; Lee et al., Reference Lee, Chen and Ha2002) and by two major genes in soft wheat (Gotzov, Reference Gotzov1979). Recently, it is regarded as a quantitative trait and controlled by two major genes plus polygenes in wheat (Hou et al., Reference Hou, Dou, Zhang, Li, Yang, Liu, Du and Sun2006). More Recently, molecular quantitative genetics approach has been used to detect QTL for female sterility and a major gene locus taf1 is detected (Dou et al., Reference Dou, Hou, Xu, Lou, Chi, Yang, Wang, Ni and Sun2009). The major QTL is further confirmed in the present paper, because a common marker Xbarc95 has been identified to link with the major QTL, along with similar estimates of position and effects of the QTL, for example, additive effect is from 0·1615 to 0·3992, dominant effect is from 0·1654 to 0·2748, heritability is from 21·54 to 41·2%, and genetic distance between the common marker and the major QTL is from 1·86 to 5·4 cM. Meanwhile, another major QTL located between markers Xcfd53 and Xwmc112 on the same chromosome 2D is also detected in this study. In addition, three epistatic QTLs and one environmental interaction are further reported here. The above results further confirm the fact that markers on linkage groups 1, 2 and 5 are associated with the female sterility by a recessive extreme class approach. Therefore, our conclusion is that female sterility in wheat is a quantitative trait and dominated by two main-effect QTLs, epistasis and environmental interaction. However, in the present paper, we have not provided the environmentally responsive mechanism of the female sterility. Further investigation is underway and the corresponding results will be reported in the near future.
The observed value for fertility in crop is usually continuous (Zhang & Xue, Reference Zhang and Xue1996; Xie et al., Reference Xie, Shu, Chen, Zhuang and Xia2002; Yin et al., Reference Yin, Liu, Zeng, Zou, Yang, Peng, Chen and Xiong2007; Dwivedi et al., Reference Dwivedi, Perotti and Ortiz2008). However, the fertility was frequently regarded as a qualitative trait in the past and all individuals in a segregation population are partitioned into two groups: absolutely sterile and absolutely fertile. Actually, sometimes it is very difficult to judge the sterility or fertility for an individual. This may result in inaccurate conclusion. When the fertility is viewed as a quantitative trait, molecular quantitative genetics approach and mixed inheritance analysis method are available to dissect the genetic mechanism, and more information will be obtained. This is the reason why we adopt molecular quantitative genetics approach in this study.
The datasets presented here differ from those in Dou et al. (Reference Dou, Hou, Xu, Lou, Chi, Yang, Wang, Ni and Sun2009) although the F2 is from the same cross between XND126 and Gaocheng 8901. First, the phenotypic observations for the former are from Urumqi and Huai'an experiments in 2006–2007 but those for the latter are from Huai'an experiment in 2004–2005 and 2006–2007. The two phenotypic datasets here are jointly analysed so that environmental effect and environmental interaction are identified here. Then, the indicator for female sterility is different. For the former, it is the ratio of the number of seed setting to the total number of base floret, which is a commonly prevailing method. For the latter, it is the ratio of the number of seed setting spikelets to the total number of available spikelets. Finally, there are only five or nine molecular markers on chromosome 2D in Dou et al. (Reference Dou, Hou, Xu, Lou, Chi, Yang, Wang, Ni and Sun2009), but there are 28 markers on five linkage groups in this article. This may be an important reason that three epistatic QTLs are found in this paper.
The proposed method here differs from Chen & Walsh's (Reference Chen and Walsh2009) approach. For the former, the phenotypic observations for female sterility and marker information are used to detect QTL responsible for female sterility. For the latter, the position and effect of a female partial-sterile locus or viability locus are estimated using the observed data of dominant or co-dominant markers.
In the construction of genetic linkage groups, we should construct a whole-genome linkage maps as possible as we can. However, it is not in this study. From a cost efficiency viewpoint (Zhang et al., Reference Zhang, Shen, Dai, Mei, Saghai Maroof and Li1994), a recessive extreme class approach may be applied to calculate the recombination frequency between the marker and the QTL for the trait of interest, and only the candidate markers tightly linked to the supposed locus and their nearby markers are used to survey the mapping population and to construct partial linkage maps. Based on the partial linkage maps, mapping QTL for the trait can be carried out in a usual way and the results are also valuable, for example, in this study two main-effect QTLs, three epistatic QTLs and one environmental interaction are identified and all estimated effects account for more than 50% of the total phenotypic variance. It should be noted that this method may miss some candidate markers because of the hot recombination point between the marker and a true QTL. Thus, more ‘tightly linked’ markers should be selected.
We thank the associate editor Shizhong Xu and two anonymous reviewers for their constructive comments and suggestions on all versions of this manuscript. The work was supported by the National Natural Science Foundation of China (30771380, 30971848), NCET (NCET-05-0489), Jiangsu Natural Science Foundation (BK2008335) and the ‘111’ project (B08025).


