


1. Introduction
High-throughput sequencing technologies produce voluminous amounts of DNA sequence data, which are employed in a wide array of biological applications including de novo genome assembly, sequence error correction, expression analysis and detection of sequence variants. Data volume generated by next generation sequencing technologies is growing at a pace that is now challenging the storage and data processing capacities of modern computer systems (Medini et al., Reference Medini, Serruto, Parkhill, Relman, Donati, Moxon, Falkow and Rappuoli2008). Take genome assembly as an example, the de novo assembler ALLPATHS-LG (default k-mer size is 96) required approximately 3 weeks with 48 processors and approximately 0.5TB of RAM memory for the human whole-genome (3Gb) assembly (Gnerre et al., Reference Gnerre, MacCallum, Przybylski, Ribeiro, Burton, Walker, Sharpe, Hall, Shea, Sean, Berlin, Aird, Costello, Daza, Williams, Nicol, Gnirke, Nusbaum, Lander and Jaffe2011). Clustering analysis is a method that identifies and groups similar objects. It is a powerful tool to explore and study large-scale complex data. By sequence clustering, a large redundant data set can be represented by a small non-redundant set, which could be crucial for reducing storage space, computational time and noise interference in some analysis applications. Errors can be detected, filtered or corrected using consensus from sequences with clusters. In addition, some additional challenges brought by the high-throughput sequencing technologies may also be solved by clustering (Li et al., Reference Li, Fu, Niu, Wu and Wooley2012).
In order to design fast and accurately clustering algorithms for next generation sequencing (NGS) sequences, researchers put forward some new solutions. Typical clustering algorithms for NGS sequences includes: CD-HIT (Li & Godzik, Reference Li and Godzik2006), SEED (Bao et al., Reference Bao, Jiang, Kaloshian and Girke2011), Uclust (Edgar, Reference Edgar2010), and DNACLUST (Ghodsi et al., Reference Ghodsi, Liu and Pop2011). CD-HIT is a comprehensive clustering package (Huang et al., Reference Huang, Niu, Gao, Fu and Li2010; Li & Chang, Reference Li and Chang2017). CD-HIT uses a greedy incremental algorithm. Basically, sequences are first ordered by decreasing length, and the longest one becomes the seed of the first cluster. Then, each remaining sequence is compared with existing seed. If the similarity with any seed meets a pre-defined cutoff, it is grouped into that cluster; otherwise, it becomes the seed of a different cluster. CD-HIT uses a heuristic based on statistical k-mer filtering to accelerate clustering calculations. It also has a multi-threading function, so it can be implemented in parallel on multi-core computers (Li, Reference Li2015; Bruneau et al., Reference Bruneau, Mottet, Moulin, Kerbiriou, Chouly, Chretien and Guyeux2018).
SEED, Uclust and DNACLUST have been developed using greedy incremental approaches similar to that introduced by CD-HIT (James et al., Reference James, Luczak and Girgis2017; Rahman et al., Reference Rahman, LaPierre, Rangwala and Barbara2017). Uclust (Ennis et al., Reference Jiang, Dong, Chen and Chen2016; Jiang et al., Reference Ennis, Dascalu and Harris2016) follows CD-HIT's greedy incremental approach, but it uses a heuristic called Usearch for fast sequence comparison. It also gains speed by comparing a few top sequences instead of the full database. DNACLUST (Rahman et al., Reference Rahman, LaPierre, Rangwala and Barbara2017; Kim, Reference Kim, Koh and Rho2015) also follows CD-HIT's greedy incremental approach, it requires a suffix array to index the input data set. Unlike CD-HIT and Uclust, which can process both protein sequences and DNA sequences, SEED (Hauser, Reference Hauser2014; Mahmud & Schliep, Reference Mahmud and Schliep2014) only works with Illumina reads and only identifies up to three mismatches and three overhanging bases. It utilizes an open hashing technique and a special class of spaced seeds, called block spaced seed. These methods use various heuristics and have achieved extraordinary speed in clustering NGS sequences. CD-HIT and Uclust often produce comparable results in both protein and DNA clustering tests. SEED is faster than other programs in clustering Illumina reads, but it yields many more clusters. Except for SEED, the other three programs all work on rRNA sequences, where Uclust is fastest and CD-HIT gives the fewest clusters.
In this study, we proposed a high-performance short sequence classification algorithm (HSC) for NGS data based on efficient hash function and text similarity. First, HSC converts all reads into k-mers, then it forms a unique k-mer set by merging the duplicated and reverse complementary elements. Second, all unique k-mers are stored in a hash table, where the k-mer string is stored in the key field, and the ID of the reads containing the k-mer are stored in the value field. More read IDs stored in the value field indicate the more reads that share the unique k-mer, it also indicates that the unique k-mer is more reliable. To reduce computational complexity and runtime consumption, some hash units that store low reliability unique k-mers are filtered out. Third, each hash unit is transformed into a short text consisting of reads. Fourth, short texts that satisfy the similarity threshold are combined into a long text, the merge operation is executed iteratively until there is no text that satisfies the merge condition. Finally, the long text is transformed into a cluster consisting of reads. We tested HSC using five real datasets. The experimental results showed that HSC cluster 100 million short reads within 2 hours, and it had excellent performance in reducing memory consumption. Compared to existing methods, HSC is much faster than other tools, it can easily handle tens of millions of sequences. In addition, when HSC is used as a preprocessing tool to produce assembly data, the memory and time consumption of the assembler is greatly reduced. It can help the assembler to achieve better assemblies in terms of N50, NA50 and genome fraction. The illustration of the pipeline of HSC is shown in Fig. 1.
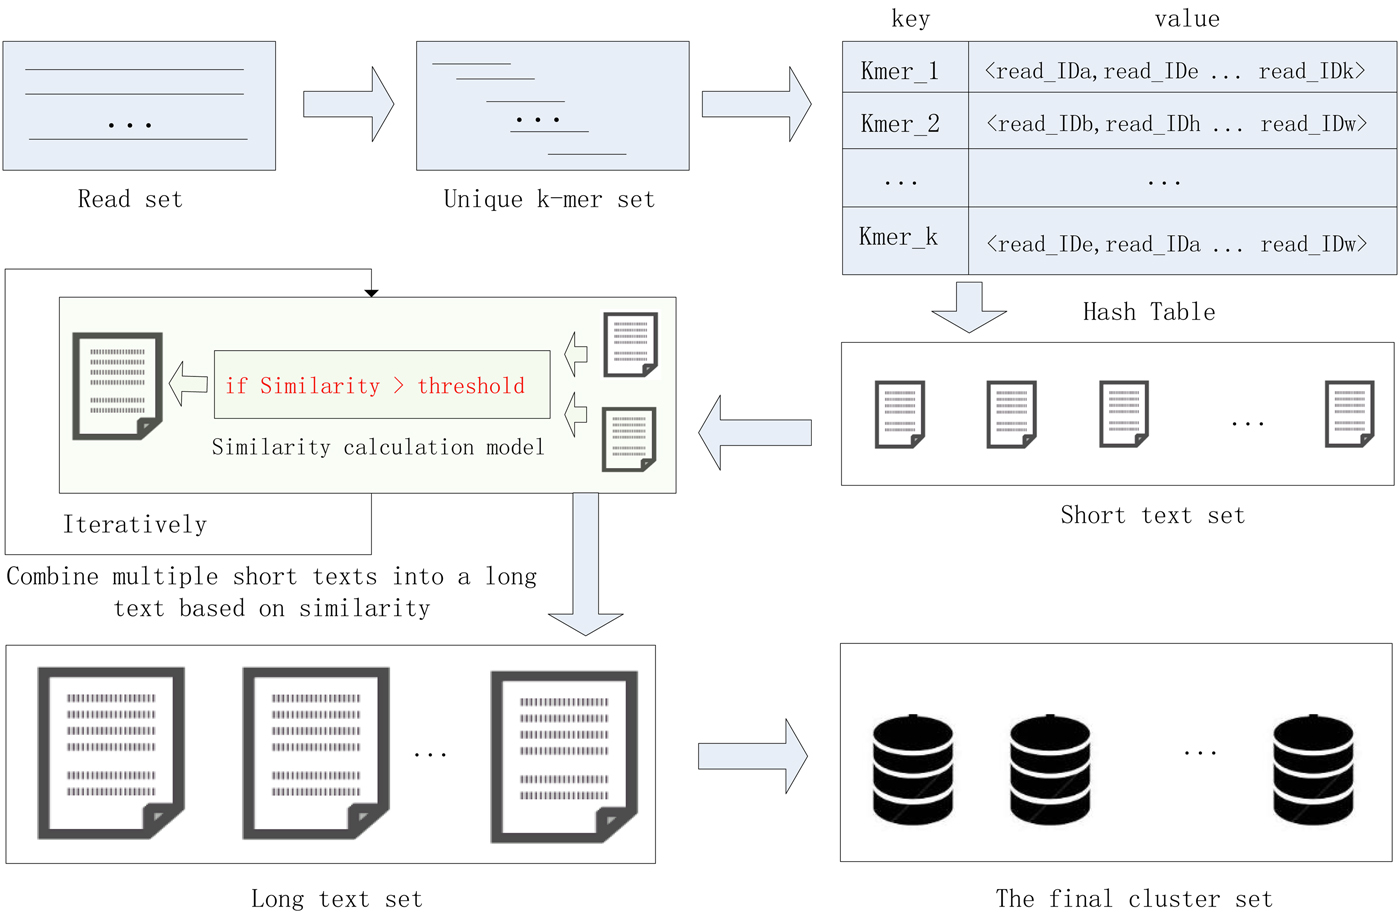
Fig. 1. The illustration of the pipeline of HSC.
2. Methods
HSC has applied two principal techniques. The first is an efficient storage structure based on hash function, and the second is a precise text similarity calculation model based on cosine coefficients. In the process of clustering, the unique k-mer is quickly stored in the hash unit, where the k-mer string is stored in the key field, and the ID of the reads containing the k-mer are stored in the value field. After that, each hash unit is transformed into a short text consisting of reads, and then short texts that satisfy the similarity threshold are merged into a long text, the merge operation is executed iteratively until there is no text that satisfies the merge condition. Finally, the long text is transformed into a final cluster consisting of reads. The efficient hash function can quickly complete the preliminary clustering of the data, and then the data in a hash unit is converted into a short text, and the alignment between the mass reads becomes the similarity comparison between the short texts, which greatly reduces the complexity of the computation. The application of these two technologies enables the HSC to adapt to large-scale data sets.
2.1. Notations
The entire read set is denoted as R, and we assume that there are n reads in R. Let r i be the i-th read (i = 1,2,…,n), and |r i| be the length of the read i. Given a fix length k of k-mer, the read i can be represented as a list of (|r i| − k + 1|) k-mers. The unique k-mer set is formed by merging the duplicated and reverse complementary elements in original k-mer set. N50 is the length for which the collection of all contigs of that length or longer covers at least half an assembly. NG50 is the length for which the collection of all contigs of that length or longer covers at least half the reference genome. Misassemblies is the number of mis-assembly events and local mis-assembly events. NA50 is the value of N50 after contigs have been broken at every misassembly event. NGA50 is the value of NG50 after contigs have been broken at every misassembly event. Genome fraction (%) is the proportion of the genome reference being covered by output contigs.
2.2. Generating a unique k-mer set
The unique k-mer set can be obtained using many of the currently available tools, such as Jellyfish (Marcais & Kingsford, Reference Marcais and Kingsford2011), DSK (Rizk et al., Reference Rizk, Lavenier and Chikhi2013) and KMC2 (Deorowicz et al., Reference Deorowicz, Kokot, Grabowski and Debudaj-Grabysz2015). In this study, we used DSK to obtain the unique k-mer set. Note that before converting read to k-mers, the k-mer size k needs to be determined. k should be kept small to avoid the overuse of computer memory. To estimate genomic characters, the k-mer size k should be determined under the logic that the space of k-mer (4k) should be several times larger than the genome size (G), so that few k-mers derived from different genomic positions will merge together by chance, that is, most k-mers in the genome will appear uniquely. In practice, we often require the k-mer space to be at least five times larger than the genome size (4k > 5*G), and be less than the upper limit of system memory usage (Liu et al., Reference Liu, Shi, Yuan, Hu, Zhang, Li, Li, Chen, Mu and Fan2013). In addition, as the value of k increases, the time required for the k-mer frequency statistics also increases. Therefore, when selecting the size of k, it is necessary to comprehensively consider the memory requirement, the time requirement and the accuracy requirement. In this study, we set the value of k to be 15, which has fully considered the above factors. The rule for k-mer size selection is shown in Equation (1).
 $$4^k \gt 5^{\ast}G$$
2.3. Storing all unique k-mers in a hash table
After the unique k-mer set is generated, all unique k-mers are stored in a hash table, where the k-mer string is stored in the key field, and the ID of the reads containing the k-mer are stored in the value field. In this study, we chose SDBM (Jain & Pandey, Reference Jain and Pandey2012) as the hash function, which is widely used in various applications. The mathematical expression of SDBM is shown in Equation (2), where ch represents the ASCII of each character in the sequence, >> is a bitwise left shift operator, h represents the hash value, it initialized as zero. SDBM is a standard hash function which has very fewer chances of collisions, even in a very large scale data set.
 $$h = ch + (h \lt \lt 6) + (h \lt \lt 16) - h$$
The number of reads stored in the value field can reflect the credibility of the unique k-mer. The smaller the number of read IDs stored in the hash unit, the lower the frequency of the corresponding unique k-mer. It is well know that the extremely low frequency k-mer is often caused by sequencing errors or sequencing bias (Kelley et al., Reference Kelley, Schatz and Salzberg2010; Sohn & Nam, Reference Sohn and Nam2016). In the case of a large sequencing depth, there is a high possibility that the low-frequency k-mer is an erroneous k-mer. Keeping these extremely low frequency k-mers in a hash table not only increases the cost of calculations, but also affects the quality of downstream applications. In order to reduce the computational complexity and improve the quality of downstream analysis, hash units that store less than 10 read IDs will be removed.
2.4. Transforming each hash unit into a short text
The storage structure of a hash unit can be represented as:  $H( \lt unique\,k - mer\,i \gt, \lt read\_IDa,\ldots,read\_IDn \gt )$. The ID of read indicates the serial number of the read in the library(read set). In this step, each hash unit is transformed into a short text. The short text consists of read strings corresponding to the read IDs stored in the hash unit. In order to facilitate downstream applications, the short text is set to fasta format. The principle of converting a hash unit to a short text is shown in Fig. 2.

Fig. 2. The principle of converting a hash unit to a short text.
2.5. Calculation of similarity between short texts
Text comparison takes the form of solving the similarity between two or more texts. The higher the similarity, the more similar the two texts are. Text comparison is commonly used in fields such as data retrieval, natural language processing and information matching (Inzalkar & Sharma, Reference Liu, Lin, Shao, Shen, Ding and Han2015; Liu et al., Reference Inzalkar and Sharma2017; Pu et al., Reference Pu, Fei, Zhao, Hu, Jiao and Xu2017). The comparison of similarity between texts can be divided into methods based on character similarity (Wen et al., Reference Wen, Deng, Zhang and Ramamohanarao2017), statistics based similarity (Lin et al., Reference Lin, Jiang and Lee2014) and semantic-based similarity (Oramas et al., Reference Oramas, Sordo, Espinosa-Anke and Serra2015). The character-based similarity calculation method is a basic algorithm for similarity calculation of text, the most representative character-based similarity calculation algorithm is the edit distance (Levenshtein distance) algorithm (Wang et al., Reference Wang, Feng and Li2010), which is used to solve the minimum number of edits required to covert one text to another text. In the Levenshtein distance based similarity calculation method, the smaller the edit distance between two or more texts, the higher the similarity between two or more texts. Although the similarity calculation methods based on the Levenshtein distance are widely used, they only consider the text similarity from the character level while not considering the influence of the high-frequency substrings, thus leading to low accuracy of similarity. In this study, we calculated the similarity between texts based on the vector space model (VSM). VSM is the simplest way to represent a document for the purpose of information retrieval. We assume there are M documents in the library, and V is the set of the vocabulary term/words occurring in the library. The document in VSM is represented by a |V|-dimensional vector, each element of the vector represents the frequency of occurrence of each word in the document.
2.5.1. Similarity measure in VSM
Let T = {T 1, T 2, …, T n} be a set of unique k-mers for all documents. Let W = {W 1, W 2, …, W n} be a set of weight for all unique k-mers. For example, W i represents the importance of the unique k-mer T i in set T. We can construct n-dimensional space vector based on set T and W, where (W 1, W 2, …, W n) are the coordinate values corresponding to (T 1, T 2, …, T n). The above conversion can be used to map a document to a point in vector space. Let any document be represented by D = (W 1, W 2, …, W n). The calculation of weight W i is shown in Equation (3), where TF i represents the frequency of the i-th unique k-mer appearing in the document D, n represents the number of documents in a document collection, and n i represents the number of occurrences of T i in the document collection.
 $$W_i = TF_i \times log_2(N/n_i)$$
2.5.2. Similarity calculation based on cosine coefficient
TF i represents the frequency of the i-th unique k-mer appearing in the document D, and IDF represents the frequency of anti-document. If there are fewer documents containing the term T, then the IDF is larger, which indicates that the term T has a good distinguishing ability. Otherwise, the distinguishing ability of T is poor. Let the target document D′ be represented by  ${D}^{\prime} = (W_1^{\prime}, W_2^{\prime},..., W_n^{\prime} )$. Then, the similarity between documents D and D′ can be calculated from Equation (4).
 $$sim(D,{D}^{\prime}) = \displaystyle{\overline{D}^{\ast} \overline{D}^{\prime} \over \vert \vert \overline{D} \vert \vert \times \vert \vert \overline{D}^{\prime} \vert \vert} $$
Let T i denote the feature vector of document D, let T j denote the feature vector of document D′. Let W ik denote the weight of the k-th dimension of the document corresponding to T i. Let W jk denote the weight of the k-th dimension of the document corresponding to T j. The cosine coefficient of the similarity vector sim(d, d′) between documents D and D′ is shown in Equation (5).
 $$sim(T_i,T_j) = \displaystyle{{\sum\nolimits_{k = 1}^n {W_{ik}W_{\,jk}}} \over {\sqrt {\sum\nolimits_{k = 1}^n {W_{ik}^2} \sum\nolimits_{k = 1}^n {W_{\,jk}^2}}}} $$
2.6. Merging short texts to a long text
Short texts that satisfy the similarity threshold are merged into a long text, the merge operation is executed iteratively until there is no text that satisfies the merge condition. If the similarity between short texts meet the requirement of the threshold, they will be merged in a long text iteratively. Finally, the long text will be transformed into a cluster consisting of reads.
3. Experiments and results
To evaluate the performance of HSC, a simulated dataset and four real datasets were used in the experiments in this study. The simulated dataset was generated by a very famous data simulation tool called wgsim (Li, Reference Li2011) (https://github.com/lh3/wgsim). The first three real datasets (R.spha, M.absc and V.chol) were downloaded from the GAGE-B website (http://ccb.jhu.edu/gage_b/), the last real dataset (Hum14) was downloaded from the GAGE website (http://gage.cb cb.umd.edu/). Details about these four real datasets are shown in Table 1.
Table 1. Details of datasets.
In simulation experiments, a fragment on the Staph (Staphylococcus albus) reference sequence was selected as a reference, and Wgsim was used as a simulator to generate a library consisting of paired-end reads. In this experiment, the length of read was set to 101, and the size of k-mer used in the classification was set to 15. The minimum length of the hash unit was set to 10. The total number of paired-end reads which are generated by the Wgsim simulator was one million. The error rate of reads was set to 0.5%. HSC completed the classification within 5 minutes. In order to evaluate the performance of HSC on simulation dataset, we used bowtie2 (Langmead & Salzberg, Reference Langmead and Salzberg2012) to align reads in a cluster to the reference sequence, and record the location of these reads on the reference sequence, respectively. The classification results are shown in Fig. 3, where the y-axis represents the position on the reference, and the x-axis represents the ID of the cluster. It can be seen from Fig. 3 that HSC divided a million reads into five clusters, and the distribution of these five clusters on the reference sequence is relatively independent.
Fig. 3. Classification performance of HSC on simulated data. The y-axis represents the position on the reference, and the x-axis represents the ID of the cluster.
In the experiments of four real datasets, we selected R. sphaeroides (Rhodobacter sphaeroides), M. abscessus (Mycobacterium abscessus), V. cholerae (Vibro cholerae) and Hum14 (Human 14) to test the performance of HSC. Details about these four datasets are shown in Table 1. The classification results of HSC on these four real datasets are shown in Table 2, Table 3, Table 4 and Table 5. In these experiments, we used SOAPdenovo2 (Luo et al. Reference Luo, Liu, Xie, Li, Huang, Yuan, He, Chen, Pan, Liu, Tang, Wu, Zhang, Shi, Liu, Yu, Wang, Lu, Han, Cheung, Yiu, Peng, Xiaoqian, Liu, Liao, Li, Yang and Wang2012) as an assembler, and the size of k-mer was set to 49 bp during the assembly. The evaluation indicators of N50, NG50, NA50, NGA50 and genome fraction were obtained by Quast (Gurevich et al., Reference Gurevich, Saveliev, Vyahhi and Tesler2013). The experimental results show that HSC cluster 100 million short reads within 2 hours, and it has excellent performance in reducing memory consumption. For example, as shown in Table 2, HSC generated 1,013,212 clusters requiring 2.3GB of memory (as compared to the tool of CD-HIT, which produced 750,276 clusters requiring 5.2GB memory). Compared to existing methods, HSC is much faster than other tools, it can easily handle tens of millions of sequences. For example, as shown in Table 5, HSC generated 1,587,746 clusters on the Human 14 data set, which took 47.7 minutes (as compared to the tool of CD-HIT, which produced 956,346 clusters requiring 556.9 minutes). In addition, when HSC is used as a preprocessing tool to produce assembly data, the memory and time consumption of the assembler is greatly reduced. It can help the assembler to achieve better assemblies in terms of N50, NG50, NA50, NGA50 and genome fraction. For example, as shown in Table 3, HSC generated 976,542 clusters, SOAPdenovo2 assembled 76.21% of V. cholerae genome with NA50 of 5.215 kb based on these clusters (as compared to the tool of SEED, SOAPdenovo2 assembled 74.33% of V. cholerae genome with NA50 of 4.416 kb based on clusters generated by SEED).
Table 2. The classification results of HSC on lib1.
‘No. clusters' indicates the number of clusters, ‘Time (m)' indicates the time consumption in clustering, ‘Mem (GB)' indicates the memory consumption in clustering, ‘SimT' indicates the threshold of similarity, ‘GF (%)' indicates the genome fraction. Bold values represent best results.
Table 3. The classification results of HSC on lib2.

‘No. clusters' indicates the number of clusters, ‘Time (m)' indicates the time consumption in clustering, ‘Mem (GB)' indicates the memory consumption in clustering, ‘SimT' indicates the threshold of similarity, ‘GF (%)' indicates the genome fraction. Bold values represent best results.
Table 4. The classification results of HSC on lib3.
‘No. clusters' indicates the number of clusters, ‘Time (m)' indicates the time consumption in clustering, ‘Mem (GB)' indicates the memory consumption in clustering, ‘SimT' indicates the threshold of similarity, ‘GF (%)' indicates the genome fraction. Bold values represent best results.
Table 5. The classification results of HSC on lib4.
‘No. clusters' indicates the number of clusters, ‘Time (m)' indicates the time consumption in clustering, ‘Mem (GB)' indicates the memory consumption in clustering, ‘SimT' indicates the threshold of similarity, ‘GF (%)' indicates the genome fraction. Bold values represent best results.
4. Discussion
In this study, we proposed a HSC for NGS data based on efficient hash function and text similarity. HSC has applied two important techniques. The first is an efficient storage structure based on hash function, and the second is a precise text similarity calculation model based on cosine coefficients. The efficient hash function can quickly complete the preliminary clustering of the data, and then the data in a hash unit is converted into a short text, the alignment between the mass reads becomes the similarity comparison between the short texts, which greatly reduces the complexity of the computation. The time complexity of alignment between reads in the library is O(n 2). HSC uses the hash function to achieve an initial classification of reads, the time complexity of this process is O(n). After that, HSC converts the two-to-two comparison between reads into an alignment between short texts (suppose a short text contains r reads on average, the number of short texts is m), the time complexity of this process can be expressed as O(m 2) (m ≃ n/r). The application of these two technologies makes HSC processing large-scale data sets faster than other tools.
It is well known that extremely low frequency k-mers are often caused by sequencing errors or sequencing bias. In the case of a large sequencing depth, there is a high possibility that the low-frequency k-mer is an erroneous k-mer. Keeping these extremely low frequency k-mers in a hash table not only increases the cost of calculations, but also affects the quality of downstream applications. In order to reduce the computational complexity and improve the quality of downstream analysis, hash units that store less than 10 read IDs were removed in this study. This operation allows the HSC to produce a better quality data set for downstream analysis than other tools.
5. Conclusion
In this study, we proposed a HSC for NGS data based on efficient hash function and text similarity. We tested HSC using a simulation dataset and four real datasets. The experimental results show that HSC cluster 100 million short reads within 2 hours, and has excellent performance in reducing memory consumption. Compared to existing methods, HSC is much faster than other tools and can easily handle tens of millions of sequences. In addition, when HSC is used as a preprocessing tool to produce assembly data, the memory and time consumption of the assembler is greatly reduced. It can help the assembler to achieve better assemblies in terms of N50, NG50, NA50, NGA50 and genome fraction.
6. Future works
The calculation method of similarity between short texts is the core of the classification algorithm in this study. Although, HSC performs better than other methods on various datasets, there is still much room for improvement in its performance. Next, we will further study the similarity comparison between short texts and propose a more superior comparison algorithm. In addition, low quality read filtering is also a very important operation in classification, which affects the quality of downstream analysis directly. We will also further study the new method of low-quality read filtering.
Acknowledgments
This work has been supported by the National Natural Science Foundation of China under Grant No.81202303, No.31302056, the Health Technology and Development Research Plan of Yichang under Grant No.A12301-07, No.A13301-10, and the Research Development Foundation of Center Hospital of Yichang under Grant No.KFJ2011025.
Authors
Xiangyu Liao received her Ph.D. degree in Basic Medicine from Norman Bethune College of Medicine, Jilin University, Changchun, China, in 2011. She is currently an attending doctor in the Department of Oncology, China Three Gorges University & Yichang Central Peoples Hospital, China. Her current research interests include tumor immunology, tumor-targeted therapy, Bioinformatics. She has published four SCI journal papers.
Xingyu Liao is currently working towards his Ph.D. degree in computer science from the Central South University, Changsha, China. His main research interests include genome assembly and sequence analysis.
Wufei Zhu received his Ph.D. degree in immunology from Norman Bethune College of Medicine, Jilin University, Changchun, China, in 2011. He is currently an associate chief physician in the Department of Endocrinology, China Three Gorges University & Yichang Central Peoples Hospital, China. His current research interests include autoimmune disease of Endocrinology, the effect of AIRE in autoimmune disease and immune tolerance, gene sequencing of AIRE in APS-1 patients. He has published more than 20 papers including six SCI journal papers.
Lu Fang is currently working toward her Masters degree at China Three Gorges University, her main research interests are in autoimmune disease of Endocrinology, include late autoimmune diabetes and the effect of AIRE in autoimmune diseases.
Xing Chen received a Masters degree in internal medicine from Three Gorges University, China, in 2015. He is a resident physician in the Department of Endocrinology, First Clinical Medical School of China Three Gorges University. His current main research interests are in autoimmune disease of endocrinology, especially the mechanism of AIRE in immune tolerance. He has published several papers including one SCI journal paper.


