


Impact Statement
In this study, we propose a simple system to eject highly viscous liquids including non-Newtonian liquids. Although spray coating is widely used in industrial painting, such as automobile painting, it requires organic solvents to reduce the paint viscosity because the spray device can eject only low-viscosity liquids. The requirement for organic solvents is a crucial problem in terms of environmental and manufacturing costs. Our system is the solution to these problems. This system can paint letters on a section of a car body using commercial car paint (a viscous non-Newtonian fluid) without organic solvent. This result indicates that this system will contribute to the implementation of next generation printing technologies such as three-dimensional printing, printed electronics, bioprinting and needle-free injection systems. This article explains the physical mechanism of the novel drop-on-demand printing system for highly viscous liquids using the theories of fluid dynamics.
1. Introduction
Paint applied by spray coating is an important factor in determining the quality of various industrial products, such as an automobile (Reference Toda, Salazar and SaitoToda, Salazar, & Saito, 2012). Currently, spray coating is used even though it has three major drawbacks. First, it is impossible to paint small areas because the car paint diffuses on the spray nozzle (Reference Park and JeonPark & Jeon, 2018). On an automobile-coating line, the spray coating requires manual masking, which draws out the whole painting process (Reference KellyKelly, 2009). Second, the paint transfer efficiency of the spray method is low at 30–70 % (Reference Akafuah, Poozesh, Salaimeh, Patrick, Lawler and SaitoAkafuah et al., 2016; Reference Andrade, Skurtys and OsorioAndrade, Skurtys, & Osorio, 2012; Reference Streitberger and DosselStreitberger & Dossel, 2008). Third, the spray coating requires organic solvents to reduce the paint viscosity because the spray device can eject only low-viscosity liquids. Organic solvents force the use of equipment for purification of polluted air and create a hazardous working environment for workers on the automobile-coating line. One way to avoid these problems is to eject the highly viscous liquids as a microjet on demand. This eliminates the need for organic solvents because high-viscosity paints can be ejected without dilution. In addition, masking is not required because the paint jet is narrow and can be applied to a small area. As a result, the paint transfer efficiency and working environment would be improved. Ultimately, it is expected that a painting process based on this technique will be completely automated.
Methods for ejecting highly viscous liquid microjets include laser-induced forward transfer (Reference Koch, Kuhn, Sorg, Gruene, Schlie, Gaebel and ChichkovKoch et al., 2010; Reference Turkoz, Kang, Deike and ArnoldTurkoz, Kang, Deike, & Arnold, 2018), laser-induced microjet (Reference Delrot, Modestino, Gallaire, Psaltis and MoserDelrot, Modestino, Gallaire, Psaltis & Moser, 2016), microjet induced by cavitation bubbles (Reference Gonzalez-Avila, Song and OhlGonzalez-Avila, Song, & Ohl, 2015) and acoustic printing (Reference Foresti, Kroll, Amissah, Sillani, Homan, Poulikakos and LewisForesti et al., 2018). Recently, a highly viscous liquid jet generator induced by impact was proposed (Reference Onuki, Oi and TagawaOnuki, Oi, & Tagawa, 2018). It is a simple, cheap and small system compared with the devices mentioned above. The jet velocity produced by this device can be computed with a model considering the pressure impulse approach (Reference Antkowiak, Bremond, Le Dizès and VillermauxAntkowiak, Bremond, Le Dizès, & Villermaux, 2007; Reference BatchelorBatchelor, 1967; Reference Cooker and PeregrineCooker & Peregrine, 1995). However, in this device, the jet irregularly contacts the inner wall of the nozzle because the microjet travels a non-trivial distance inside a long nozzle, which results in nozzle clogging. Therefore, we improve the device significantly to eject highly viscous liquid microjets without clogging.
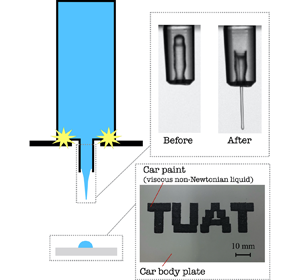
In this study, we propose a new on-demand painting device (see Figure 1a). The structure of the new design, in which a short nozzle is connected to a cylindrical container, is much simpler than the previous design. An impulsive motion of the container ejects a jet of highly viscous liquid. The shortness of the nozzle prevents contact between the jet and the inner wall of the nozzle.

Figure 1. (a) The device before the impact. (b) The device just right after the impact. The observation result ( $\nu = 100\ \textrm {mm}^{2}\ \textrm {s}^{-1}$) (bottom) and $\varPi$- $z$ diagram (right). (c) Result of using the new on-demand painting system (left) and the entire device (right).
To demonstrate the feasibility of this device, we painted letters on a section of a car body using commercial car paint with a zero-shear viscosity of 100  $\textrm {Pa} \cdot \textrm {s}$ and a machine employing the new device (see Figure 1c). Here, the commercial car paint is a shear-thinning fluid (zero-shear viscosity of 100 $\textrm {Pa} \cdot \textrm {s}$ and 0.1 $\textrm {Pa} \cdot \textrm {s}$ at a shear rate of 100 1/s). The letters ‘TUAT’ were painted with more than 3600 dots automatically by a computer program. Importantly, the edges of the letters were sharply painted without using any masks, as shown in Figure 1c. Furthermore, no organic solvent was needed for our device. This result indicates that the new on-demand painting device can be applied to automotive painting, as well as other paintings of viscous non-Newtonian fluids.
In this letter, we investigate the jet velocity that depends on the main experimental parameters, specifically the initial liquid velocity  $U_0$ and the ratio between liquid depth in the container and in the nozzle $l_{\textit{top}}/l_{\textit{bottom}}$, to understand the detailed mechanism of this jet ejection. In addition, we discuss a fluid dynamics model for this device.
2. Experimental Set-up and Physical Model Based on Pressure Impulse Approach
The experimental set-up is shown in Figure 1a. We used a glass syringe (interchangeable syringe, 10 mL, Tsubasa Industry) because it consists of a short nozzle (Luer slip tip) and a cylindrical container (barrel). The wide end of the barrel was closed with a silicon cap and a metal piece, instead of a plunger. The glass syringe was filled with silicone oil (viscosity  $\nu = 1$, 10 and 100 mm $^{2}$ s $^{-1}$, Shin-Etsu Chemical) that fell freely and collided with a solid plate at the impact velocity $U_0$ (see Figure 1b). Immediately after the collision of the syringe, a jet emerged from the liquid–gas interface inside the nozzle with the velocity $V_{jet}$ (see Figure 1b). The impact velocity $U_0$ was adopted as the initial velocity of the fluid. Both $U_0$ and $V_{jet}$ were measured using a high-speed camera (FASTCAM SA-X, Photron) with a frame rate of 30 000 fps. The experiments were conducted in the range of $0.23 < U_0 < 1.27\ \textrm {m}\ \textrm {s}^{-1}$ and $3 < l_{\textit{top}}/l_{\textit{bottom}} < 95$, where $l_{\textit{top}}$ is the depth of the liquid in the container and $l_{\textit{bottom}}$ is the depth of the liquid in the nozzle (see Figure 1a). In this experiment, $l_{\textit{top}}/l_{\textit{bottom}}$ was adjusted by fixing $l_{\textit{top}}$ to $\sim$30 or 60 mm and changing $l_{\textit{bottom}}$ to 0.3–8.5 mm. The interface in the experiments showed complex shape with multiple undulations in some cases. However, the interface shape related to the flow focusing effect is a smooth hemisphere. Therefore, we assumed that the initial contact angle was constant in this experiment ( $\theta = 25^{\circ }$).
Here, we explain the physical model to predict the jet velocity of the new device based on the previous model (Reference Onuki, Oi and TagawaOnuki et al., 2018), which considered only the pressure impulse. Note that the previous model reasonably predicted the jet velocity of the previous device, which also employed impulsive motion for jet ejection. The generation process of the microjet can be divided into two regimes with different time scales: the impact interval and the focusing interval. The liquid suddenly accelerates during the impact interval, due to the impulsive force (impact duration  $\le O(10^{-4})$s). After the impact interval (focusing duration $\gg O(10^{-4})$s), the microjet emerges through a flow-focusing effect during the focusing interval.
During the impact interval, a sudden change in the motion of the container produces large pressure gradients in the fluid, which in turn produces a sudden change in the liquid velocity (Reference BatchelorBatchelor, 1967). Considering the short-time dynamics due to the impact, and assuming that the device moves only in the vertical direction  $z$, the dynamics of the liquid is governed by $\partial {\boldsymbol {u}}/{\partial t} = -(1/\rho )({\partial p}/{\partial z})$, where $\boldsymbol {u}$ is the liquid velocity, $\rho$ is the density and $p$ is the pressure. When the liquid is accelerated in a static state to the velocity $U$ due to the impact, the liquid velocity right after the impact is derived as $U = -({1}/{\rho }) ({\partial \varPi }/{\partial z})$, where $\varPi$ is the pressure impulse, or the time integration of the pressure during the impact period $\tau (\varPi = \int ^{\tau }_0 p\, {\textrm {d}}t)$. The liquid velocity $U$ is proportional to the gradient of pressure impulse $\partial \varPi /\partial z$. In the new device, the associated impulse pressure satisfies $p$ =
$p$ =  $p_a$, where $p_a$ is the atmospheric pressure, at the gas–liquid interface inside the nozzle and at the top of the container. Thus, the pressure impulse distribution can be sketched as shown by the black line in Figure 1b. The stagnation point is at the base of the nozzle shown as a dotted circle in Figure 1b. The gradient of the pressure impulse inside the nozzle $({\partial \varPi }/{\partial z})_{\textit{bottom}}$ is calculated with a geometrical relation as $({\partial \varPi }/{\partial z})_{\textit{bottom}} = {l_{\textit{top}}}/{l_{\textit{bottom}}} ({\partial \varPi }/{\partial z})_{\textit{top}}$, where $({\partial \varPi }/{\partial z})_{\textit{top}}$ is the gradient of the pressure impulse inside the container. Thus, the liquid velocity inside the nozzle $U'$ during the impact interval can be described as $U'=(l_{\textit{top}}/l_{\textit{bottom}})U_{\textit{top}}$, where $U_{\textit{top}}$ indicates the liquid velocity in the container, which is approximated to the velocity at the bottom of the container $U_0$.
During the focusing interval, previous research (Reference Kiyama, Tagawa, Ando and KamedaKiyama, Tagawa, Ando, & Kameda, 2016; Reference Peters, Tagawa, Oudalov, Sun, Prosperetti, Lohse and van der MeerPeters et al., 2013; Reference Tagawa, Oudalov, Visser, Peters, van der Meer, Sun, Prosperetti and LohseTagawa et al., 2012) has revealed that the jet velocity  $V_{jet}$ induced by the flow-focusing effect is proportional to the liquid velocity inside the nozzle $U'$. Thus, the jet velocity ratio $V_{jet} / U_0$ in our device is estimated as
 \begin{equation} \frac{V_{jet}}{U_0} = \beta \frac{l_{\textit{top}}}{l_{\textit{bottom}}} , \end{equation}
where  $\beta$, defined as the increment ratio of the jet velocity, is a coefficient related to the liquid viscosity and the flow-focusing effect determined by the initial shape of the interface (i.e. contact angle $\theta$). This physical model, (1), predicts a linear relation between the jet velocity ratio $V_{jet}/U_0$ and the length ratio ${l_{\textit{top}}}/{l_{\textit{bottom}}}$.
3. Results and Discussion
Figure 2a shows the measured velocity ratios  $V_{jet}/U_0$ for three kinematic viscosities (1, 10 and 100 mm $^{2}$ s $^{-1}$), which monotonically increased with the length ratio $l_{\textit{top}}/l_{\textit{bottom}}$. The jet generated from the new device was accelerated by more than 10 times at approximately $l_{\textit{top}}/l_{\textit{bottom}} = 15$ for 1 and 10 mm $^{2}$ s $^{-1}$. Especially, the jet velocity $V_{jet}$ of the 1 mm $^{2}$ s $^{-1}$ liquid was more than 30 times faster than the initial velocity $U_0$, although the rate of velocity increase became smaller for $l_{\textit{top}}/l_{\textit{bottom}} >40$. In contrast, the velocity ratio in the case of high viscosity (100 mm $^{2}$ s $^{-1}$) continued to increase even when $l_{\textit{top}}/l_{\textit{bottom}} > 40$. This indicated that the new device using impact with a short nozzle is suitable for ejection of highly viscous liquids because highly viscous liquids can be accelerated efficiently.

Figure 2. (a) Relation between the velocity ratio  $V_{jet}/U_0$ and the length ratio $l_{\textit{top}}/l_{\textit{bottom}}$. (b) Geometry for the numerical set-up. (c) Velocity fields and streamline immediately after the impact. (d) Pressure impulse distribution along the vertical axis. The position of the stagnation point is shown as a black dot while the predicted stagnation point is indicated by the dotted line. (e) Liquid near the edge of the nozzle. (f) Increment ratio of jet velocity $\beta$ as a function of Reynolds number $Re$.
$Re$.
When the length ratio was small ( $l_{\textit{top}}/l_{\textit{bottom}} < 15$), the experimental data agreed well with (1), which predicts a linear increase relation. However, when the length ratio was large ( $l_{\textit{top}}/l_{\textit{bottom}} > 40$), the velocity ratios $V_{jet}/U_0$ of all liquids increased nonlinearly and deviated significantly from the linear model (see Figure 2a). Hence, the model considering only the pressure impulse, as in the previous research, cannot accurately describe the jet velocity for the whole range of length ratios.
To examine the reason for the deviation between the experimental data and (1), we analysed the flow field during the impact interval. We considered the potential flow while neglecting the effect of the surface tension and the viscosity. Applying the nabla operator to the velocity  $\boldsymbol{U}$ yields $\boldsymbol {\nabla } \boldsymbol{U} = \nabla ^{2}\phi = 0$, where $\phi = -{\varPi }/{\rho }$. We solved this Laplace equation by numerical means using commercial software (COMSOL Multiphysics). The boundary conditions are shown in Figure 2b. In the numerical calculation, a triangle mesh was used, the maximum size of which was 0.1 mm under conditions of two-dimensional axisymmetry.
The calculated streamlines of the potential flow field and the magnitude of the velocity inside the new device are shown in Figure 2c. Remarkably, the position of the actual stagnation point was significantly higher than the position predicted by (1). We further analyse this flow in the next section.
4. Potential Flow Analysis and Renewed Jet Velocity Model
The solution of the Laplace equation can be used to understand the nonlinear trend of the jet velocity as a function of the length ratio  $l_{\textit{top}}/l_{\textit{bottom}}$, especially for the low-viscosity liquid in experiments. Here we solve the Laplace equation in various conditions and use the model proposed by Reference Gordillo, Onuki and TagawaGordillo, Onuki, and Tagawa (Reference Gordillo, Onuki and Tagawa2020) for predicting the jet velocity affected by the flow focusing effect at the curved interface. Note that the initial liquid velocity imposed upstream of the curved surface should be given to use the results of Reference Gordillo, Onuki and TagawaGordillo et al. (Reference Gordillo, Onuki and Tagawa2020). Thus we first calculate the initial velocity, $V$, by solving the Laplace equation numerically and then substitute $V$ into the model proposed by Reference Gordillo, Onuki and TagawaGordillo et al. (Reference Gordillo, Onuki and Tagawa2020).
The detailed procedure is as follows: In order to obtain the initial liquid velocity upstream of the curved meniscus in the nozzle, the interface shape was set as a flat shape. We set  $l_{\textit{top}}= 30$ mm, $l_{\textit{bottom}}=0.30, 0.43, 0.60, 1.0, 5.0, 9.0$ mm, $r=0.6$ mm, $R=6.2$ mm, similar to experimental values. Under each condition, the Laplace equation was solved to obtain the initial liquid velocity $V$. By substituting the initial velocity $V$ and initial contact angle $\theta = 25^{\circ }$ into the following equation proposed by Reference Gordillo, Onuki and TagawaGordillo et al. (Reference Gordillo, Onuki and Tagawa2020), the jet velocity $V_{jet}$ is
 \begin{equation} V_{jet} = Vv_{n0}\left(\frac{k^{2}}{3 + k^{2}}\right)^{-{2}/{3}}, \end{equation}
where  $v_{n0}=0.31\cos \theta +0.90 \fallingdotseq 1.2$ and $k^{2}=1.60/\cos \theta +0.33 \fallingdotseq 2.1$ in this calculation.
Figure 2a shows the jet velocity predicted by solving the Laplace equation and using the model of Reference Gordillo, Onuki and TagawaGordillo et al. (Reference Gordillo, Onuki and Tagawa2020). The jet velocity increased non-monotonically with increasing the length ratio  $l_{\textit{top}} /l_{\textit{bottom}}$. This trend was quite consistent with the jet velocity measured in experiments. The quantitative agreement between the jet velocities by the calculation and those in the experiment was achieved for lower length ratio $l_{\textit{top}} /l_{\textit{bottom}}$, while the simulated result was slightly larger than the experimental one when the length ratio $l_{\textit{top}} /l_{\textit{bottom}}$ was large. A possible reason is the viscous drag in the experiments.
To further understand this nonlinear trend of the jet velocity, we plot the pressure impulse distribution along the vertical axis of the device in Figure 2d. The position of the stagnation point indicated by the black marker in the inset of Figure 2d was significantly different from the predicted position denoted by the dashed line for larger length ratio  $l_{\textit{top}} /l_{\textit{bottom}}$. Furthermore, the pressure impulse at the stagnation point slightly decreased as the length ratio $l_{\textit{top}} /l_{\textit{bottom}}$ increased. This is why the predicted jet velocities by the previous model (Reference Onuki, Oi and TagawaOnuki et al., 2018) deviated from the experimental results for large length ratio $l_{\textit{top}} /l_{\textit{bottom}}$.
For the physical interpretation, solving the Laplace equation and using the model of Reference Gordillo, Onuki and TagawaGordillo et al. (Reference Gordillo, Onuki and Tagawa2020) may be good enough. Nevertheless, we believe that a simple model which explicitly includes the lengths,  $l_{\textit{top}}, l_{\textit{bottom}}$ and $r$, is quite useful for designing such jetting devices. Therefore we revise the pressure impulse model of Reference Onuki, Oi and TagawaOnuki et al. (Reference Onuki, Oi and Tagawa2018) as described below.
The actual pressure impulse distribution can be illustrated as the red solid line in Figure 1b. The distance between the actual stagnation point and the predicted stagnation point is denoted as  $l_s$. The gradient of the pressure impulse considering the distance $l_s$ is described as $({\partial \varPi }/{\partial z})_{bottom^{*} } = ({l_{\textit{top}}-l_{s}})/({l_{\textit{bottom}}+l_{s}})({\partial \varPi }/{\partial z})_{top^{*} }$, where $({\partial \varPi }/{\partial z})_{bottom^{*} }$ and $({\partial \varPi }/{\partial z})_{top^{*} }$ are the actual gradients of the pressure impulse under and above the stagnation point, respectively. Thus, the liquid velocity under the actual stagnation point $U'_{new}$ is
 \begin{equation} U'_{new} = \frac{l_{\textit{top}}-l_{s}}{l_{\textit{bottom}} + l_{s}}U_{0}.\end{equation}
To predict the distance  $l_s$, we consider the mass conservation of the liquid near the nozzle. The control volume is indicated by a red dashed rectangle in Figure 2e. Assuming that the inlet mass flow comes through the side of the control volume with velocity $U_{in}\sim U_0$ and the outlet mass flow goes through the bottom of the control volume with the velocity $U'_{new}$, we obtain $\pi r^{2} U'_{new} = 2\pi r l_{s} U_{0}$, where $r$ is the radius of the nozzle (see Figure 2e). Thus, the new jet velocity model is
 \begin{equation} \frac{V_{jet\_new}}{U_0} = \beta \frac{-(2l_{\textit{bottom}} + r) + \sqrt{(2l_{\textit{bottom}} + r)^{2} + 8r l_{\textit{top}}}}{2r}. \end{equation}
The velocity ratio is affected greatly by the absolute values of  $l_{\textit{top}}$, $l_{\textit{bottom}}$ and $r$.
$r$.
To validate the new model, the new models for 1 mm $^{2}$ s $^{-1}$ and 10 mm $^{2}$ s $^{-1}$ are shown in Figure 2a as red and blue solid curves, respectively. The two solid curves are drawn with changing $l_{\textit{bottom}}$ and with fixed $l_{\textit{top}} = 60$ mm, $U_0 = 1.0$ m s $^{-1}$, $r = 0.6$ mm, $\beta = 2.17$ (red) and $\beta = 1.67$ (blue). The new model, (4), shows a nonlinear trend, similar to the experimental results, which cannot be described with the previous linear model, (1). For further validation, we focused on the relation between the increment ratio $\beta$ and Reynolds number $Re (= U'_{new} r/\nu$), as previous research found that $\beta$ is a function of $Re$ because $\beta$ is affected by viscous drag during the focusing interval. Figure 2e shows that the results of the previous research and current research are in good agreement, which indicates that the new model successfully predicts $U'_{new}$.
5. Conclusion
We propose a new device to solve a problem in previous research for a highly viscous on-demand printing technology. The new device ejects highly viscous liquid, such as commercial car paint with a zero-shear viscosity of 100  $\textrm {Pa} \cdot \textrm {s}$. The jet velocity was increased by approximately up to 30 times the impact velocity. The experimental results showed that the linear model, (1), which considers only the pressure impulse, cannot describe the nonlinear behaviour of the jet velocity as a function of the length ratio $l_{\textit{top}}/l_{\textit{bottom}}$. To explore the reason for this, we solved the Laplace equation by numerical means and found that the position of the stagnation point of the flow inside the container is significantly higher than that assumed by the linear model, (1). Here we solve the Laplace equation for obtaining the initial velocity imposed upstream of the curved surface and use the flow focusing model proposed by Reference Gordillo, Onuki and TagawaGordillo et al. (Reference Gordillo, Onuki and Tagawa2020). Remarkably the nonlinear behaviour of the jet against the length ratio $l_{\textit{top}}/l_{\textit{bottom}}$ is successfully reproduced. Furthermore, to obtain technologically useful information, we revise the previous model (Reference Onuki, Oi and TagawaOnuki et al., 2018) by considering mass conservation as well as the pressure impulse. The new model closely describes the nonlinear behaviour of the jet velocity. These results indicate that the device we developed can be applied to a drop-on-demand painting system with highly viscous liquids, such as automobile painting.
Acknowledgements
We thank Y. Nishi for applying automotive paint to the car body panels.
Funding Statement
This work was supported by the Japan Society for the Promotion of Science, KAKENHI Grant Nos 17H01246 and 20H00223, and Adaptable and Seamless Technology transfer Program through Target-driven R&D (A-STEP) from Japan Science and Technology Agency (JST).
Declaration of Interests
The authors report no conflict of interest.
Author Contributions
Conceptualization, Y.T.; methodology, K.K. and H.O.; data curation, K.K.; data visualisation, K.K.; writing original draft, K.K. and Y.T. All authors approved the final submitted draft.
Data Availability Statement
The data that support the findings of this study are available within the article.
Ethical Standards
The research meets all ethical guidelines, including adherence to the legal requirements of the study country.


 Open access