


1. Introduction
Although tropical peatlands cover only ~300,000–500,000 km2 (Page et al., Reference Page, Rieley and Banks2011), they are an important carbon store (~2% of global soil carbon; Sabine et al., Reference Sabine, Heimann, Artaxo, Bakker, Chen, Field, Gruber, Le Quéré, Prinn, Richey and Romero Lankao2004). Southeast Asia (SEA) contains a large area of tropical peatlands (248,000 km2), storing up to 68.5 Gt of soil carbon or ~77% of the tropical peat carbon pool (Page et al., Reference Page, Rieley and Banks2011). However, between 1990 and 2007, 51,000 km2 of peat swamp forests in Peninsular Malaysia, Sumatra, and Borneo have been deforested and drained (Miettinen & Liew, Reference Miettinen and Liew2010). The lowering of groundwater levels and increase in soil temperatures (Sano et al., Reference Sano, Hirano, Liang, Hirata and Fujinuma2010) have been found to increase CO2 emissions from soil respiration (Hooijer et al., Reference Hooijer, Page, Jauhiainen, Lee, Lu, Idris and Anshari2012). Decomposition of these drained peatlands release 355–855 Mt of CO2 annually (Hooijer et al., Reference Hooijer, Page, Canadell, Silvius, Kwadijk, Wösten and Jauhiainen2010), contributing to global carbon emissions.
2. Objective
Recognizing the carbon losses from drained peat suggests that land clearance incurs a high “carbon debt” or “carbon payback time” (Danielsen et al., Reference Danielsen, Beukema, Burgess, Parish, Bruehl, Donald, Murdiyarso, Phalan, Reijnders, Struebig and Fitzherbert2009). A small number of studies report higher soil CO2 flux from drainage-affected peat swamp forests than deforested burnt peatlands (Jauhiainen et al., Reference Jauhiainen, Limin, Silvennoinen and Vasander2008), as well as oil and sago palm plantation sites (Melling et al., Reference Melling, Hatano and Goh2005), which provided evidence to support this proposition. Our goal was to provide additional estimates of CO2 emissions associated with decomposition from degraded and intact peatland using soils collected in Northern Borneo.
3. Methods
Soil samples (3× per site—10 cm diameter, 10 cm depth) were collected from degraded and intact peat at four sites in July 2014 (Figure 1; Jaafar et al., Reference Jaafar, Sukri and Procheş2017). Degraded sites had modified drainage and fire damage. Cores were sealed individually and transported to King’s College London. CO2 fluxes per core were measured using the LI-COR 6400-09. An airtight seal using a collar (10 cm diameter and 4.5 cm height) with 2.5 cm between the chamber bottom and peat was used. To avoid CO2 build-up, 400 ppm and delta of 5 ppm were used; efflux was measured from the mean of five cycles (LI-COR, 2011). A subsample of peat was used for organic content. Two-way ANOVA was used to test for location and forest condition effects on CO2 flux. Mann–Whitney was used for differences in organic content between forest conditions.
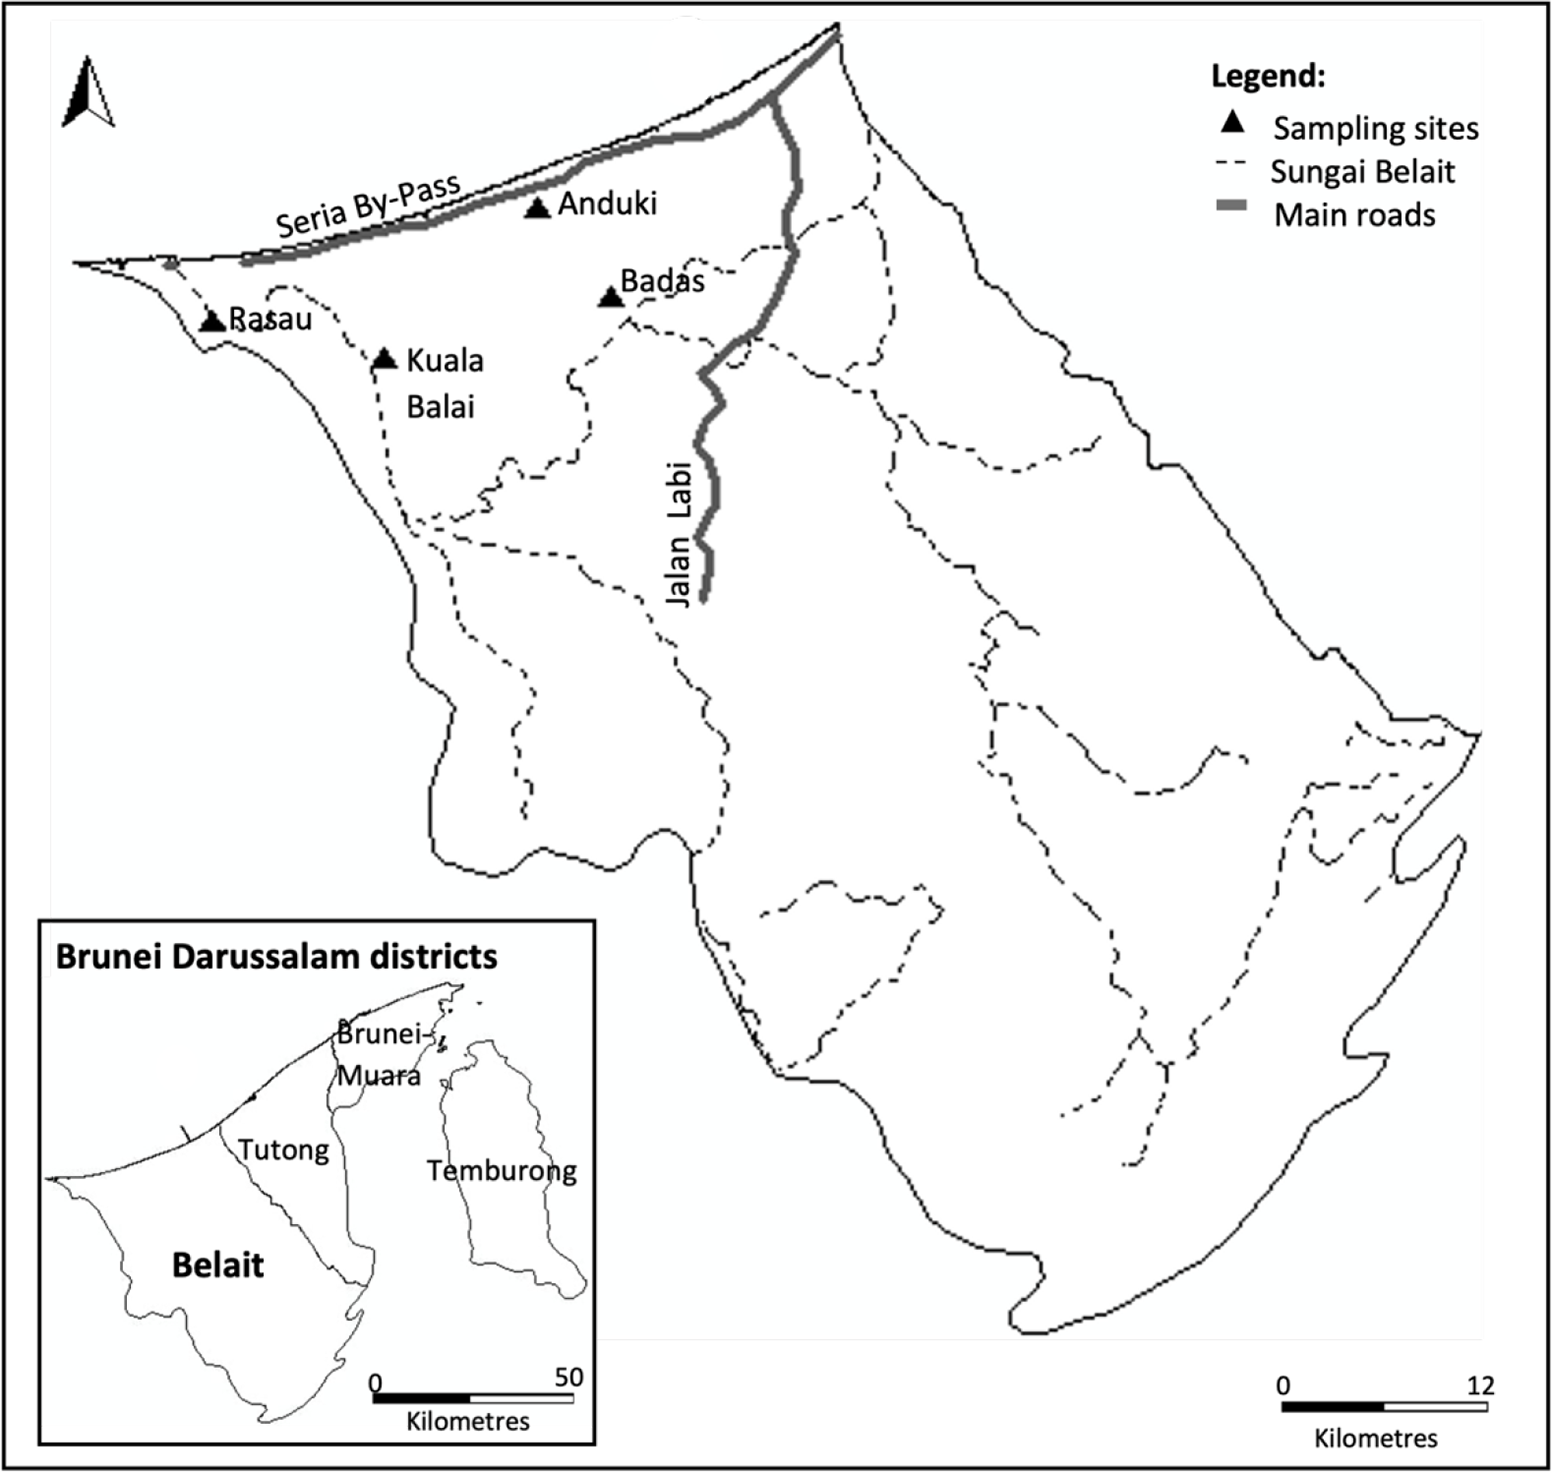
Figure 1. Location of peat sampling sites in the Belait District of Brunei Darussalam.
4. Results
Median CO2 flux of intact peat (0.977 ± 0.167 μmol CO2 m−2 s−1) was greater than degraded peat (0.565 ± 0.085 μmol CO2 m−2 s−1; Figure 2). Among the four locations, Anduki had the lowest flux and Badas had the highest (~0.25 vs. ~0.8 μmol CO2 m−2 s−1; Figure 2). Forest condition was a significant effect for CO2 flux (p = .022), but not location (p > .05) and there was no forest condition–location interaction (p > .05). Organic content (20–99%) was not significantly different between forest conditions (p > 0.05). However, Anduki sites had lower organic content and showed a more marked difference between intact and degraded samples. This may be due to Anduki being more similar to secondary forest than the other peat swamp locations (Jaafar et al., Reference Jaafar, Sukri and Procheş2017). Regardless, CO2 flux observed between forest types could not be attributed to differences in soil organic content (Figure 3).
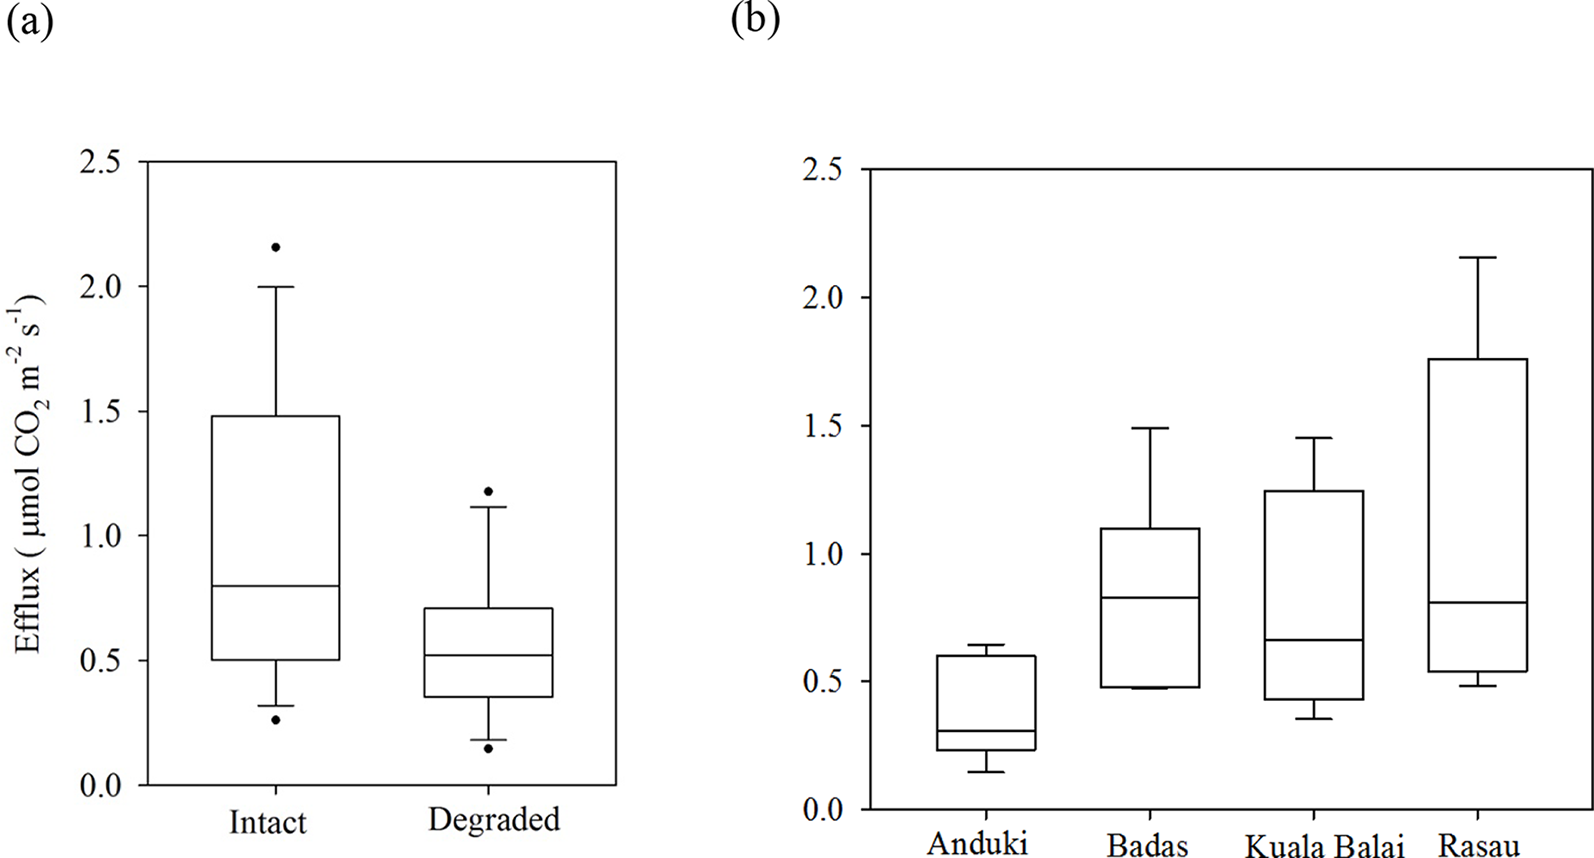
Figure 2. Boxplots of peat CO2 flux by (a) forest condition (n = 12 for each condition) and (b) location (n = 6 for each location). Circles represent outliers. *p < .05; NS, not significant.
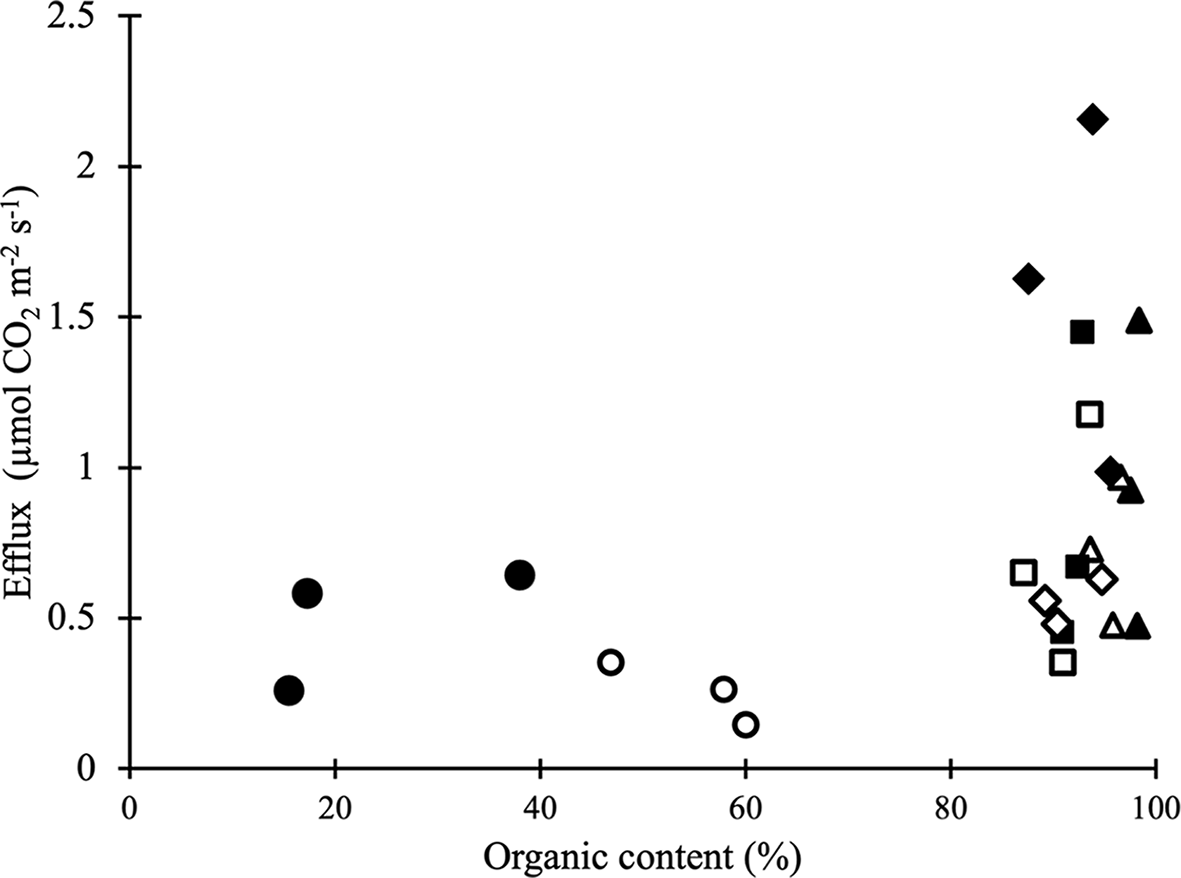
Figure 3. Scatterplot of peat CO2 flux against soil organic content. Different symbols are used to represent the location (circle: Anduki; inverted triangle: Badas; square: Kuala Balai; diamond: Rasau) and condition (filled: intact; empty: degraded) of sampling sites.
5. Discussion
We found lower emissions for degraded site compared to drainage-affected peat, oil palm, and Sago plantations (Melling et al., Reference Melling, Hatano and Goh2005) and from Kalimantan forests (Jauhiainen et al., Reference Jauhiainen, Limin, Silvennoinen and Vasander2008). These differences are expected because only emissions from peat and no other sources were measured in our lab-based estimates. Organic content for all sites were similar despite flux differences and this suggests more labile carbon at intact sites. One feature of our lab-based protocol is root respiration is eliminated and fluxes represent only decomposition. Nonetheless, ex situ measurement will vary from in situ values (Wang et al., Reference Wang, Zu, Wang and Takayoshi2005) and future field-based studies are needed.
6. Conclusions
These results provide evidence of higher CO2 emissions from intact than degraded forests. We caution that this should not be interpreted as evidence suggesting intact peat swamp forests are greater contributors to CO2 emissions than degraded lands. Rather, we suggest our findings provides empirical evidence to support the proposition that clearance of undisturbed peat swamp forests will incur a higher carbon debt for biofuel production than conversion of degraded forest sites (Danielsen et al., Reference Danielsen, Beukema, Burgess, Parish, Bruehl, Donald, Murdiyarso, Phalan, Reijnders, Struebig and Fitzherbert2009), due to higher CO2 emissions from peat decomposition.
Acknowledgments
The authors thank the Forestry Department of Brunei Darussalam and BioRIC for the entry permit and export permit respectively. Field assistance was provided by UBD undergraduates Khalish Hafizhah and Adrian Suhaili. Bruce Main (KCL) provided technical support in the lab. This research is in association with The International Consortium of Universities for the Study of Biodiversity and the Environment (iCUBE), a network of universities aimed at promoting collaborative research and education on biodiversity, climate change and the environment.
Funding Statement
This work was funded in part by the Department of Geography, King’s College London, the Royal Geographic Society and the International Consortium of Universities for the Study of Biodiversity and the Environment (iCUBE).
Author Contributions
M.A.C., T.E.L.S., and R.S.S. designed the field experiments and collected the samples. E.L.Y.S.I. designed, planned, and conducted all of the lab work, data analysis, and wrote the first draft. All authors contributed to writing the final draft of this research.
Data availability Statement
All data are presented within the paper.


 Open access
Comments
Comments to the Author: This is an interesting and well presented manuscript investigation the CO2 emissions from intact and degraded peatlands in SE Asia. I have some, hopefully, minor concerns which are detailed below.
The title could include that this in a lab-based experiment.
Soil respiration is mentioned. Howoever, it would be more appropriate to focus on heteretrophic respiration because you don’t have the root respiration component. Compare your results with results from heterotrophic respiration studies rather than total respiration.
It would be nice to define a hypothesis for your study. I found several similitudes between your findings and those from Cooper et al. 2020. For example, your samples from “intact forest” could represent the initial phase of conversion and your degraded peat samples could represent the mature oil palm plantation from such study. Your CO2 efflux was 0.4 umol/m2/s higher in the “intact” forest than in the degraded site and this is comparable to the 50% higher emissions found by the Cooper et al. study during the initial phases of peat swamp forest conversion. Your findings could support the hypothesis that conversion of peat swamp forests to other land uses result in higher CO2 emissions from heterotrophic respiration.
Provide more information about the degraded site (current land use and site-specific conditions)
Was the soil moisture content the same across all samples?)
Fig1. Add part of Peninsular Malaysia to the small map with the “Brunei Darussalam districts” so it is clearer where is located. Add a peatland layer (if available)
Fig3. CO2 seems to exponentially increases with OM. I wonder if it could be possible to fit an exponential regression. Would this be useful? If so, discuss.