


Introduction
Psychosis affects approximately 3% of the population, usually in adolescence or early adulthood [Reference Solmi, Radua, Olivola, Croce, Soardo and Salazar de Pablo1], with major functional, social, and occupational impacts. However, the recent deployment of early intervention has allowed us to revise our view of schizophrenia (SCZ), which now appears as the chronic stage of a disorder that could be prevented if appropriate care were provided at earlier stages [Reference Zheng, Xu, Zhu, Li, Wang and Livingstone2–Reference McDaid, Park and Wahlbeck4]. Although it is possible to identify subjects with attenuated psychotic symptoms (subthreshold hallucinations or delusions), known as “ultra-high risk” for psychosis (UHR), it remains very difficult to predict clinical outcomes. Approximately a quarter to one-third of UHR will have a first episode of psychosis (FEP), mostly during the first year [Reference Fusar-Poli, Salazar de Pablo, Correll, Meyer-Lindenberg, Millan and Borgwardt5, Reference Fusar-Poli, Cappucciati, Borgwardt, Woods, Addington and Nelson6]. Adding to this complexity, the UHR and FEP stages may be preceded by nonspecific symptoms of anxiety and major depressive disorder (MDD) [Reference Howes and Murray7]. Psychosis is frequently comorbid with autism spectrum disorders (ASD) [Reference King and Lord8] and progression can lead not only to SCZ but also to mood disorders [Reference Nieman and McGorry9]. Such a phenotypic overlap is explained by shared environmental stressors (e.g. cannabis, social stress) [Reference Misiak, Stramecki, Gawęda, Prochwicz, Sąsiadek and Moustafa10], genetic [Reference Baselmans, Yengo, van Rheenen and Wray11, Reference Lee, Anttila, Won, Feng, Rosenthal and Zhu12], and structural brain similarities across diseases [13]. In light of this clinical and biological continuum, a transdiagnostic approach is required to identify diagnostic and prognostic biomarkers.
Electroencephalography (EEG) is a simple, accessible, and inexpensive tool already widely used in routine psychiatric practice to rule out possible neurological comorbidities. From a frequency point of view, abnormalities of neural oscillations or evoked potentials in EEG are well known in psychosis and particularly during late adolescence [Reference Uhlhaas and Singer14]. But it is also possible to study the resting-state temporal dynamics of neuronal networks throughout the brain, from a spatial perspective [Reference Gavaret, Iftimovici and Pruvost-Robieux15]. At rest, brain activity alternates very rapidly, around every 100 ms, between states of unstable equilibrium, called EEG microstates, and characterized by a particular polarization of the electric potential field across the whole brain [Reference Michel and Koenig16]. In the global neuronal workspace framework [Reference Dehaene, Kerszberg and Changeux17], these microstates may correspond to the spatial organization of particular modes of information processing [Reference Michel and Koenig16]. Of the four microstates classically described (A, B, C, and D), two are especially relevant for psychosis. Microstate C has been correlated with positive BOLD activations in the resting-state networks involved in the integration of interoceptive information associated with emotional salience, and it may reflect a predominantly self-referential mode [Reference Britz, Van De Ville and Michel18]. Microstate D was correlated with negative BOLD signals in resting-state networks involved in attentional aspects, such as the detection of relevant behavioral stimuli and the ability to switch and redirect attention [Reference Britz, Van De Ville and Michel18].
It has been postulated that psychosis would be characterized by an imbalance between a predominant self-referential mode (microstate C) and a decreased attentional mode (microstate D), reflecting a disconnection between mental states on the one hand, and information received from the environment on the other. Indeed, an increased ratio of microstate C over D has already been reported in SCZ [Reference Rieger, Diaz Hernandez, Baenninger and Koenig19], while antipsychotic treatment seems to increase the duration of class D [Reference Yoshimura, Koenig, Irisawa, Isotani, Yamada and Kikuchi20, Reference Kikuchi, Koenig, Wada, Higashima, Koshino and Strik21]. At earlier stages, microstate analysis provided more conflicting results. UHR subjects who subsequently have a first psychotic episode appear to have less class D in general, but no significant results are found for class C [Reference de Bock, Mackintosh, Maier, Borgwardt, Riecher-Rössler and Andreou22]. Relatives of subjects with SCZ have more class C and less class D [Reference da Cruz, Favrod, Roinishvili, Chkonia, Brand and Mohr23], which is also the case for subjects with 22q11.2 deletion, who are at a very high genetic risk of psychosis (more than 40% of them will develop a psychotic disorder) [Reference Tomescu, Rihs, Roinishvili, Karahanoglu, Schneider and Menghetti24]. Conversely, a study comparing treated and untreated FEP did not find significant differences between classes C and D [Reference Mackintosh, Borgwardt, Studerus, Riecher-Rössler, de Bock and Andreou25]. Moreover, while anomalies in the sequence of these microstates have been suggested as a possible endophenotype of SCZ spectrum disorders, there is not, to the best of our knowledge, any transdiagnostic study addressing the specificity of such a biomarker, across the spectrum of psychosis and compared to autism and mood spectrum disorders. Notably, a class D decrease has also been proposed to be a biomarker for depression [Reference Murphy, Whitton, Deccy, Ironside, Rutherford and Beltzer26–Reference Lei, Liu, Zhang, Guo, Liu and Hu28], whereas the distribution of class C and D in autism remains equivocal, with a trend of less class C compared to controls [Reference D’Croz-Baron, Baker, Michel and Karp29–Reference Kalburgi, Whitten, Key and Bodfish32].
Here, we present the first transdiagnostic study of the imbalance between microstates C and D in psychosis spectrum disorders (ultra-high-risk [UHR] of psychosis, FEP, recent-onset SCZ), mood disorders (MDD and bipolar disorder [BIP]), and ASD, in comparison with controls without a psychiatric disorder, using routine clinical EEG setting.
Methods
Participants
This retrospective study did not modify the usual medical practices, allowing the recruitment of patients whose EEG was recorded as part of routine and systematic clinical evaluation. All patients and controls provided informed consent following the regulation authorities, under the promotion of the DRCI (Direction Recherche Clinique Innovation) of the GHU Paris Psychiatry and Neurosciences. We retrospectively screened all subjects assessed between 2018 and 2020 at the early psychosis outpatient unit (C’JAAD), who underwent at the same time an EEG recording in the neurophysiology department of the GHU Paris Psychiatry and Neurosciences. The inclusion criteria of the study were as follows: (1) a diagnosis of ultra-high risk diagnosis of psychosis, according to the CAARMS scale [Reference Yung, Yuen, Mcgorry, Phillips, Kelly and Dell’olio33] in its French-translated version [Reference Krebs, Magaud, Willard, Elkhazen, Chauchot and Gut34], or of first episode psychosis, SCZ, MDD, BIP, or ASD, defined according to the DSM-5 nomenclature and the positive Autism Diagnostic Observation and Autism Diagnostic Interview-Revised scales for autism diagnosis [35]; and (2) to be untreated (antipsychotics, antidepressants, or benzodiazepines), or to have minimal treatment, introduced only recently (less than 2 weeks). The exclusion criteria of the study were as follows: a severe underlying neurological disease (epilepsy, brain injury, etc.) with abnormal brain MRI or abnormal EEG. Drug use (especially cannabis) was not an exclusion criterion, and could not be evaluated because of the retrospective nature of the study. Control subjects were also included retrospectively among patients assessed in the neurophysiology department for migraine, who presented a normal EEG and strictly no other neurological or psychiatric sign or symptom after specialist evaluation.
EEG recording and preprocessing
Routine clinical EEGs had a mean duration of 20 ± 3 min. They were performed at rest in a half-seated position, and included rest sequences with eyes closed, and eyes open, followed by stimulation procedures (hyperpnea and then intermittent photic stimulation), all of which were annotated. Only sequences at rest with eyes closed and before hyperpnea were kept for analysis. The EEG setup was 19 electrodes, following the international 10–20 system [Reference André-Obadia, Sauleau, Cheliout-Heraut, Convers, Debs and Eisermann36]. Sampling rate was 256 Hz. Raw EEG recordings were stored in BIDS format following international recommendations [Reference Appelhoff, Sanderson, Brooks, van Vliet, Quentin and Holdgraf37]. Preprocessing was done using the MNE EEG software on Python [Reference Gramfort38], following the OHBM COBIDAS MEEG good practice recommendations [Reference Pernet, Garrido, Gramfort, Maurits, Michel and Pang39]. Notably, a bandpass filter between 0.5 and 40 Hz was applied before the segmentation, in order to avoid edge effects, and segmentation with the elimination of sequences annotated other than “eyes closed” was done before re-referencing to the mean, to avoid spatial extension of artifacts [Reference Pernet, Garrido, Gramfort, Maurits, Michel and Pang39]. Next, each trace was visually reanalyzed to ensure that it was indeed an alpha-dominant, resting rhythm without any residual artifact. Finally, a last quality check of the EEGs was done for each EEG separately, using the spectral power density graph, to also ensure that frequencies between 8 and 13 Hz were predominant. Only one artifacted channel per EEG was tolerated, and in this case, interpolated. EEGs with more than one artifacted channel were excluded from the analysis.
Microstate analysis
Microstate analysis was done using the Pycrostates package developed by Victor Férat (github.com/vferat/pycrostates) [Reference Férat, Scheltienne, Brunet, Ros and Michel40]. Global field power (GFP) was determined for each participant. Only EEG topographies at GFP peaks were retained to determine microstates’ topographies, through a modified K-means clustering. The silhouette score provided an optimal number of clusters of four, which allowed comparison with the literature (Supplementary Figure S1). We checked the comparability between clusters of each group by applying a two-step clustering: at the subject level, we computed individual topographies from GFP peaks; then, at the group level, we concatenated all individual topographies from the same group into a single dataset for a second round of clustering. We then computed the spatial correlation between each group’s maps and the control maps. To allow comparison across groups and obtain reference topographies independent of psychiatric pathologies, we backfitted the control maps on the whole EEG recordings of the disease groups. Temporal smoothing (82 ms full window size) was applied to ensure that periods of inter-peak noise, of low GFP, did not interrupt the sequences of quasi-stable segments [Reference Pascual-Marqui, Michel and Lehmann41]. For each subject, three parameters were computed for each class: frequency of occurrence (“occurrence”), temporal coverage (“coverage”) and mean duration. Occurrence is the average number of times a given microstate occurs per second. Coverage (in %) is the percentage of total analysis time spent in a given microstate. Mean duration (in ms) is the average time during which a given microstate was present in an uninterrupted manner (after temporal smoothing).
Statistical analysis
Comparisons of the three microstate parameters (duration, coverage, occurrence) were done for class C, class D, and the ratio of class C over D, between each disease group and controls. We tested the hypothesis that each disease group significantly differed from the controls for values of parameters of class C, class D, and ratios of class C over D. To allow comparison between groups, we used Bayesian estimation with the BEST code in Python [Reference Kruschke42, Reference Salvatier, Wiecki and Fonnesbeck43]. A prior t-distribution was assumed before a Markov chain Monte Carlo algorithm was applied to estimate the posterior distribution. This provided posterior estimations of the means, standard deviations, and effect sizes of the difference between each group and the controls. The measure of statistical certainty was the posterior probability for the effect sizes to be outside of the region of practical equivalence (ROPE), defined for an effect size as the interval between −0.1 and 0.1 [Reference Kruschke42], with a threshold set at 95%. Differences in class C, D, and C/D ratios among all disease groups, and for each of the three parameters separately, were computed with a one-way ANOVA, adjusted for age and sex. Applicability of ANOVA was verified: (i) the groups were independent; (ii) each sample came from a normally distributed population, which we tested by comparing each group against a normal distribution; and iii) homoscedasticity was true, with equal standard deviations amongst disease groups, based on the Levene test.
Results
Characteristics of the dataset
We screened a total of 195 patients with psychiatric diseases and excluded 60 patients who had an EEG of poor quality. Along the remaining 135 patients, 11 control subjects were also included. Population characteristics are summarized in Table 1. After preprocessing the closed-eyes resting-state recordings, all groups showed an equivalent predominance of alpha-band frequency, between 8 and 13 Hz (Figure 1).
Table 1. Population.

Note: ANOVA and χ2 were computed including all groups except controls.
Abbreviations: ASD, autism spectrum disorder; BIP, bipolar disorder; CTRL, controls; FEP, first-episode psychosis; MDD, major depressive disorder; SCZ, schizophrenia; UHR, ultra-high-risk.
Bolded value stands for Statistically significant value (p < 0.05).
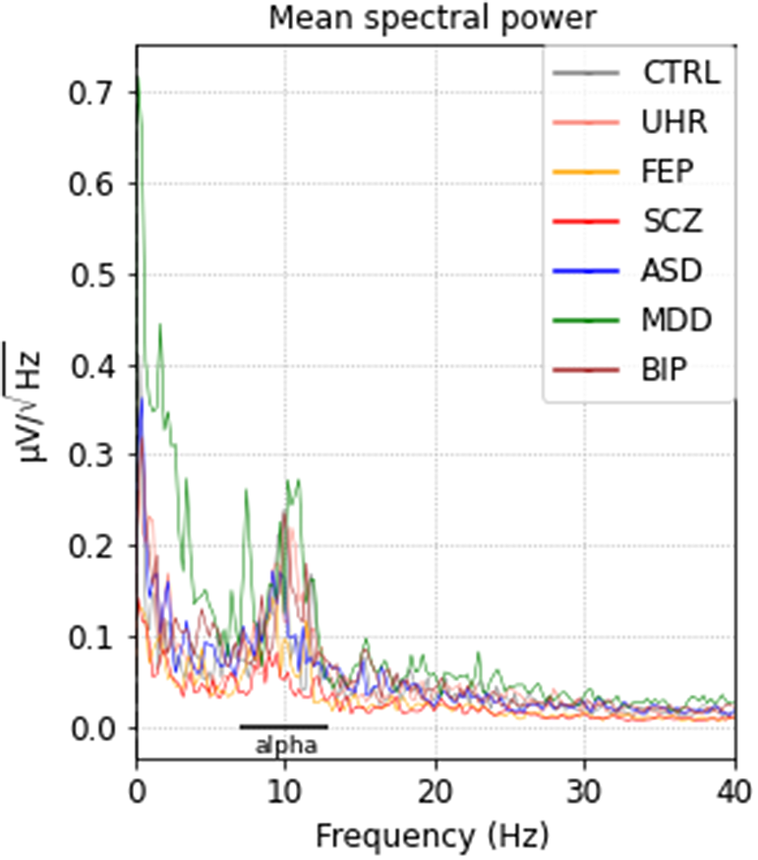
Figure 1. Mean spectral power densities for each group after preprocessing. ASD, autism spectrum disorder; BIP, bipolar disorder; CTRL, controls; FEP, first-episode psychosis; MDD, major depressive disorder; SCZ, schizophrenia; UHR, ultra-high-risk.
Microstate topographies
The modified K-means clustering in four maps found topographies A, B, C, and D, similar to what has been reported in the literature. The average absolute spatial correlation between the class maps of controls and each of the groups was high: 0.91 for class A, 0.90 for class B, 0.96 for class C, and 0.95 for class D (Figure 2). The distribution of maps was most similar between major depression disorder, UHR, FEP, ASD, and controls. Less stable maps were found in the BIP and SCZ groups. In this case, despite a relatively high inter-group spatial correlation between the same classes, we observed in some cases higher correlations between different classes. This reflects less stability and reliability of the respective maps.

Figure 2. Spatial correlations between the four clusters of each disease group and the controls.
Comparison of class C, class D, and class C/class D ratios
Regarding class C, there was no significant difference between groups and controls, with not any significant effect-size for microstate parameters of class C.
Regarding class D, there was an overall decrease in all groups compared to controls. For occurrence, the effect-size of the difference with controls was significant for SCZ and ASD. For coverage, the effect-size of the difference with controls was significant for FEP, SCZ, and ASD. For the mean duration, the effect-size of the difference with controls was significant for BIP, FEP, and SCZ (Figure 3, Table 2).
Table 2. Comparisons of the ratios of class C over class D for each microstate parameter (occurrence, coverage, mean duration), between each disease group and the controls.
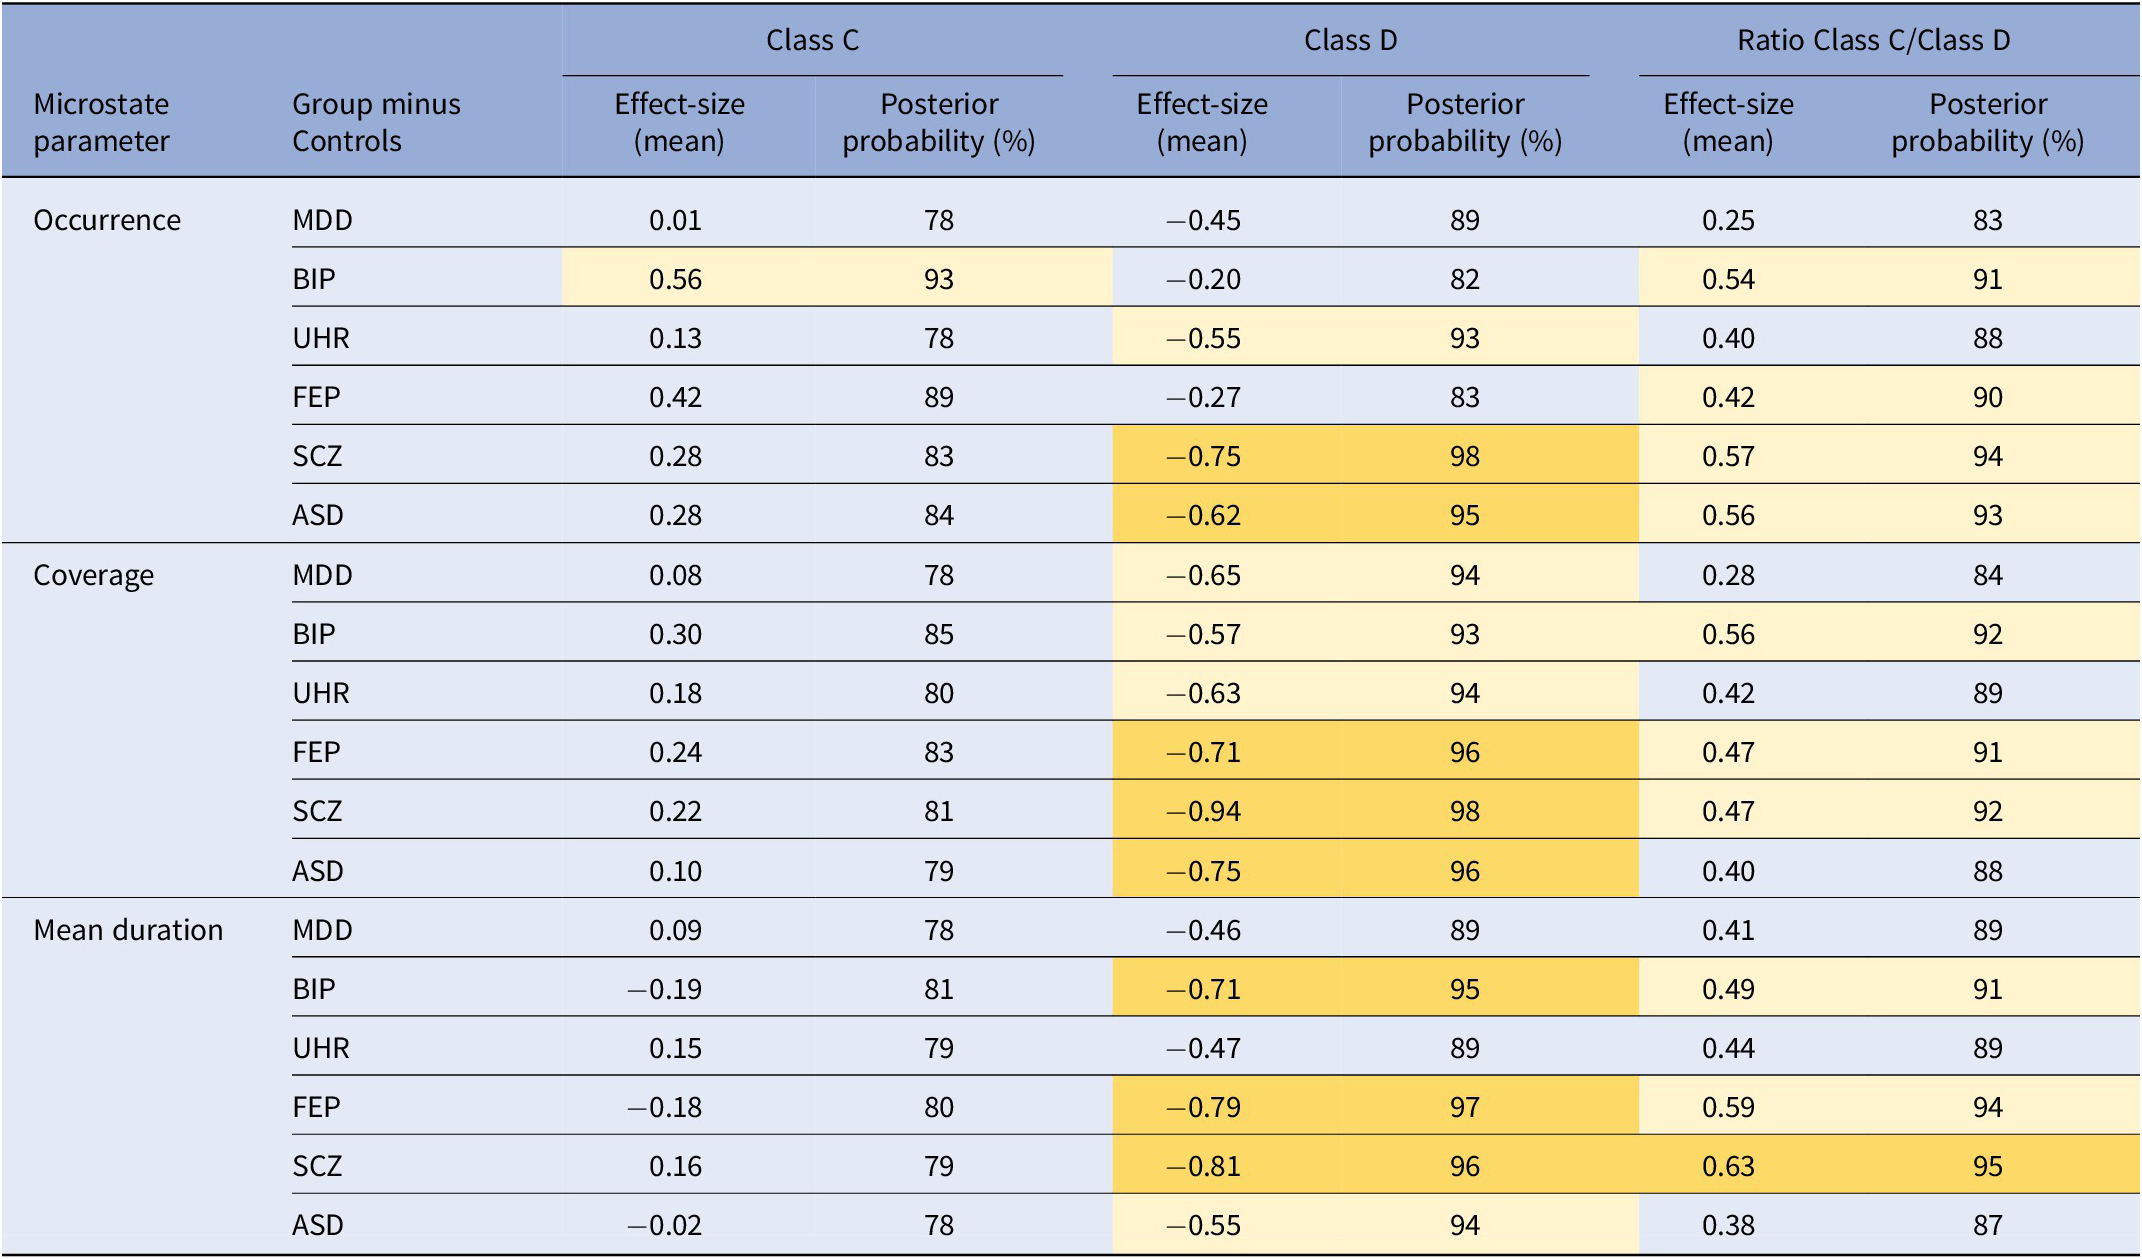
Note: The posterior probability is the probability for the effect size of the difference to be outside of the region of practical equivalence, between −0.1 and 0.1.
Abbreviations: ASD, autism spectrum disorder; BIP, bipolar disorder; FEP, first-episode psychosis; MDD, major depressive disorder; SCZ, schizophrenia; UHR, ultra-high-risk.

Figure 3. Posterior estimation of the effect-size of the difference in microstate D parameters (occurrence, coverage, mean duration) between each disease group and the controls. The red dotted interval represents the region of practical equivalence. HDI: 90% highest density interval of the posterior estimation.
Regarding the class C / class D ratio, only the effect-size of the difference between SCZ and controls was significant (Table 2).
The ANOVA analysis found no significant difference for any microstate parameter among disease groups (Supplementary Figure S2 and Supplementary Table S1). However, regarding class B, the effect-size of the difference with controls was also significantly positive for occurrence (in BIP, FEP, SCZ, and ASD) and for coverage (in FEP, SCZ, ASD) (Supplementary Figure S3 and Supplementary Table S2).
Discussion
In this retrospective study, we presented a transnosographic EEG microstate analysis across psychosis spectrum disorders, mood disorders, and ASD based on routine recordings. We investigated whether the hypothesized imbalance between an increased microstate C and a decreased microstate D was characteristic of any specific stage of psychosis, from UHR to FEP and SCZ, or whether this was also found in MDD and BIP, as well as ASD. To this end, we applied a spatial modified-k-means clustering to the EEG recordings, during resting-state with eyes closed, of seven independent groups (the six disease groups and a control group). First, we obtained microstate topographies independent of any psychiatric disorder by building a clustering in the control group. We observed the same four microstate topographies as those reported in the literature, especially microstate C, thought to be related to interoception and a self-referential mode, and microstate D, which may involve externally driven aspects of attention [Reference Britz, Van De Ville and Michel18]. An increase in the ratio of microstates C over D could therefore reflect the imbalance in information processing previously reported in subjects with psychosis. Delusion may stem from an unwavering adherence to an internal idea despite contradictory external information, a hypothesis in line with the loss of context described by Jasperian phenomenology as one of the roots of delusion [Reference Mishara and Fusar-Poli44].
The high spatial correlation between maps built independently in each disease group and those from the controls allowed us to apply the control topographies to all disease groups, and compute three parameters (occurrence, coverage, and mean duration) of each microstate in each disorder. We could then assess for each parameter their ratios of microstate C over microstate D and compare them with controls. Microstate class C parameters were not different between groups and controls. This is in line with a recent report of no increase in microstate C in early psychosis [Reference de Bock, Mackintosh, Maier, Borgwardt, Riecher-Rössler and Andreou22]. Conversely, microstate class D parameters were systematically decreased in disease groups compared with controls. This was especially significant for FEP (coverage and mean duration), SCZ (occurrence, coverage, and mean duration), and ASD (occurrence and coverage). Interestingly, the effect size of the difference with controls increased along the psychosis spectrum for class D coverage (UHR: –0.63; FEP: –0.71; SCZ: −0.94) and mean duration (UHR: –0.47; FEP: -0.79; SCZ: −0.81). These results suggest that class D parameters may be markers of stage along the psychosis spectrum. However, since ASD also showed significant decreases in class D occurrence and coverage, class D parameter decrease may not be specific to psychosis and may rather reflect a shared dimension on the SCZ-autism spectrum. This is not surprising as class D is believed to be a broad proxy measure for external attention, and it further illustrates at the EEG microstate level the continuum between psychosis and ASDs that is well described from genetics to neuroimaging [Reference Lee, Anttila, Won, Feng, Rosenthal and Zhu12, 13]. Nevertheless, when directly looking at the imbalance between class C and class D, it only differs significantly from controls for the mean duration in SCZ subjects, while for each parameter (occurrence, coverage, and mean duration), there is an increase along the psychosis spectrum from UHR, to FEP, to SCZ. This increase of imbalance during the emergence of psychosis coincides with the physiological increase in C and decrease in D that normally occur in healthy subjects between 16 and 25 years [Reference Koenig, Prichep, Lehmann, Sosa, Braeker and Kleinlogel45], suggesting a level of continuity between health and disease. These results further align with the excitatory/inhibitory imbalances and loss in oscillatory power that have been reported to occur in the same time frame of late adolescence and early adulthood, and which have been suggested to underlie psychotic risk [Reference Uhlhaas and Singer14]. Overall, our results tentatively suggest that the imbalance of class C over class D may be more specific to SCZ than the class D variations by themselves.
Several considerations need to be made. First, when comparing values of all parameters between diseases, no significant difference was found. This could indicate that while there may be a significant difference in certain class D values or C/D ratios of microstate parameters between controls and patients, this difference is not sufficient to discriminate between disease groups, and therefore lacks disease specificity. Furthermore, significant increases of class B in BIP (occurrence), FEP, SCZ, and ASD (occurrence and coverage) show that microstate B, which may relate to visual processing [Reference Michel and Koenig16], may also be relevant transnosographically. Although this observation is intriguing, it remains tentative since the topography of class B in our dataset may be less stable and at times, correlates with the topography of class D (in BIP and SCZ subjects). In addition to the limited size of the samples, the absence of difference between groups may be explained by the heterogeneity behind each disease category: some UHR will convert to psychosis, while others will not, and it has been shown that microstate D is decreased in converters compared to non-converters [Reference de Bock, Mackintosh, Maier, Borgwardt, Riecher-Rössler and Andreou22]. Similarly, subjects experiencing a first episode of psychosis will not all develop SCZ, and around 40% will recover (for more than 2 years) [Reference Lally, Ajnakina, Stubbs, Cullinane, Murphy and Gaughran46, Reference Morgan, Lappin, Heslin, Donoghue, Lomas and Reininghaus47], with important variability and very different long-term functional outcomes [Reference Ayesa-Arriola, Ortíz-García de la Foz, Martínez-García, Setién-Suero, Ramírez and Suárez-Pinilla48].
Second, our study was carried out in routine care and therefore presents the advantage of estimating the performance of microstate analysis in a heterogeneous population as seen in daily practice, with routine 19 electrodes EEG. The disadvantage is that 19 electrodes EEG are also less reliable and noisier than higher density ones for microstate analysis [Reference Zhang, Shi, Wang, Li, Liu and Liu49]. Transdiagnostic studies with high-resolution EEG are therefore required, with longer eye-closed recordings specifically dedicated to microstate analysis (e.g. 5 min), as they provide more robust results [Reference da Cruz, Favrod, Roinishvili, Chkonia, Brand and Mohr23]. Nevertheless, the spatial correlation that we observed for maps across groups suggests a level of stability even at this low resolution, provided the raw EEG data is clean. Yet, the retrospective nature of our study did not allow for more specific quantitative phenotyping that would have provided information on the relationship between microstates and clinical dimensions, or precise medication intake.
Third, a specificity of our study is to have chosen to construct the microstate prototypes from healthy subjects only. The microstate topographies thus characterized translate a normal variation and are independent of the disease groups to which they were applied. This allowed us to amplify a signal possibly associated with the disease, which would otherwise have been attenuated by strategies that construct these clusters by combining all groups.
Several methodological limits need also to be mentioned. Although the overall cohort is large, the sample size of each group is relatively small. For this reason, data analysis was done with Bayesian estimation, which has been shown to be more robust than t-tests for small sample sizes [Reference Kruschke42]. The optimal number of clusters was determined using a silhouette score that identified two and four clusters as possible solutions, but we chose the latter to maintain comparability both with the literature and across multiple groups. Moreover, there is not, to date, a consensus regarding the criterion for finding the optimal number of maps, and most of the clustering is driven by the underlying hypothesis: we chose a fixed number of clusters because we wanted to compare groups, assuming there is no qualitative difference between disorders; but an alternative strategy could have been to seek for maps specific to one disorder by allowing the optimal number of clusters to vary from one group to another [Reference Michel and Koenig16]. Finally, while age and sex were included as covariates in the ANOVA model for differences among disease groups, we could not correct for age in the pairwise comparisons against controls, because age and status were strongly associated (as all controls were significantly older than all disease groups). This is a limit of the retrospective design, and a prospective one will allow to include controls matched on age and sex.
In conclusion, we reported here the first transdiagnostic study of EEG microstates across the spectrum of early psychosis, autism, and mood disorders in routine clinical practice. Our results suggest that class D decreases may be markers of stage across psychosis, but they do not seem to be specific to it and may also reflect a shared dimension on the SCZ-autism spectrum. On the other hand, we also tentatively suggest that the C/D microstate ratio imbalance, which is postulated to reflect core contextualization deficits of psychosis, may be more specific to SCZ. At this stage, EEG microstates are not sufficient to differentiate between different groups of diseases.
Supplementary material
The supplementary material for this article can be found at https://doi.org/10.1192/j.eurpsy.2023.2414.
Acknowledgements
We thank all patients who participated in this study. We are obliged to the neurophysiology technicians for their assistance in EEG recordings.
Author contribution
A.I., B.C., and M.G. designed the study. A.I., A.M., E.P-R., E.G., V.M., Y.E., and A.D. participated in data collection. A.I., A.M., V.F., and M.G. participated in data analysis. All authors participated in the discussions and the writing of the paper.
Financial support
This work was supported by the GHU Starting Grant “DEMETER” (A.I.); Fondation Bettencourt-Schueller (B.C.); the French government’s “Investissements d’Avenir” programme, which is managed by the Agence Nationale de la Recherche (ANR) (M-O.K., “PsyCARE” ANR-18-RHUS-0014).
Competing interest
The authors declare none.


 Open access
Comments
No Comments have been published for this article.