


Introduction
Men who have sex with men (MSM) constitute a major fraction of the HIV population in China. By the end of 2017, 758610 HIV/AIDS patients had been reported in China, more than 28% of whom were MSM [Reference Wu1]. In Zhejiang Province, a southeastern coastal province of China, reported cases resulting from homosexual contact, which make up about 38%. A meta-analysis has shown that MSM are at a greater risk of being infected with HIV compared with general population [Reference Baral2]. Meanwhile, most MSM in China develop AIDS within 4–5 years after HIV infection [Reference Li3]. Therefore, scaling up HIV testing is important for controlling the HIV epidemic among MSM. The stigmatisation of same-sex behaviours in China presents challenges for the discovery of HIV infected individuals.
Chinese antiretroviral therapy (ART) program, as a national policy, has seen an increasing coverage [Reference Zhang4]. However, China has not reached the Joint United Nations Programme on HIV/AIDS (UNAIDS) 90-90-90 targets by 2020 [Reference Wu5]. A survey shows the treatment rate among the diagnosed HIV/AIDS MSM is only 56% in China [Reference Hu6]. The reason may be that MSM are relatively private in China [Reference Hsieh7]. HIV prevention among MSM largely depends on interventions that can reduce unprotected sexes and strengthen HIV testing [Reference Zou8]. Meanwhile, the high rate of MSM with HIV primary drug-resistance (PDR) also challenges the effectiveness of Chinese ART program [Reference Yang9].
In order to effectively predict and control the spread of AIDS, scholars at home and abroad have proposed a series of deterministic and stochastic models incorporating mathematics, clinical medicine and epidemiology [Reference Lou10–Reference Shen13]. Blower et al. [Reference Blower and Volberding14, Reference Smith15] studied the impact of expanding ART coverage in the presence of transmitted and acquired drug resistance.
Using variables about ART and PDR, we developed a compartmental model to evaluate the HIV/AIDS epidemic among MSM and the effect of related controlling efforts.
Materials and methods
Database used in the study
We obtained the annually reported drug-sensitive HIV cases and drug-resistant HIV cases on annually reported HIV/AIDS MSM between 2007 and 2019 in Zhejiang Province from Chinese Centre for Disease Control and Prevention (China CDC).
Mathematical model
A compartmental model was established with variables about antiretroviral therapy (ART) and transmitted HIV-1 drug resistance (TDR) among the MSM population of Zhejiang Province. We divided the population into nine categories (Fig. 1): susceptible individuals (S), undiagnosed individuals infected with drug-sensitive or drug-resistant strains (P S and P R), diagnosed individuals infected with drug-sensitive or drug-resistant strains but have not progressed to AIDS stage ( $I_S^U $ and $I_R^U $), treated individuals infected with drug-sensitive or drug-resistant strains and have not progressed to AIDS stage ( $I_S^T $ and $I_R^T $) and those diagnosed with AIDS stage ( $A_S^T $ and $A_R^T $). The variable's subscript described whether the infection was drug-sensitive (S) or drug-resistant (R); the superscript described whether the individuals were treated with ART (T) or untreated (U). The high-risk population size was represented by N: $N = S + P_S + I_S^U + I_S^T + A_S^T + P_R + I_R^U + I_R^T + A_R^T $. The parameters definition and formula are shown in Supplementary Material A.

Fig. 1. Schematic flow diagram of model.
Threshold dynamics
The basic reproduction numberR 0represented the average number of secondary cases generated by one primary case in a fully susceptible population during its average infectious period (the average time between the initiation and the elimination of infection) [Reference Dreessche and Watmough16]. R 0is a threshold parameter for the infectious disease and can help determine whether an infectious disease can spread out of a population. R 0 > 1 indicates that the disease will continue to prevail and R 0 < 1 indicates the disease will be eliminated. In the present model, R 0represented the number of cases infected by a HIV-positive individual per year. We can get R 0 following the next-generation matrix (Supplementary Material B).
Parameter values estimated
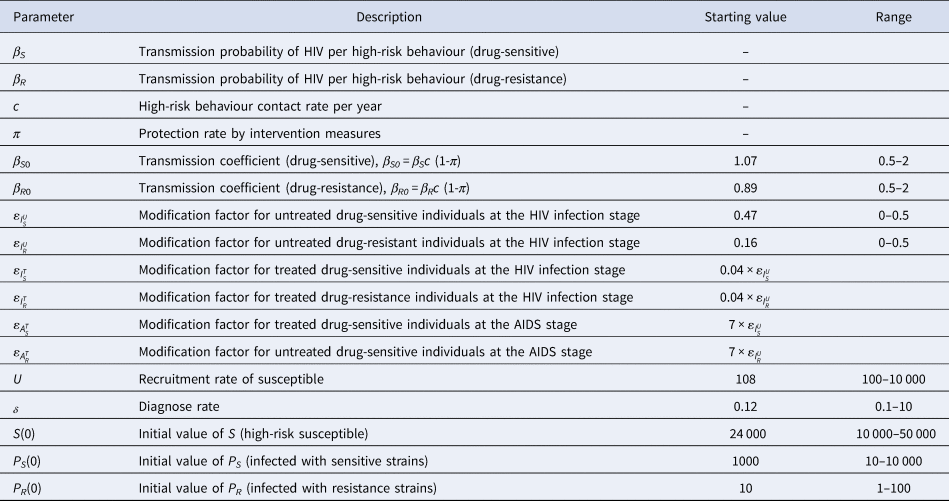
We set 2007 as the starting year for the dynamical model, i.e., t = 0. According to the 2013 Statistical Yearbook of China [17], the life expectancy of men in Zhejiang Province (L) in 2007 was 75.58 years and the natural death rate (d = 1/L) was 0.0132 per year. We assumed the duration in which males can have sex (L S) was 49 years (age 15–64 years) and the exit rate (the rate at which the susceptible cases are excluded) of the susceptible (μ = 1/L S) was 0.0204 per year. We set the duration of the chronic stage without treatment (T C) as 4.5 years, then the rate of progression from HIV infection stage to AIDS stage (untreated, drug-sensitive) (ζ S = 1/T C) as 0.2222 per year and the rate of progression from HIV infection to AIDS stage (untreated drug-resistant)(ζ R = 1/(1.25 × T C)) as 0.1778 per year [Reference Shen13]. The duration of AIDS stage was 1.2 years [Reference Jaffar18] and the disease-related death rate at AIDS stage (α A = 1/T A) was 0.8333 per year. The rate of progression from HIV infection stage to AIDS stage (treated, drug-sensitive) (η S) was 0.020 per year and rate of progression from the HIV infection stage to AIDS stage (treated, drug-resistance) (η R) was 0.026 per year [Reference Sun12]. The disease-related death rate for HIV-positive individuals undiagnosed (α 0) and at HIV infection stage untreated (α I) was both chosen 0.28 per year [Reference Sun12]. The disease-related death rate at HIV infection stage (treated, drug-sensitive) (α S) was 0.05 per year [Reference Sun12] and 1.75 × 0.05 per year for treated drug-resistant individuals (α R). In the database, the proportion of diagnosed individuals at HIV infection stage (ρ) was set as 0.7400 and the treatment rate (τ) as 1.6949 per year. We assumed the withdrawal rate as 0.1 per year. Reference was the results of a 6-year cohort study on HIV-1 resistance in AIDS patients receiving antiviral treatment in Henan Province [Reference Li19]. Among half of the individuals in the cohort, the time point that resistance emerged was 25.1 months (95% CI 19.0–33.3) in those whose VL was <4.0 lgU/ml and 4.8 months (95% CI 4.1–5.6) in those whose VL was >4.0 lgU/ml during the first investigation. We chose1/25.1 × 12per year as the rate of acquired drug resistance after treatment began at HIV infection stage (υI) and 1/4.8 × 12 per year as the rate at AIDS stage (υA). Table 1 shows the settings for parameters and initial values.
Table 1. Setting values for parameters and initial values

Data fitting and verification
We utilised the Markov-Chain Monte Carlo (MCMC) method to estimate the main parameters of the formula (1). Starting value and range setting for unknown parameters is shown in Table 2. Metropolis-Hastings (M-H) algorithm was employed for MCMC simulation [Reference Tang and Xiao20]. The algorithm ran 250 000 iterations with a burn-in of 50 000 iterations. We obtained our estimates using the rest 200 000 samples. Using the simulation results of these parameters, we got the Markov Chain of basic reproduction number R 0 and its variations. Mean Absolute Percentage Error (MAPE) and Root Mean Square Percentage Error (RMSPE) were used to evaluate the effectiveness of the model [Reference DeLurgio21]. The formula is as follows:
 $$MAPE = \displaystyle{1 \over n}\sum\limits_{t = 1}^n {\left\vert {\displaystyle{{actual\lpar t\rpar -forecast\lpar t\rpar } \over {actual\lpar t\rpar }}} \right\vert } \times 100\percnt $$
 $$RMSPE = \sqrt {\displaystyle{{{\sum\limits_{t = 1}^n {\lsqb {\lpar actual\lpar t\rpar -forecast\lpar t\rpar \rpar /actual\lpar t\rpar } \rsqb } }^2} \over {n-1}}} \times 100\percnt $$
Table 2. Starting value and range setting for unknown parameters
Generally, if MAPE and RMSPE are less than 10%, the simulation of the model is accurate. If 10% to 20%, the simulation is good. If 20% to 50%, the simulation is reasonable. If more than 50%, the simulation is inaccurate.
Sensitivity analysis
We used Latin Hypercube Sampling (LHS) and Partial Rank Correlation Coefficient (PRCC) [Reference Marino22] to examine the dependence of the reproduction number  $R_0^S $ and $R_0^R $ to parameter variations. We respectively choose the sample size (n = 6000), parameters of interest as the input variables and $R_0^S $ and $R_0^R $ values as the output variable.
Software
Maple Software 2018 was used to compute the basic reproduction number. Berkeley Madonna Version 9.1.19 (Berkeley Madonna Inc., University of California, Berkeley, CA, USA) was used to fit and explore the appropriate range of parameters. All other analyses, data visualisations and modelling were programmed in R Software Version 3.6.3 (The R Foundation for Statistical Computing).
Results
HIV transmission dynamics
The number of annual confirmed cases of HIV-sensitive and HIV-resistant strains reported in 2007–2019 is shown in Figure 2a. We fitted the model to the data of annually reported drug-sensitive HIV cases and drug-resistant HIV cases in 2007–2017 to estimate the unknown parameters (Fig. 2b). MAPE and RSMPE were used to evaluate the fitting and predictive effectiveness of the model.  $I_S^U $ fitting MAPE is 2.5% and RMSPE is 4.4%. $I_R^U $fitting MAPE is 8.6% and RMSPE is 11.6%. We used 2018 and 2019 data to evaluate the model prediction effect. $I_S^U $ predictive MAPE is 1.2% and RMSPE is 2.1%. $I_R^U $ predictive MAPE is 20.5% and RMSPE is 29.2%. The results show that the model has excellent fitting and prediction effect on infected HIV-sensitive strains, the MAPE and RMSPE were less than 5% and the fitting effect on HIV resistant strains was excellent and the prediction effect deviation was a little large but still within 30%.

Fig. 2. A:Number of confirmed cases HIV sensitive and HIV resistant strains reported 2007-2019; B: Data fitting diagram; C, D: Predictive trends (The shaded area is the predicted area).
Further, we use the data reported in 2007–2019 for final fitting to obtain unknown parameter values. Estimated parameters and initial conditions are given in Table 3. The estimated recruitment rate of the susceptible was 1207 (95% CI (767–1654)), meaning that about 1207 individuals entered the high-risk AIDS group per year. The estimated drug-sensitive transmission coefficient ( $\beta _{S0}^{} $) was 1.2140 (95%CI (1.1443–1.2700)) and the drug-resistant transmission coefficient ( $\beta _{R0}^{} $) was 1.0851 (95%CI (0.7089–1.4856)). The estimated modification factor for untreated drug-sensitive individuals at HIV infection stage $\varepsilon _{I_S^U }$ was 0.3750 (95% CI (0.3136–0.4402)) and that for untreated drug-resistant individuals at HIV infection stage $\varepsilon _{I_R^U }$was 0.0428 (95% CI (0.0084–0.0912)). The estimated diagnostic rate δ was 0.8786 (95% CI (0.6588–1.1268)). The estimated initial value of high-risk susceptible S was 36 414 (95% CI (31101–41985)). The estimated initial value of individuals infected with drug-sensitive strains P S was 271 (95% CI (200–359)). The estimated initial value of individuals infected with drug-resistant strains P R was 2 (95% CI (1–5)). The predictive curve is shown in Figures 2c and 2d. On the premise that the current prevention and control measures remain unchanged, the cumulative confirmed cases of HIV-sensitive and HIV-resistant strains in Zhejiang province by 2030 were 20 039 (95% CI 18382–21584) and 2114 (95% CI 1889–2298), respectively (Fig. 2c). The cumulative number HIV confirmed infections will reach 21 153 (95% CI 20271–23882) (Fig. 2d).
Table 3. Fitting results of unknown parameters and initial values

Using the 200 000 simulation samples of these parameters, we got the Markov Chain of basic reproduction number  $R_0^S $and $R_0^R $. Figure 3 describes the Markov Chain for $R_0^S $ and $R_0^R $ with good convergences. We can use these 200 000 samples to get the point and interval estimates of $R_0^S $ and $R_0^R $. Based on the estimated parameters, we calculated the value of R 0 as $R_ 0^S $: 2.3946 (95% CI (2.2961–2.4881)) and $R_ 0^R $: 1.1739 (95% CI (1.1339–1.2281)).

Fig. 3. The partial rank correlation coefficient (PRCC) between the basic reproduction number and model parameters.
Effect of interventions on HIV transmission
Figure 4 shows the PRCC variable of each parameter. β S0 and  $\varepsilon _{I_S^U }$ had positive impact upon $R_0^S $, whilst δ, τ, υI, υA and ρ had negative impact upon $R_0^S $. The most influential parameters were β S0, β R0 and δ.β R0 and $\varepsilon _{I_R^U }$ had positive impact upon $R_0^R $, whilst δ, υA and ρhad negative impact upon $R_0^S $. The most influential parameters were β S0, β R0 and δ. We concluded that reducing the contact rate c, strengthening the protected power πand increasing the diagnostic rate δ were the most effective intervening measures to control the HIV/AIDS epidemic among MSM.
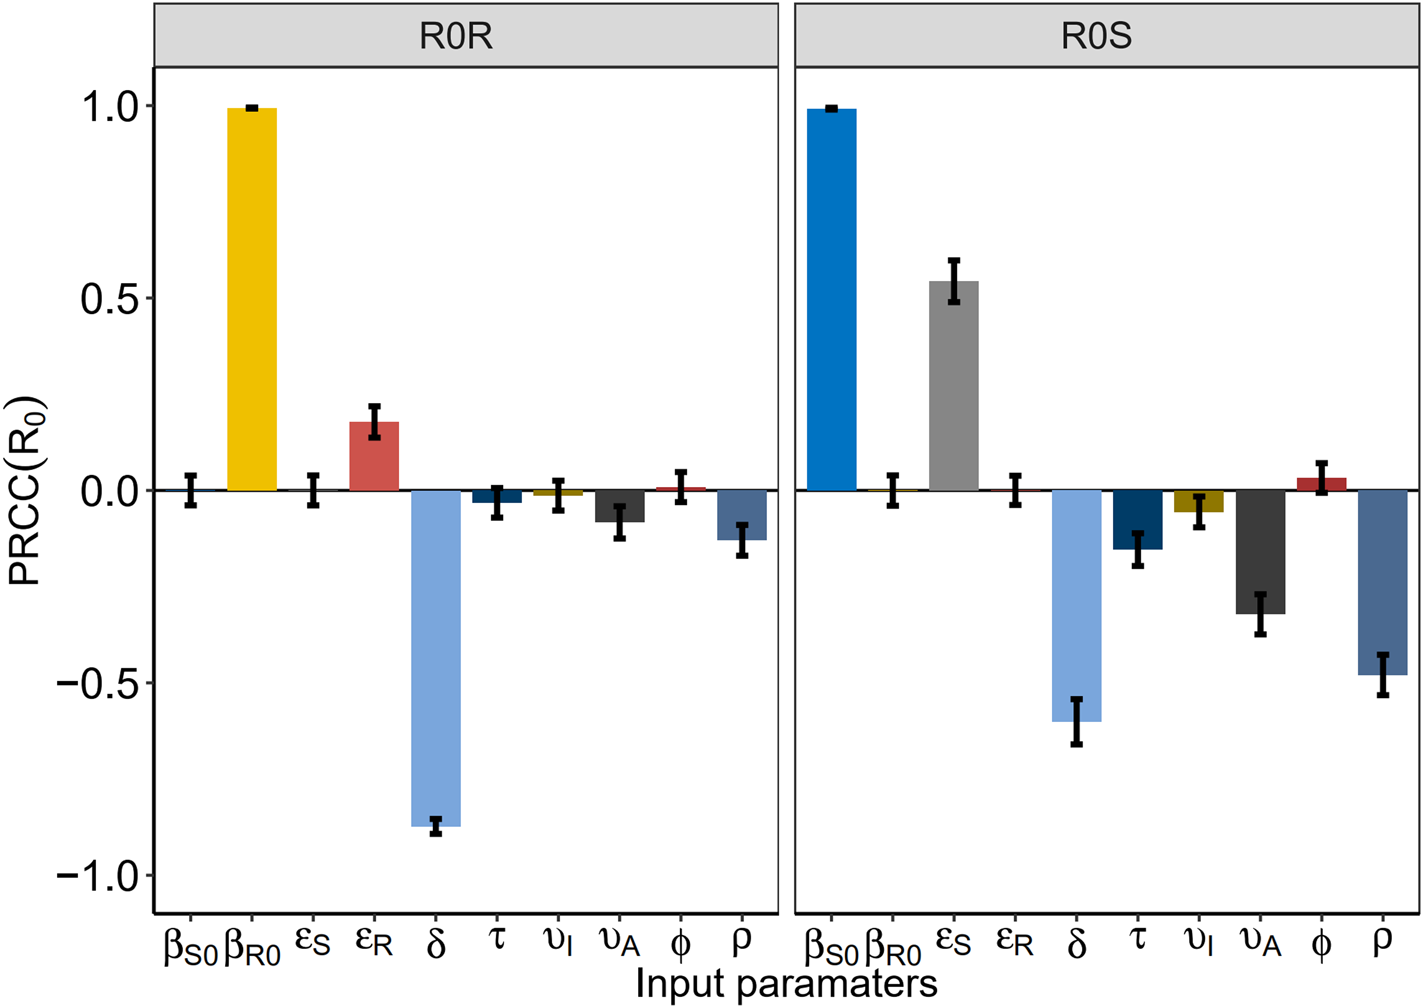
Fig. 4. Plots of estimated number of drug-resistant HIV/AIDS and the PDR rate after interventions.
To address the influence of each intervention on HIV infection, we investigated the number of HIV/AIDS infected, treated HIV/AIDS, drug-resistant HIV/AIDS, PDR rate, rate of the undiagnosed and the untreated. β S0 and β R0 were reduced by behavioural and biologic interventions, like decreasing the contact rate c or strengthening the protected power π(such as condom use) and increasing the diagnosed rate δ.
Reducing the contact rate cand increasing condom use were two major efforts to control the total HIV/AIDS (Fig. 5a). Both can be realised by strengthening the education for a high-risk population. In particular, when the contact rate cdecreased by 50%, the total number of HIV/AIDS infected individuals among MSM also decreased by 20 000, at a rate six times of the increasing diagnostic rate (Fig. 5b). Smaller β S0 and β R0 reduced the total HIV/AIDS and the total treated HIV/AIDS (Fig. 5c). Increasing the diagnostic rate increased the number of people treated in the near future, but this number could be reduced in the long run (Fig. 5d).
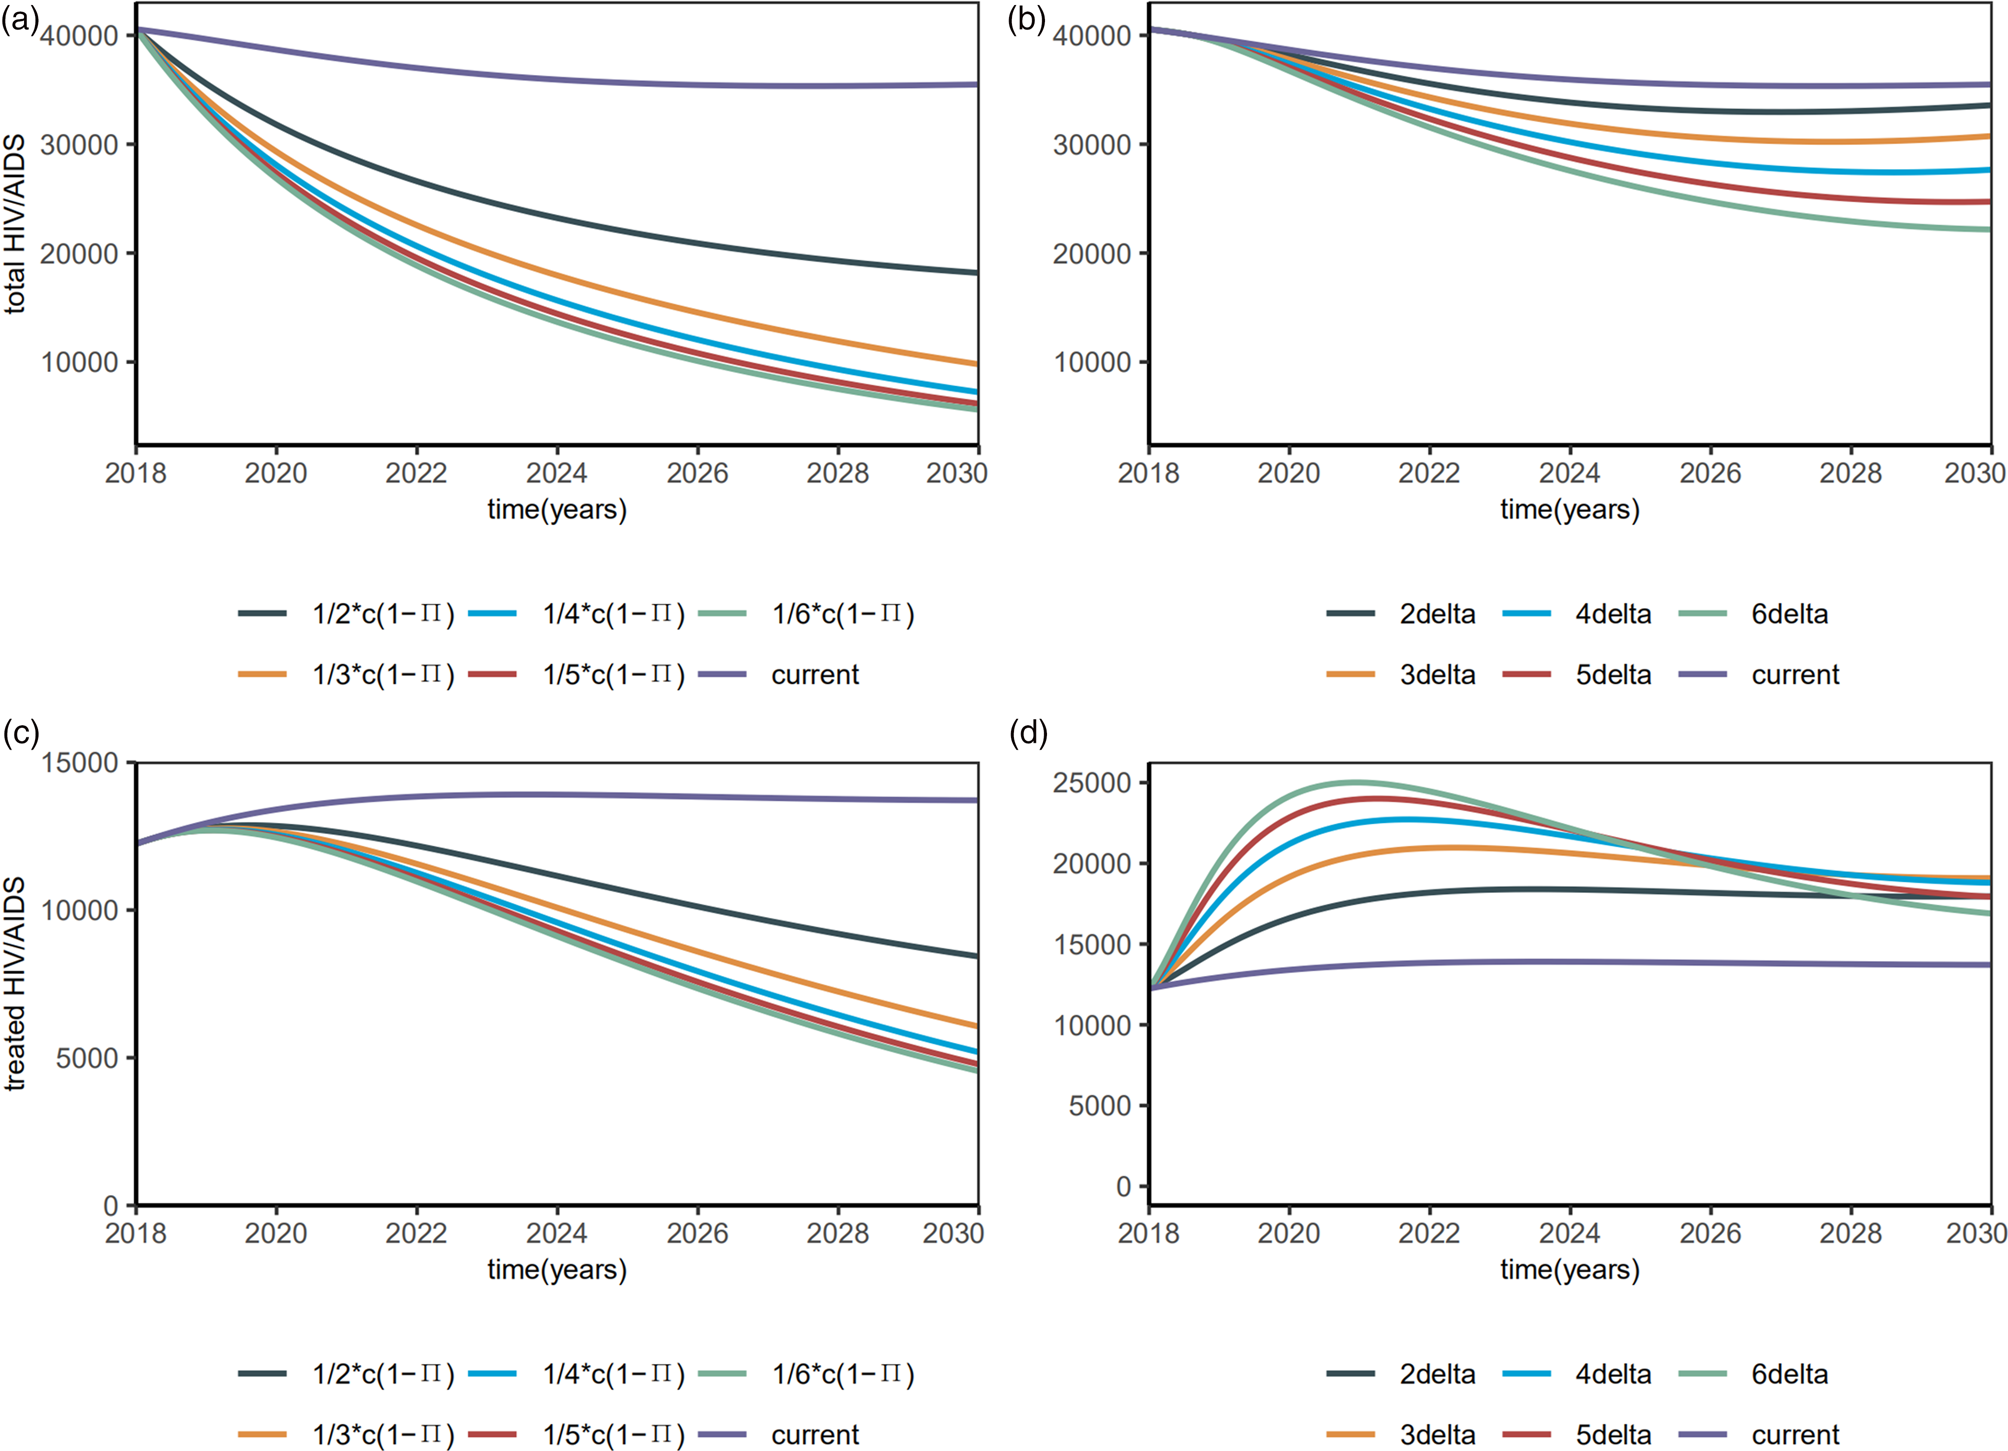
Fig. 5. Plots of estimated number of the total HIV/AIDS (including undiagnosed HIV/AIDS) and the total HIV/AIDS treated with interventions.
Figure 6 shows the estimated PDR rate and the number of total drug-resistant HIV/AIDS that change with interventions. Total number of drug-resistant HIV/AIDS dropped quickly with β S0 and β R0 (Fig. 6c), but PDR rate still increased (Fig. 6a). With the increasing diagnostic rate, the PDR rate tended to increase (Fig. 6b) while the number of drug-resistant HIV/AIDS increased slightly and then decreased (Fig. 6d).

Fig. 6. Plots of estimated number of drug-resistant HIV/AIDS and the PDR rate after interventions.
Then, we investigated the proportions of the diagnosed and treated. When the diagnostic rate δ increased by 6 times, the diagnosed proportion will be reduced to about 90% and remain stable (Fig. 7a), with a R 0 of 1.4354 (95% CI 1.0626–1.6281). When β S0 and β R0 decreased by 6 times, the diagnosed proportion was reduced to about 90% and remained stable (Fig. 7b), with a R 0 of 1.9133 (95% CI 1.5354–2.1159). Till 2020, the treated proportion will have increased to about 90% and slightly abate by interventions (Figs 7c and 7d), which means 90% of the diagnosed HIV/AIDS individuals will have received treatment.
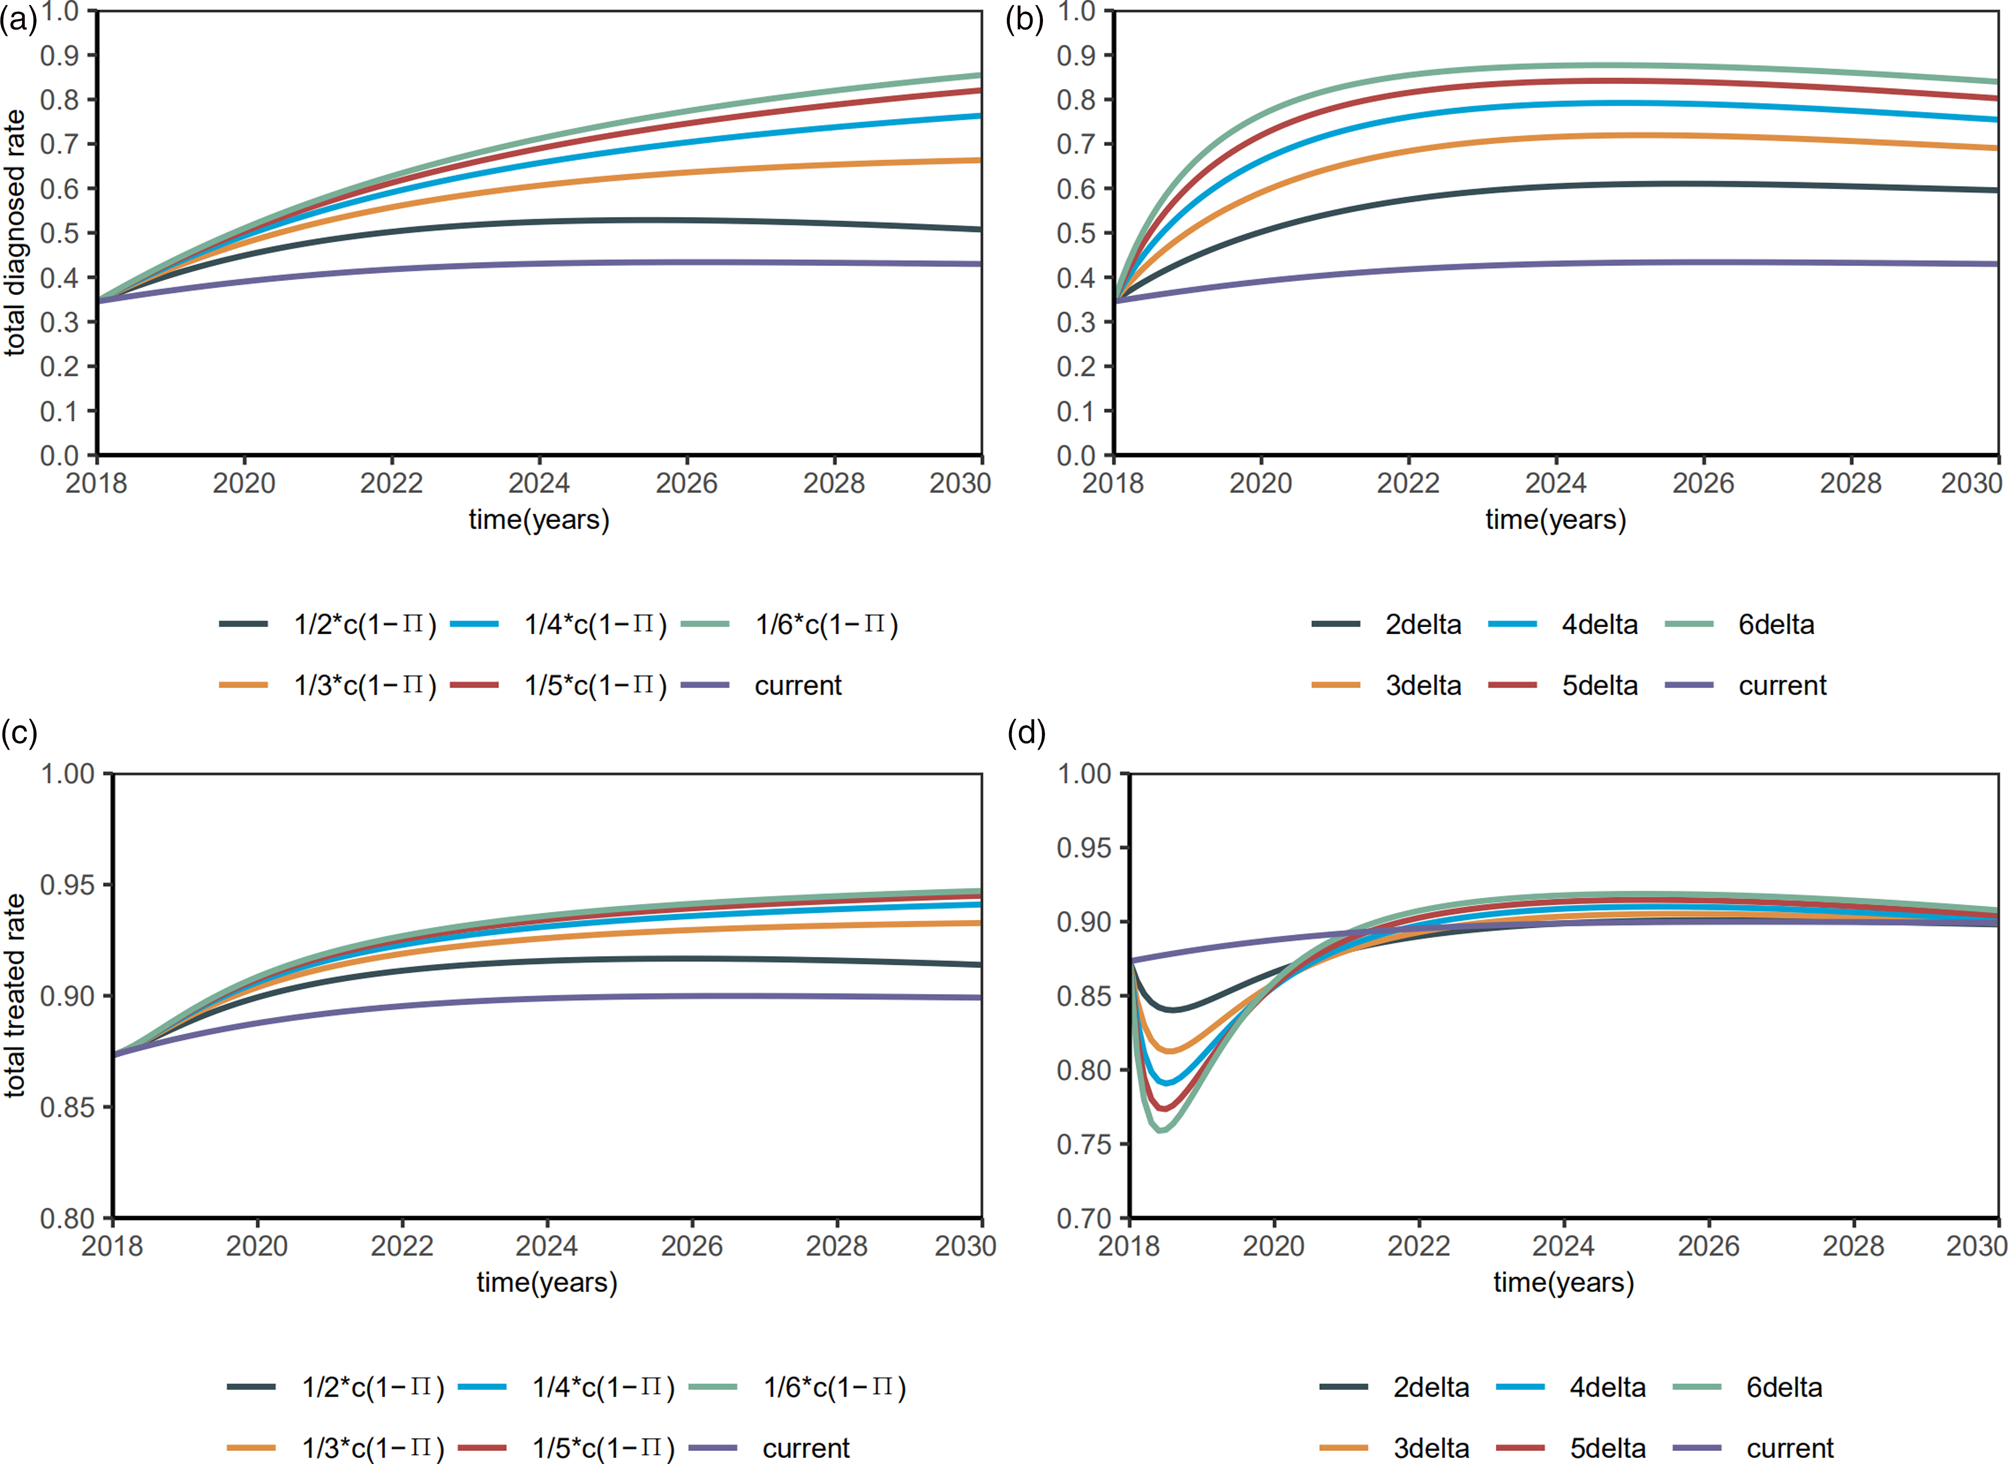
Fig. 7. Plots of estimated proportions of the diagnosed and the treated after interventions.
Discussion
In this study, according to the dynamics theory of SIR infectious diseases, we analysed the effect of ART on HI V/AIDS infection in the MSM population in Zhejiang Province with an improved compartmental model. The estimated reproduction number we have calculated is 2.4507 (95% CI 2.3564–2.5441) in Zhejiang MSM population, smaller than the estimated 3.88 (95% CI 3.69–4.07) in national MSM population in 2013 [Reference Sun12]. This suggests that the interventions in recent years have exerted a positive effect on AIDS control.
Reducing the high-risk behaviours, mainly through education, is the top choice to control the total number of HIV/AIDS patients. The estimated drug-sensitive transmission coefficient β S0(1.2140 (95% CI 1.1443–1.2700)) was larger than the estimated drug-resistant transmission coefficient β R0(1.0851 (95% CI 0.7089–1.4856)). The reason may be that individuals can be infected with drug-resistant strains from the patients receiving treatment, which brings a smaller transmission probability of HIV per high-risk behaviour (β), lower high-risk behaviour contact rate per year (c), or larger protection rate by intervention measures (π). This also shows that ART can reduce the spread of HIV in the MSM population. Shen et al. [Reference Shen13] suggested that early treatment might increase the incidence of drug resistance. Under the current conditions, the PDR rate will reach 31% till 2030. This also reflects the need for additional second-line drugs.
Our estimated diagnostic rate was only 0.8786 (95% CI 0.6588–1.1268), that is, the average time from infection to diagnosis is 1.14 years (95% CI 0.89–1.52), which is consistent with the low rate of prior HIV testing among MSM [Reference Li23]. Increasing HIV tests is the first step toward the 90-90-90 targets for NDAIDS and China still faces many challenges in achieving this goal. Early detection enables timely antiretroviral treatment to reduce HIV viral load, thus reducing the spread of HIV. We propose that increasing the diagnostic rate may increase the total number of treated HIV/AIDS in a short time, but reduce this number in the long run. The World Health Organization recommends HIV self-testing, as a supportive approach [24], can increase the efficiency of HIV testing [Reference Tang25]. When β S0 and β R0 were decreased by 6 times, the diagnosed proportion was reduced to about 90% and remained stable, with a R 0of 1.9133 (95% CI 1.5354–2.1159). Consistent with previous study [Reference Punyacharoensin26, Reference Li27], R 0 is still larger than the level of epidemic elimination even if the 90-90-90 strategy is completed, which means the strategy alone may not be sufficient to eliminate HIV transmission among MSM in China.
The present study also demonstrated the effectiveness of these interventions for controlling HIV/AIDS epidemic. In particular, when the contact rate cdecreased by 50%, the total number of c HIV/AIDS infected individuals among MSM also decreased by 20 000, at a rate six times of the increasing diagnostic rate. This also underscores that behavioural and biologic interventions are critical to control the spread of HIV among Chinese MSM [Reference Liu28].
Our model also shows deficiencies. First, the drug resistance data may be biased because not all treated patients are tested at an early stage. Second, heterosexual transmission among MSM was not discussed in our model, since some of them may also marry a woman. Finally, some parameters were set based on assumptions and may not reflect the actual situation.
In summary, our findings suggest that behavioural and biologic interventions, in addition to HIV testing, are needed for HIV prevention among MSM. ART can effectively control the spread of HIV, even in the presence of drug resistance. The 90-90-90 strategy alone may not be enough to eliminate the HIV/AIDS epidemic in Chinese MSM.
Supplementary material
The supplementary material for this article can be found at https://doi.org/10.1017/S0950268820000850
Acknowledgements
The authors thank the China CDC for providing the data. This work was supported in part by the Natural Science Foundation of China (81673275, U1503123), the National S&T Major Project Foundation of China (2017ZX10201101, 2018ZX10715002).
Conflict of interest
None.


 Open access