


INTRODUCTION
In common with other northern hemisphere countries, circulation of influenza is seasonal in the UK, with peak activity typically seen between November and March each year. As seasonal influenza epidemics result in substantial mortality and morbidity in the population and cause sickness absence from work and schools, rapid detection of the onset of influenza and monitoring of the intensity of activity each season are key objectives of influenza surveillance to ensure timely mobilization of health service resources and allocation of appropriate control and prevention interventions, in particular triggering use of antivirals in the community.
Several surveillance schemes are in place for indicating the start and assessing the intensity of influenza activity (defined for the rest of this paper as the magnitude of monitored rates) in the population. These include General Practitioner (GP) and other syndromic surveillance schemes (monitoring in near real-time data on patients presenting to healthcare services with signs and symptoms suggestive, or characteristic of influenza [1]), laboratory reporting, hospitalizations and mortality surveillance [2]. Within the UK, there are several sentinel GP surveillance schemes monitoring influenza-like illness (ILI) consultation rates in primary care. Each geographically distinct scheme has a distinct pre-assigned threshold which, when breached, denotes the start of significant influenza circulation in the community. An important clinical consequence of the threshold is its use, along with other influenza surveillance indicators, to inform the decision to trigger the prescription of antiviral use in the community based on National Institute for Health and Clinical Excellence (NICE) guidelines [3, 4]. For each scheme, threshold assignment has historically been based on both statistical assessment and epidemiological judgement. Threshold values are occasionally reviewed in response to observed changes in the surveillance scheme, the data received and other factors such as changes in trends in healthcare-seeking behaviour [Reference Fleming5, Reference Goddard, Kyncl and Watson6]. Despite these revisions, the current thresholds used in the various UK schemes appear to be inconsistent with the lower rates of activity reported in recent seasons. This inconsistency can result in the threshold failing to provide an early warning of the start of influenza activity and consequently reducing its relevance to public health professionals.
While factors such as ILI definition adherence and consistency in recording can differ between sentinel practices within a scheme, there are more general differences between UK GP ILI consultation schemes for other factors, as illustrated in Table 1, as well as variation in healthcare-seeking behaviour. These differences prevent direct comparison of reported rates and also prevent collation of data across the schemes to produce a representative figure of influenza activity for the UK as a whole. Prior to the 2009 influenza pandemic, there had been an on-going initiative to harmonize ILI GP consultation surveillance schemes across the four countries of the UK (England, Wales, Scotland, Northern Ireland), including adopting common age groups and case definitions, as well as a convergence of data collection methods, with schemes extracting data directly from GP clinical systems. Following the 2009 pandemic and subsequent recommendations [Reference Hine7, 8], it was proposed by a UK working group [9] to standardize primary-care data through calculation of empirical percentiles of historical ILI rates for each scheme to statistically categorize and assess the intensity of the current influenza season [Reference Fleming and Slottje10].
Table 1. Differences between schemes preventing direct comparison of GP ILI consultation rates, UK
GP, General Practitioner, ILI, influenza-like illness.
a Seasons with prior available data compatible for the purpose of this study.
b Illness definition that qualifies as a reported ILI episode.
c How the codes are extracted from the GP reporting schemes and frequency of extraction.
d The proportion of the population represented by the scheme.
e What type of consultation is included in the reported rate by patient (primary or repeat).
f There was a change in the reporting scheme in Wales in 2010/11 and so data prior to this had to be scaled to be compatible.
g There was a change in the reporting scheme in Scotland in 2011/12 and so data prior to this had to be scaled to be compatible.
h Morbidity, prescribing and clinical Information recorded by GPs in electronic medical records is stored as Read codes, which can be mapped to the International Classification of Diseases (ICD) and to the British National Formulary classification of drugs for analysis.
Currently, the start of activity and intensity reached is reported weekly to the European Centre for Disease Prevention and Control (ECDC) and the World Health Organization (WHO) based on subjective interpretation by each member state [11]. To address the inevitable reporting inconsistencies, ECDC announced prior to the 2011/2012 influenza season a pilot utilizing the moving epidemic method (MEM), a standardized approach for ILI reporting developed in Spain [Reference Vega12–Reference Vega14]. Through MEM, an epidemic threshold for ILI rates is calculated to denote, once crossed, the start of significant influenza activity, with subsequent thresholds denoting categories of intensity of activity.
As ECDC's proposal coincided with the harmonization work being carried out in the UK, it was decided that both the MEM and percentile approaches would be internally piloted across the UK using the GP sentinel surveillance schemes and the English Respiratory Datamart laboratory reporting system (RDMS) [Reference Zhao15] during the 2011/12 influenza season and, since low levels of influenza activity were seen in that season, again during the winter of 2012/13. This report presents the findings of that pilot, of which the key aims were to:
-
• Evaluate how the MEM and percentile approaches performed during the 2011/12 and 2012/13 influenza seasons detecting the onset of the influenza season in each of the countries of the UK.
-
• Determine whether the MEM and percentile approaches were able to standardize the reporting of ILI activity between schemes within the UK and allow a comparative assessment of intensity of activity.
METHODS
Data
Weekly ILI GP consultation rates per 100 000 population were collated from the following sentinel GP surveillance schemes: the Royal College of General Practitioners (RCGP, coverage in England and Wales), Health Protection Scotland, Public Health Wales and Public Health Agency Northern Ireland. A key prerequisite of calculations through both the MEM and percentile approaches is the availability of sufficient comparable historical data to estimate typical influenza activity. The maximum available data up to 10 years prior to the 2011/12 influenza season was used (2000/01–2008/09 and 2010/11), and updated to 10 years prior to the 2012/13 influenza season the following year (2001/02–2008/09 and 2010/11–2011/12), excluding 2009/10 when the A(H1N1) pandemic occurred. Public Health Wales changed its scheme in 2010/11 from a manual paper-based reporting system using a clinical case definition to an automated system and Scotland's reporting system was altered in 2011/12 as a result of changes in computer software in general practice [16]. Therefore historical data was not directly comparable for these schemes. To adjust the Welsh data, a simple linear regression was used to calibrate historic observations to be compatible with the new reporting scheme. Previous seasons were scaled using the relationship between the old and new schemes estimated from available data from the 2010/11 and 2011/12 seasons when both schemes were operational. A similar process was done for Scottish data to allow participation during the 2012/13 season. Week number each season was calculated using the International Standards Organization (ISO) definition [17]. When there was a week 53, weeks were matched by date, with week 53 recoded as week 1, week 1 recoded as week 2 and so forth up to week 19 recoded as week 20.
MEM approach
The MEM approach uses historical data to calculate the typical timing and duration of an influenza epidemic by determining the minimum number of weeks with the maximum cumulative rate [Reference Vega12]. By matching weeks of each season according to their relative location in the modelled epidemic period, the typical epidemic period curve was calculated. The remaining weekly rates before and after this period in each season were then categorized as pre- and post-epidemic, respectively (see Fig. 1 a for a diagrammatic representation). The pre-epidemic threshold was calculated by taking the upper limit of the 95% confidence interval (CI) of the geometric mean of the pre-epidemic rates. Intensity of activity once the pre-epidemic threshold was breached was classified as ‘low’, ‘medium’, ‘high’ and ‘very high’ according to MEM designated cut-off points. The calculations were run in R 2·12·1 (R Development Core Team, Austria) using the publicly available MEM package [Reference Lozano Alonso18].
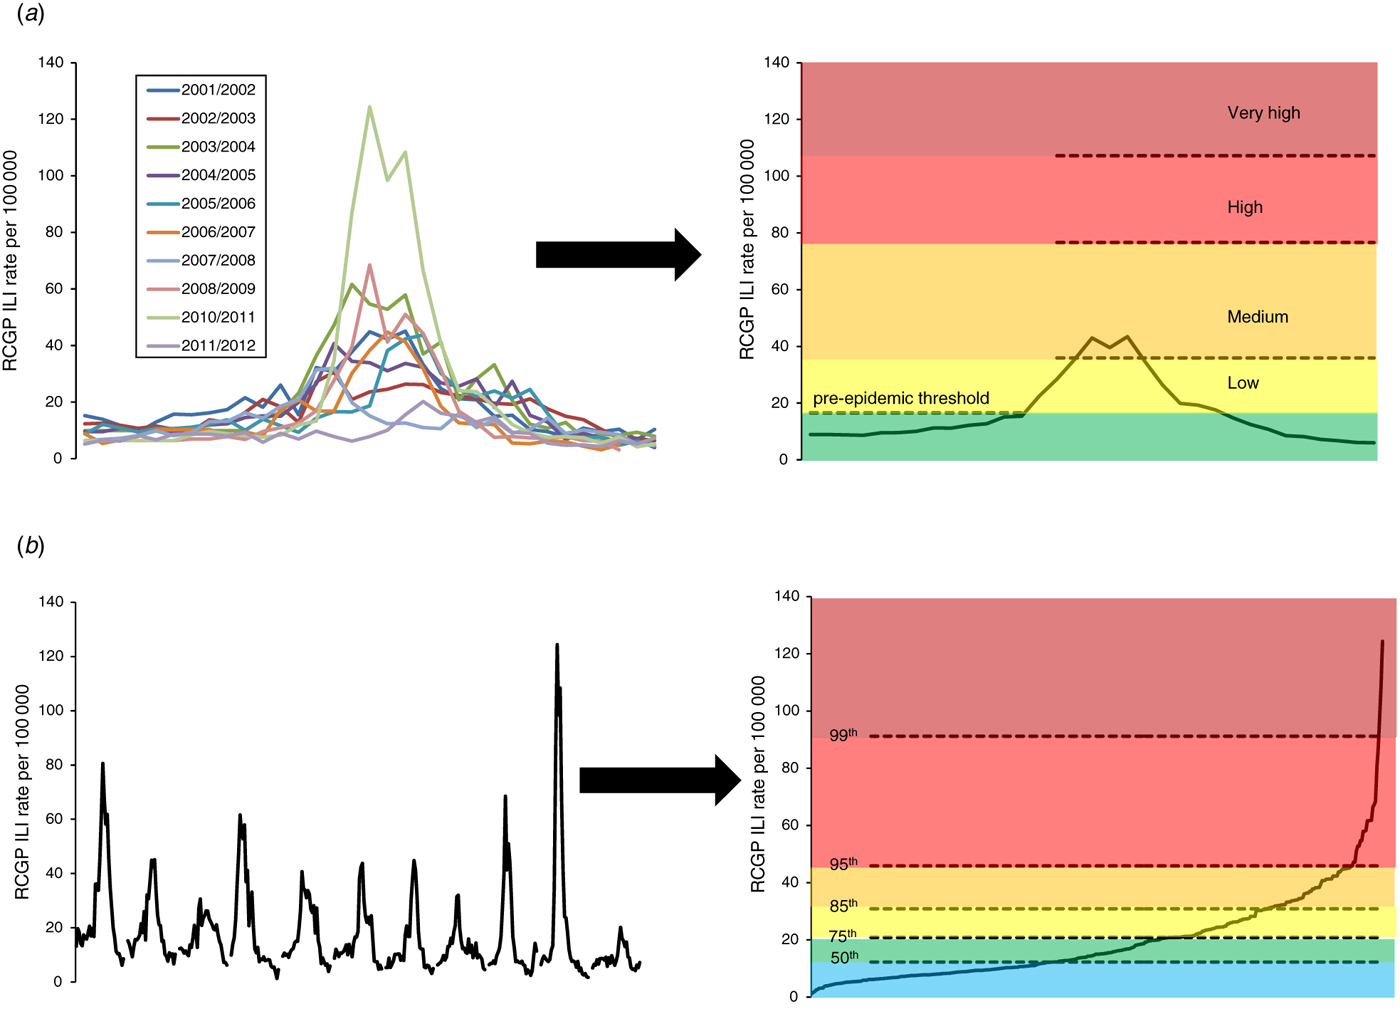
Fig. 1. Illustration of (a) the moving epidemic method approach and (b) the percentile approach. RCGP, Royal College of General Practitioners; ILI, influenza-like illness.
Percentile approach
Empirical percentiles of the overall distribution of weekly ILI rates of past seasons for each scheme were calculated using the established Mood et al. method [Reference Mood, Graybill and Boes19]. The general principle utilized is that over a sufficiently long time period, the overall impact of influenza will be broadly similar in each country [9, Reference Fleming and Slottje10], with calculation of specific values dependent on the pattern and relative magnitude of previous influenza epidemics. Arbitrarily, the 50th, 75th, 85th, 95th and 99th percentiles were used as cut-off points to categorize ordered weekly ILI rates (see Fig. 1 b for a diagrammatic representation) and compared to MEM cut-off points. The calculations were run in Stata v. 12 (StataCorp, USA).
Assessment
For 2011/12 and 2012/13, percentile and MEM categories were calculated and cut-off points compared to weekly ILI consultation rates from week 40 (beginning of October) to week 20 (mid-May).
ILI consultations can result from respiratory pathogens other than influenza. To confirm ILI rates likely resulted from influenza in England, the proportion of samples positive for influenza each week in 2012/13 through the RDMS [Reference Zhao15] was run through the MEM and percentile approaches to see if there was a consistent pattern. As RDMS was established in 2009/10 following on from the 2009 influenza A(H1N1) pandemic, only 3 years of historic data were available (2009/10, 2010/11, 2011/12). Other routine surveillance data sources, including sentinel swabbing from the GP practices and influenza-confirmed hospitalizations [20, 21] were compared to ILI consultation rates. Spearman rank correlation coefficients were calculated between ILI consultation rates and other data sources to determine concordance.
RESULTS
Influenza activity
Overall seasonal influenza activity was very low in 2011/12 across the UK, with clinical indices (reporting on patients consulting a healthcare professional at any level of care) peaking in February/March 2012 and influenza A(H3N2) the dominant subtype detected (with a small proportion of influenza B co-circulating). Despite low ILI consultation rates reported [20], influenza was observed to be circulating in the community, as shown by the large number of reported acute respiratory outbreaks associated with influenza [20]. During the following year, 2012/13, a prolonged influenza season was observed. Peak clinical indices were low across the UK, although activity peaked at higher levels than seen in 2011/12. Nationally in England, Northern Ireland and Wales, influenza B circulated first followed by influenza A(H3N2); however, in Scotland influenza A(H3N2) circulated and peaked prior to influenza B [22].
Figure 2 shows the weekly time series of key influenza surveillance indicators. For both seasons, additional surveillance indicators such as swab positivity through RDMS and laboratory-confirmed influenza hospitalizations showed influenza activity increased and peaked at a similar time to that seen through primary-care ILI consultations. Spearman rank correlation coefficients between the data sources showed reasonable agreement with ILI (a coefficient with influenza positivity of 0·665 (95% CI 0·493–0·781) and 0·836 (95% CI 0·741–0·892) with influenza-confirmed hospitalizations). Figure 3 a shows weekly values for each scheme and is colour-coded according to how the value compares with MEM intensity classification (Table 2). For example, ‘low’ activity corresponds to a value higher than the pre-epidemic threshold and lower than the medium threshold. Figure 3 b shows the same values colour-coded according to how they compare to percentile cut-off points. Peak influenza positivity through RDMS coincided with peaks in ILI consultation rates.

Fig. 2. Weekly Royal College of General Practitioners (RCGP) influenza-like illness (ILI) GP consultation rates per 100 000 population compared to confirmed influenza A and B hospitalizations* and proportion of samples positive for influenza† (England), 2011/12 and 2012/13. [* A sentinel network (USISS sentinel hospital network) of acute NHS trusts has been established in England to report weekly laboratory-confirmed influenza cases hospitalized at all levels of hospital care. † The Respiratory Datamart System is a laboratory-based surveillance scheme, including both positive and negative results, and has been established in England to monitor the activity of influenza and other respiratory viruses.]
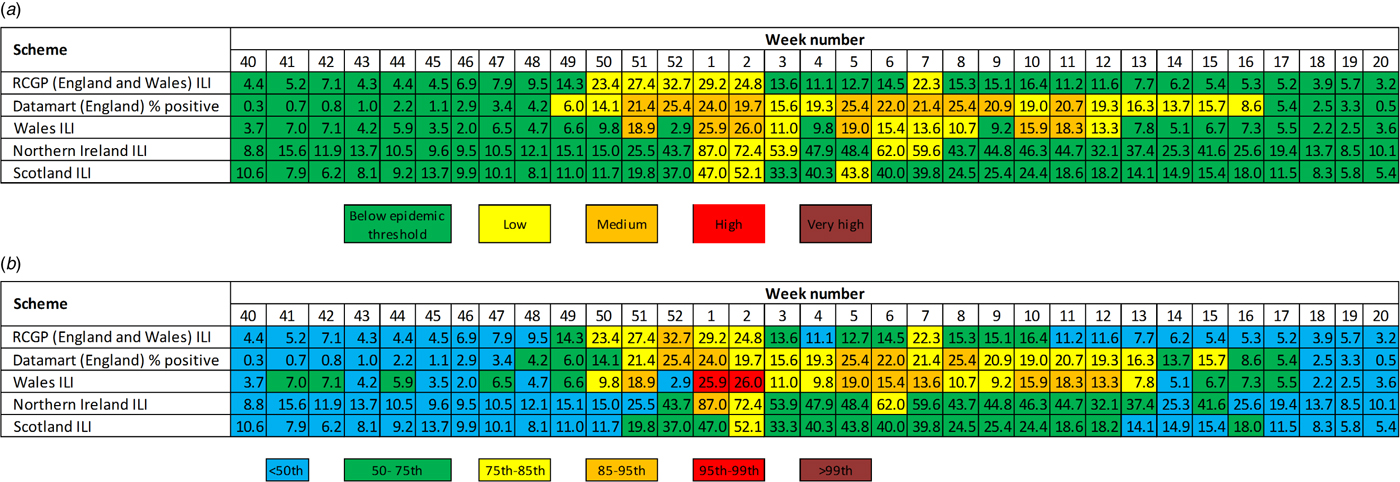
Fig. 3. Weekly influenza-like illness (ILI) GP consultation rates per 100 000 population by scheme and their corresponding moving epidemic method (MEM) category and percentile category, 2012/13, UK. (a) MEM categories; (b) percentile categories. RCGP, Royal College of General Practitioners; ILI, influenza-like illness.
Table 2. Weekly estimated MEM thresholds and percentile values for ILI GP consultation rates per 100 000 population and proportion of samples positive for influenza through RDMS, 2011/12 and 2012/13, UK
MEM, Moving epidemic method; ILI, influenza-like illness; RDMS, Respiratory Datamart System; RCGP, Royal College of General Practitioners.
Start of the influenza season
All the MEM pre-epidemic thresholds (Table 2) calculated were lower than the traditional thresholds across schemes and seasons. When the MEM approach was directly compared to the percentile approach, the MEM pre-epidemic threshold levels were found to be most comparable to the 75th percentile values for all schemes looked at (Table 2).
In 2011/12, the traditional thresholds were not crossed in any scheme, despite evidence of circulating influenza virus. The MEM pre-epidemic threshold was crossed in the RCGP ILI GP consultation scheme at the peak in influenza activity in week 7. This is illustrated in Figure 4 which shows for each scheme the traditional threshold and the MEM pre-epidemic threshold. Additionally, weeks are colour-coded according to how the values compare to percentile cut-off points as in Figure 3 b. In the Welsh scheme, the MEM threshold was crossed in week 8 but it was also crossed earlier in week 1. Northern Ireland appeared to have comparatively lower ILI GP consultation rates which did not cross the MEM threshold, peaking in week 11.
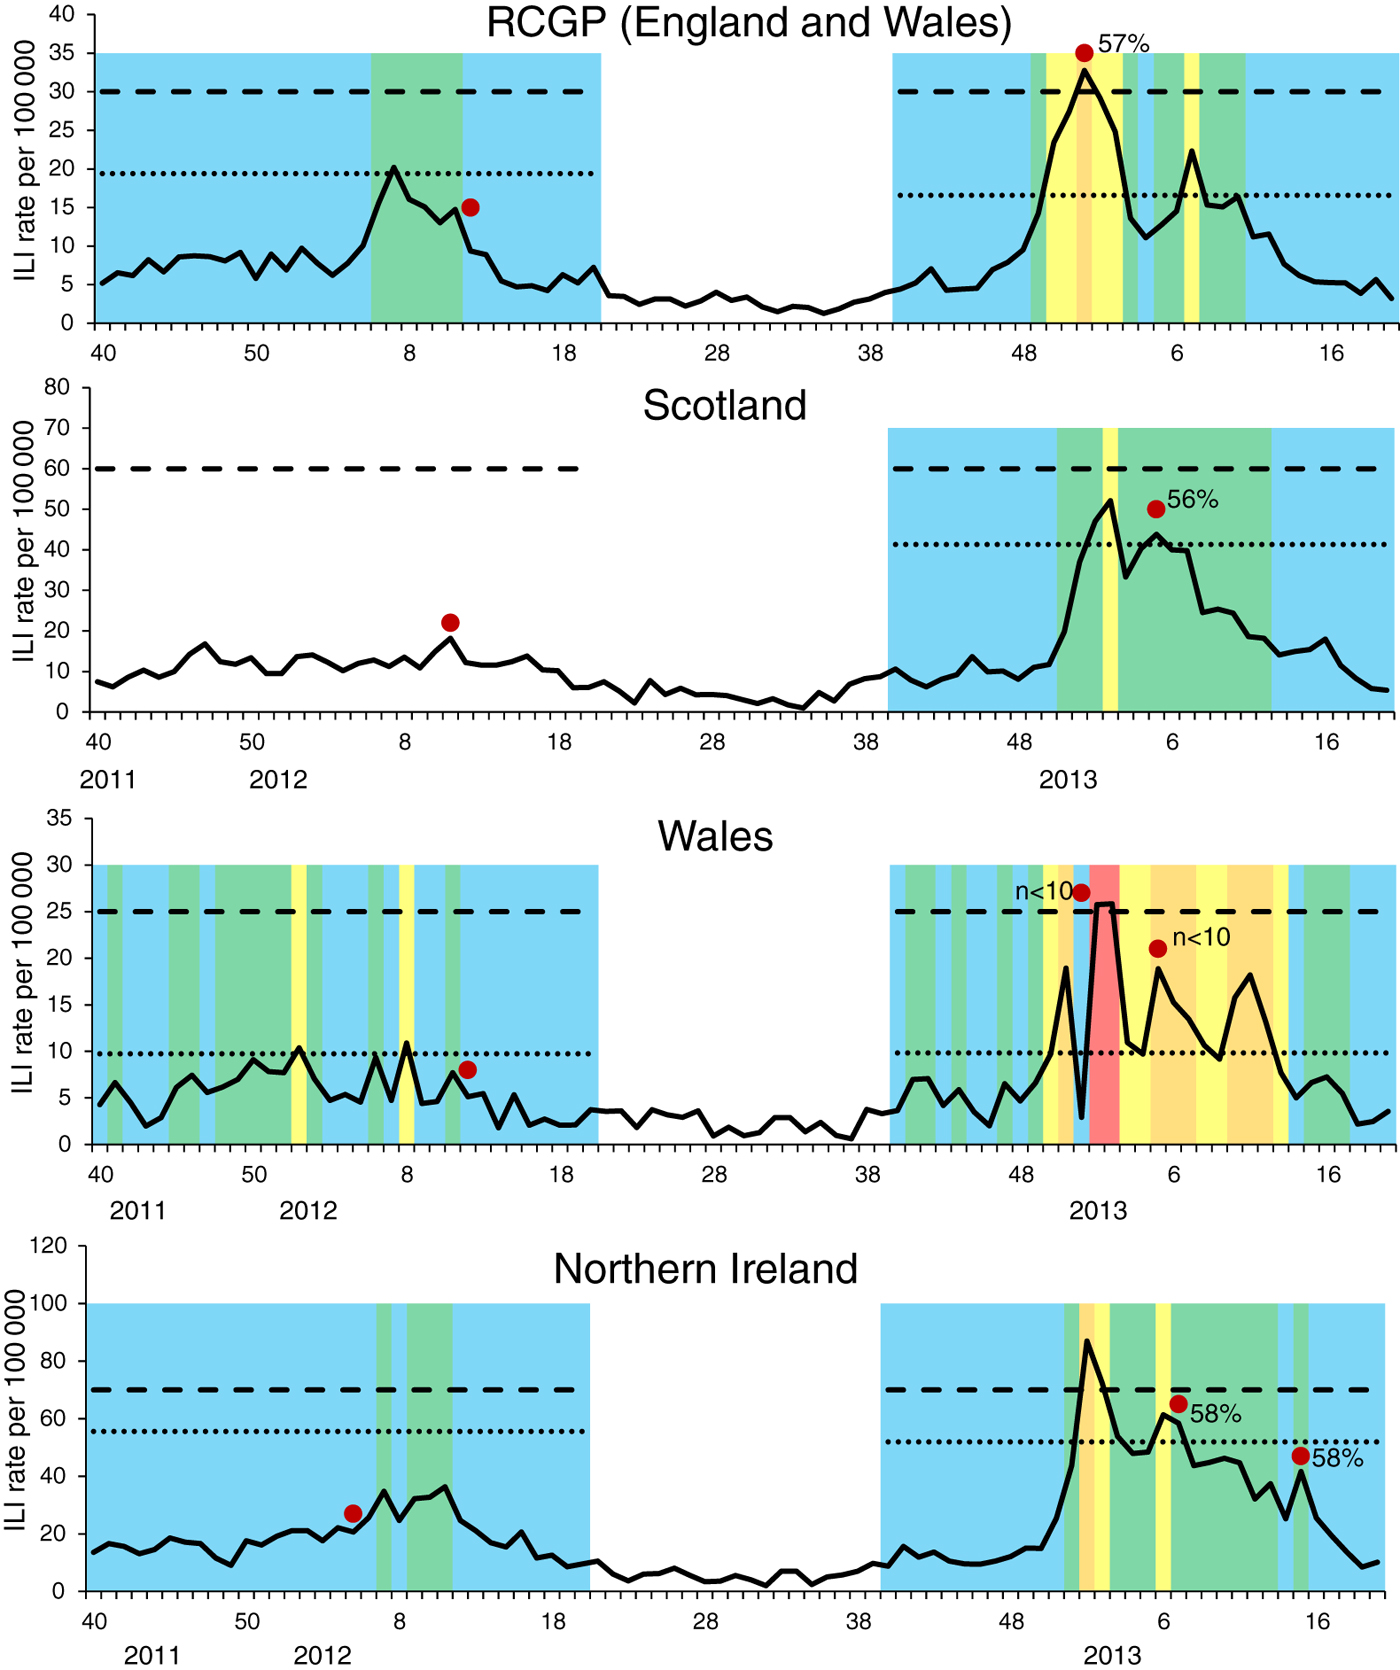
Fig. 4. Weekly influenza-like illness (ILI) GP consultation rates per 100 000 population by scheme* with corresponding thresholds and percentile category, 2011/12 and 2012/13†. - - - -, traditional threshold; ·····, moving epidemic method pre-epidemic threshold. (* Data was not available for Scotland for the 2011/12 season due to general practice software changes. † The weeks are colour-coded as follows: blue, <50th percentile; green, 50–75th percentile; yellow, 75–85th percentile; orange, 85–95th percentile; red, 95–99th percentile. Red dot indicates week of peak sentinel positivity with corresponding % samples positive for influenza. Few samples were received in 2011/12 and so % positive is not shown. Fewer than ten samples were received weekly though the Welsh scheme in 2012/13 and so % positive is not shown.)
In 2012/13, RCGP's traditional threshold was only crossed for one week (week 52), Northern Ireland's for two weeks (weeks 1 and 2) and Scotland's was not crossed at all. However the RCGP MEM pre-epidemic threshold was breached in weeks 50–52 and later in week 7, denoting the two waves of influenza activity. A similar situation was seen in Scotland (threshold breached in weeks 1–2 and 5) and Northern Ireland (threshold breached in weeks 1–3 and 6–7). The MEM threshold for the Welsh data was exceeded for comparatively more weeks (n = 11; weeks 51, 1–3, 5–8, 10–12), with larger fluctuation in the dataset seen, while the traditional threshold was only crossed in weeks 1 and 2.
When assessing percentile categories, in 2011/12 ILI consultation rates remained at or below the first cut-off, the 50th percentile, for most of the season across all the sentinel ILI surveillance schemes (Table 2 and Fig. 3). Despite low rates overall, when increased influenza activity was seen, the percentile results of the different surveillance schemes showed some concordance in terms of an increase in intensity of activity (Fig. 4). In 2012/13, ILI consultation rates were at or below the 50th percentile for a smaller proportion of the season compared to 2011/12 across all the sentinel ILI surveillance schemes (Fig. 4), with an increase above the 75th percentile seen in the same week as an increase above the MEM pre-epidemic threshold through the RCGP scheme (week 50), for Northern Ireland (week 1) and slightly later for Scotland (week 2, Fig. 3). ILI rates in the Welsh scheme showed a larger degree of fluctuation than in other schemes and, as with the MEM approach, the fluctuation was also reflected in the assigned percentile category.
Intensity of the influenza season
During 2011/12, ILI activity either did not cross or only just breached the MEM pre-epidemic threshold (Fig. 4) and so MEM-defined activity was only ‘low’ across ILI consultation schemes in this season. When comparing to percentile categories, RCGP rates went above the 50th percentile but were less than the 75th percentile. A similar level of activity was seen in Northern Ireland but comparatively higher percentile categories were reached in Wales, with an increase into the 76th–85th percentile group (Fig. 4).
In 2012/13, MEM-defined ‘low’ activity was reported through the RCGP, Scotland and Northern Ireland schemes, but did not reach a higher MEM activity level (Fig. 3). The similar level of activity between schemes is corroborated by peak swab positivity (Fig. 4). However the Welsh scheme reached a comparatively higher ‘medium’ level of activity according to the MEM method. When assessing percentile categories, higher activity was seen across schemes compared to 2011/12, with Wales ILI rates going above the 95th percentile, RCGP and Northern Ireland ILI rates peaking above the 85th percentile and Scotland ILI rates peaking above the 75th percentile. Fluctuation between percentile categories was seen across the season, more so than with the MEM-defined categories.
At the end of the 2012/13 season, rates went consistently below the MEM pre-epidemic threshold first for the Scottish scheme, followed by the RCGP and Northern Ireland schemes 2 weeks later and then the Welsh scheme a further 5 weeks later (Fig. 3). Decreasing below the 75th percentile occurred in the same week for the RCGP scheme, earlier for the Scottish and Northern Ireland schemes and later for the Welsh scheme (Fig. 3).
DISCUSSION
During the 2011/12 and 2012/13 influenza seasons, the MEM and percentile approaches for standardizing influenza activity were piloted and applied to weekly ILI GP consultation rates from various sentinel surveillance schemes operational across the UK. Although in 2011/12 low influenza activity was observed and the traditional thresholds were not breached, it was still possible to detect an increase in activity with both the MEM and percentile defined threshold approaches. In 2012/13, the MEM and percentile methods were able to detect the two separate periods of influenza activity resulting from influenza A and influenza B observed through other influenza surveillance systems. By contrast, the traditional thresholds across the UK were either not breached or only breached briefly during one of the peaks. The percentile approach produced similar observations to the MEM approach, with both methods allowing a clear comparison of intensity of influenza activity across schemes.
The methods presented here continue the threshold development work originally published by Fleming et al. [Reference Fleming5], which defined epidemic periods of influenza across The Netherlands and England and Wales. An important clinical consequence of the threshold is its use, along with other influenza surveillance indicators, to inform the decision on the prescription of antivirals in the community at the beginning of the season once influenza is considered to have started to circulate in the general population [3, 4]. In 2011/12 the existing ILI thresholds were not breached, activity levels through other schemes were low and influenza circulated relatively late in the season [20], contributing to the decision not to trigger community antiviral prescription. The MEM approach in this paper produced pre-epidemic thresholds appropriate to both a low activity season in 2011/12, with ILI rates crossing the threshold during the week with peak activity and during a more typical yet prolonged influenza season in 2012/13 with two waves of activity. The validity of the MEM approach was corroborated by similar observations through the percentile approach and through concordant timing when assessing RDMS influenza positivity data.
Despite work done to address differences between the ILI surveillance schemes, such as using the same clinical case definitions, the baseline rates still appear to differ, which could be due to the surveillance scheme, genuine differences in incidence or factors such as healthcare-seeking behaviour. Therefore assessing each scheme through a standardized comparison is crucial to assist interpretation [Reference Tay23]. When comparing intensity of activity between schemes through both approaches, similar levels of activity were reached in England and Northern Ireland in both 2011/12 and 2012/13, and also in Scotland when assessed in 2012/13. The similar intensity across schemes was corroborated by similar peak sentinel GP swab positivity during the season [20, 21]. The Welsh sentinel GP scheme on the other hand flagged comparatively higher activity in both 2011/12 and 2012/13 which was more pronounced through the percentile approach. This increase in Wales may result from genuinely higher activity, although higher activity was not immediately evident through other Welsh surveillance schemes such as hospitalizations [20, 21]. The Welsh scheme had a comparatively small number of practices and a very variable time series with low absolute rates which may not be compatible with these methods. Further work may need to be undertaken to smooth the current and historical data prior to applying these methods to the Welsh data.
The advantage of both the MEM and the percentile statistical approaches presented here is their simplicity in combination with accurate representation of the disease burden. There is a rich literature detailing methods aimed at detecting the start of influenza activity and which provide an alternative to the methods currently under consideration [Reference Fleming5, Reference Conesa24–Reference Tillet and Spencer27]. Yet many of these are relatively complex and require specialist programs to implement. Conversely a limitation of both of these methods is the requirement for a substantial number of seasons of consistent historical data to accurately calculate values. This time series will be disrupted by any major change in the sentinel surveillance schemes, which has occurred several times for some schemes. To overcome this limitation, the outdated dataset can be adjusted in line with the recent time series. However, this is only realistically possible if there is a simple relationship between the two series. Adjustment seemed to work well for the Scottish dataset. However for the Welsh dataset, while plausible results were produced it is possible that scaling between the old manual scheme and new automated schemes resulted in a threshold value that was too low. Further testing of thresholds and intensity categories in seasons with varying influenza activity will determine the suitability of the threshold for a dataset with low fluctuating values.
Influenza activity is reported using a range of surveillance indicators. The increase in ILI consultation rates was consistent with increases in influenza positivity through samples from patients in primary care and influenza-confirmed hospitalizations and other influenza surveillance data sources [20, 21]. Additionally influenza positivity through RDMS was assessed through this standardized approach and produced similar results to ILI consultation rates, indicating increases in the latter likely result from influenza. Building on the pilot work, the approaches will be applied to age-specific ILI consultation rates and age-specific influenza positivity, as well as expanding to assess other surveillance sources such as syndromic data, to see if wider application provides additional useful information. Aside from allowing comparable reporting between countries, the hierarchical categorization approach for reporting of intensity could be included in statistical models where influenza activity is included as a predictor, such as attribution of excess mortality [Reference Green28]. Influenza indicators such as ILI consultations and proportion of samples positive could be modelled singly or in combination [Reference Tay23, Reference Green28, Reference Goldstein, Viboud, Charu and Lipsitch29]; the MEM will improve the representation of influenza activity which will in turn improve burden estimates. Determining burden as accurately as possible is crucial for assessing the impact on routine surveillance data sources of the seasonal vaccination programme in the UK, which has recently been extended to routinely target all children aged 2–16 years through a gradual rollout over several seasons [30].
Comparability of measures of intensity of activity with countries across Europe will be important for assessing the timing and impact of the influenza season in different countries. The findings of this pilot study reinforce the value of the MEM approach in three ways; by comparing MEM levels to several clinical indicators, by evaluating the method during two different influenza seasons and by comparing its levels to the established percentile approach. However further experience with more season-to-season variation is required, particularly for areas with limited data coverage.
The MEM pre-epidemic threshold has been adopted by ECDC and was used for reporting across Europe in both 2011/12 and 2012/13, where approved by the member states. Following this pilot work, it was shown to be appropriate and has been adopted by all countries within the UK since the start of the 2013/14 season, and has been presented in the routine in-season public influenza reports [2, 21, 31, 32]. The MEM pre-epidemic threshold has allowed for the first time a comparative UK-wide assessment of the start of influenza activity and will help inform community antiviral prescription triggers at the beginning of the season. Further categorization using the MEM approach allowed a comparison of intensity of influenza activity with sensible results produced, as supported by results from the percentile approach, although both approaches may be less suited for a variable dataset with a comparatively small denominator. MEM will be further piloted in future seasons and applied to other key influenza surveillance data sources. The development work in this study will form important preparation for evaluating the impact of the childhood influenza vaccination programme in the UK.
ACKNOWLEDGEMENTS
We gratefully acknowledge the contribution of all sentinel general practices who participate in the RCGP Weekly Returns Service, and in schemes coordinated by Public Health Wales, Public Health Agency Northern Ireland and Health Protection Scotland. We further acknowledge the laboratories involved in testing the sentinel swabs and in particular our colleague Praveen Sebastian Pillai. We thank our colleagues Hongxin Zhao and Nicki Boddington for the respective provision of influenza positivity and hospitalization data to validate the use of ILI rates as a surrogate for true influenza incidence, and Jennifer Bishop and Beatrix von Wissmann for provision of GP consultation data for Scotland. In addition, we gratefully acknowledge the work done by Tomás Vega and his team in developing the moving epidemic method and making it publicly available through an R package.
DECLARATION OF INTEREST
None.


