


Introduction
Acute respiratory infections cause significant morbidity and mortality accounting for 5.8 million deaths worldwide in 2010 [Reference Howard1, Reference Ambrosioni2]. In Australia, influenza-like illness (ILI), defined as cough, fever and fatigue is a common presentation in general practice and results in reduced productivity and lost working days [Reference Sullivan3]. The known viral or bacterial pathogen is established in only 50–60% of ILI cases while the rest are usually of unknown aetiology. Of those with a known cause, 50% are due to influenza while the remaining are due to a respiratory syncytial virus (RSV), para-influenza virus (PIV), adenovirus (ADV), rhinovirus (HRV), human metapenumovirus (HMPV) and others [Reference Cedraschi4].
Working-age adults constitute a significant proportion of the population in developed countries and are generally considered to be at low risk of complications from ILIs, and in turn, have generally been overlooked. However, working-age adults can also suffer from considerable morbidity as shown by the influenza pandemic of 1919, 1967 and 2009 [Reference Reichert, Chowell and McCullers5, Reference Gasparini, Amicizia, Lai and Panatto6]. Although infection is often self-limited in this group, during a pandemic an economic loss of $60 billion USD per year could be expected globally [Reference Sands, Mundaca-Shah and Dzau7]. Additionally, on an individual basis, an average of 4–6 working days may be lost per infection/case [Reference Keech and Beardsworth8].
At any given point in time, there are many respiratory pathogens other than influenza circulating within the community. However, although influenza viruses have received justified attention due to their ability to cause pandemics, the co-circulation of non-influenza viruses (NIVs) such as rhinovirus during the 2009 H1N1 pandemic and in later ‘flu seasons’, have highlighted the need to monitor NIVs in conjunction with influenza surveillance [Reference Peci9, Reference Pascalis10].
The aim of this study was to describe the viral aetiology and epidemiology of ILI in Australian working-age adults.
Methods
ILI cases in general practice
The Royal Australian College of General Practitioners (RACGP) established the Australian Sentinel Practices Research Network (ASPREN) as a national infectious disease surveillance system for Australia in 1991 [Reference Parrella, Pearce and Lit11]. ASPREN's main purpose was to monitor infectious diseases that were commonly seen in general practice, including influenza, and to allow for the development of early prevention strategies in the event of a pandemic. Data reporting became web-based in 2006, with automated de-identified data extraction from patient management software being introduced in 2010. Apart from ILI, other conditions such as gastroenteritis, chicken pox and shingles were also reported by more than 250 General Practitioners (GPs) across Australia. However, the focus of this paper is ILI. Participating GPs were recruited with a target of one GP per 200 000 population for metropolitan areas and one GP per 50 000 population in rural and remote locations [Reference Sullivan3]. Data were collected through weekly de-identified data extraction from medical records, web-based reporting and faxed paper forms [Reference Parrella, Pearce and Lit11, 12].
Specimen collection and testing
Swab testing was introduced in May 2010 and ASPREN GPs were asked to systematically collect nasopharyngeal or nasal swabs from approximately 25% of patients presenting with ILI. Specimens were then forwarded to the Institute of Medical and Veterinary Science (IMVS) where real-time reverse transcription polymerase chain reaction (RT–PCR) tests were used to identify influenza (IFA and IFB) and NIVs (HRV, ADV, PIV, HMPV and RSV) [Reference Sullivan3]. Western Australian swab data were excluded due to GPs using a different swab-testing system.
Analysis
Weekly ILI rates were calculated for the study period defined as consultations and ILI cases notified to ASPREN between 1 January 2010 and 31 December 2013. ILI rates were calculated using the formula:
 $${\rm ILI\; rate =} \displaystyle{{{\rm Number\; of\; ILI\; cases\;}} \over {{\rm Total\; GP\; consultations\;}}} {\rm \times 1000}$$
Frequencies were used for descriptive analysis and cross-tabulations of the different variables in the swab dataset. The proportions of swabs testing positive for influenza and NIVs were calculated by week and month of the year. Chi-square (χ 2) tests were used to examine whether virus detection was associated with differen demographic characteristics. Logistic regression was used for comparison across age groups (children 0–19 years; younger working adults 20–49 years; older working adults 50–64 years; and older adults >65 years), sex, state and month of specimen collection. All statistical tests were two-sided with α = 0.05 for statistical significance. Analyses were undertaken using IBM SPSS (v.20, IBM Corp, Armonk, NY, USA) and Stata software (v.13, StataCorp LP, Texas, USA).
Bivariate Poisson regression models with identity link were initially used to model the monthly contribution of each of the respiratory viruses to ILI consultations among working-age adults. However, as overdispersion was apparent in the fit of these models, negative binomial regression models (NBR) were instead used [Reference Bollaerts13]. A multivariable NBR was then fit, with the criterion for inclusion in the initial multivariable model respiratory viruses with P < 0.2 in the bivariate models. Viruses that were not significant in the multivariable model at P < 0.05 were then removed, resulting in the final NBR model.
Ethical statement
Data provided by GPs to ASPREN are de-identified and used for public health surveillance of ILI in Australia; therefore, there was no requirement for Human Research Ethics Committee approval. However, informed written consent was obtained from patients for the collection of swab samples and use of de-identified results for surveillance purposes.
Results
ILI surveillance
There were 2 901 788 reported consultations made at ASPREN practices between 1 January 2010 and 31 December 2013. Of these, 22 429 cases met the ILI case definition: females – 11 679 (52%) and males – 10 746 (48%) with an overall ILI rate of 7.7 cases per 1000 consultations. Working-age adults (20–64 years) represented 45% of ILI cases (data not shown).
The age-stratification analysis shows that working-age adults were not overrepresented in either the ILI notifications or the swab dataset (Fig. 1).
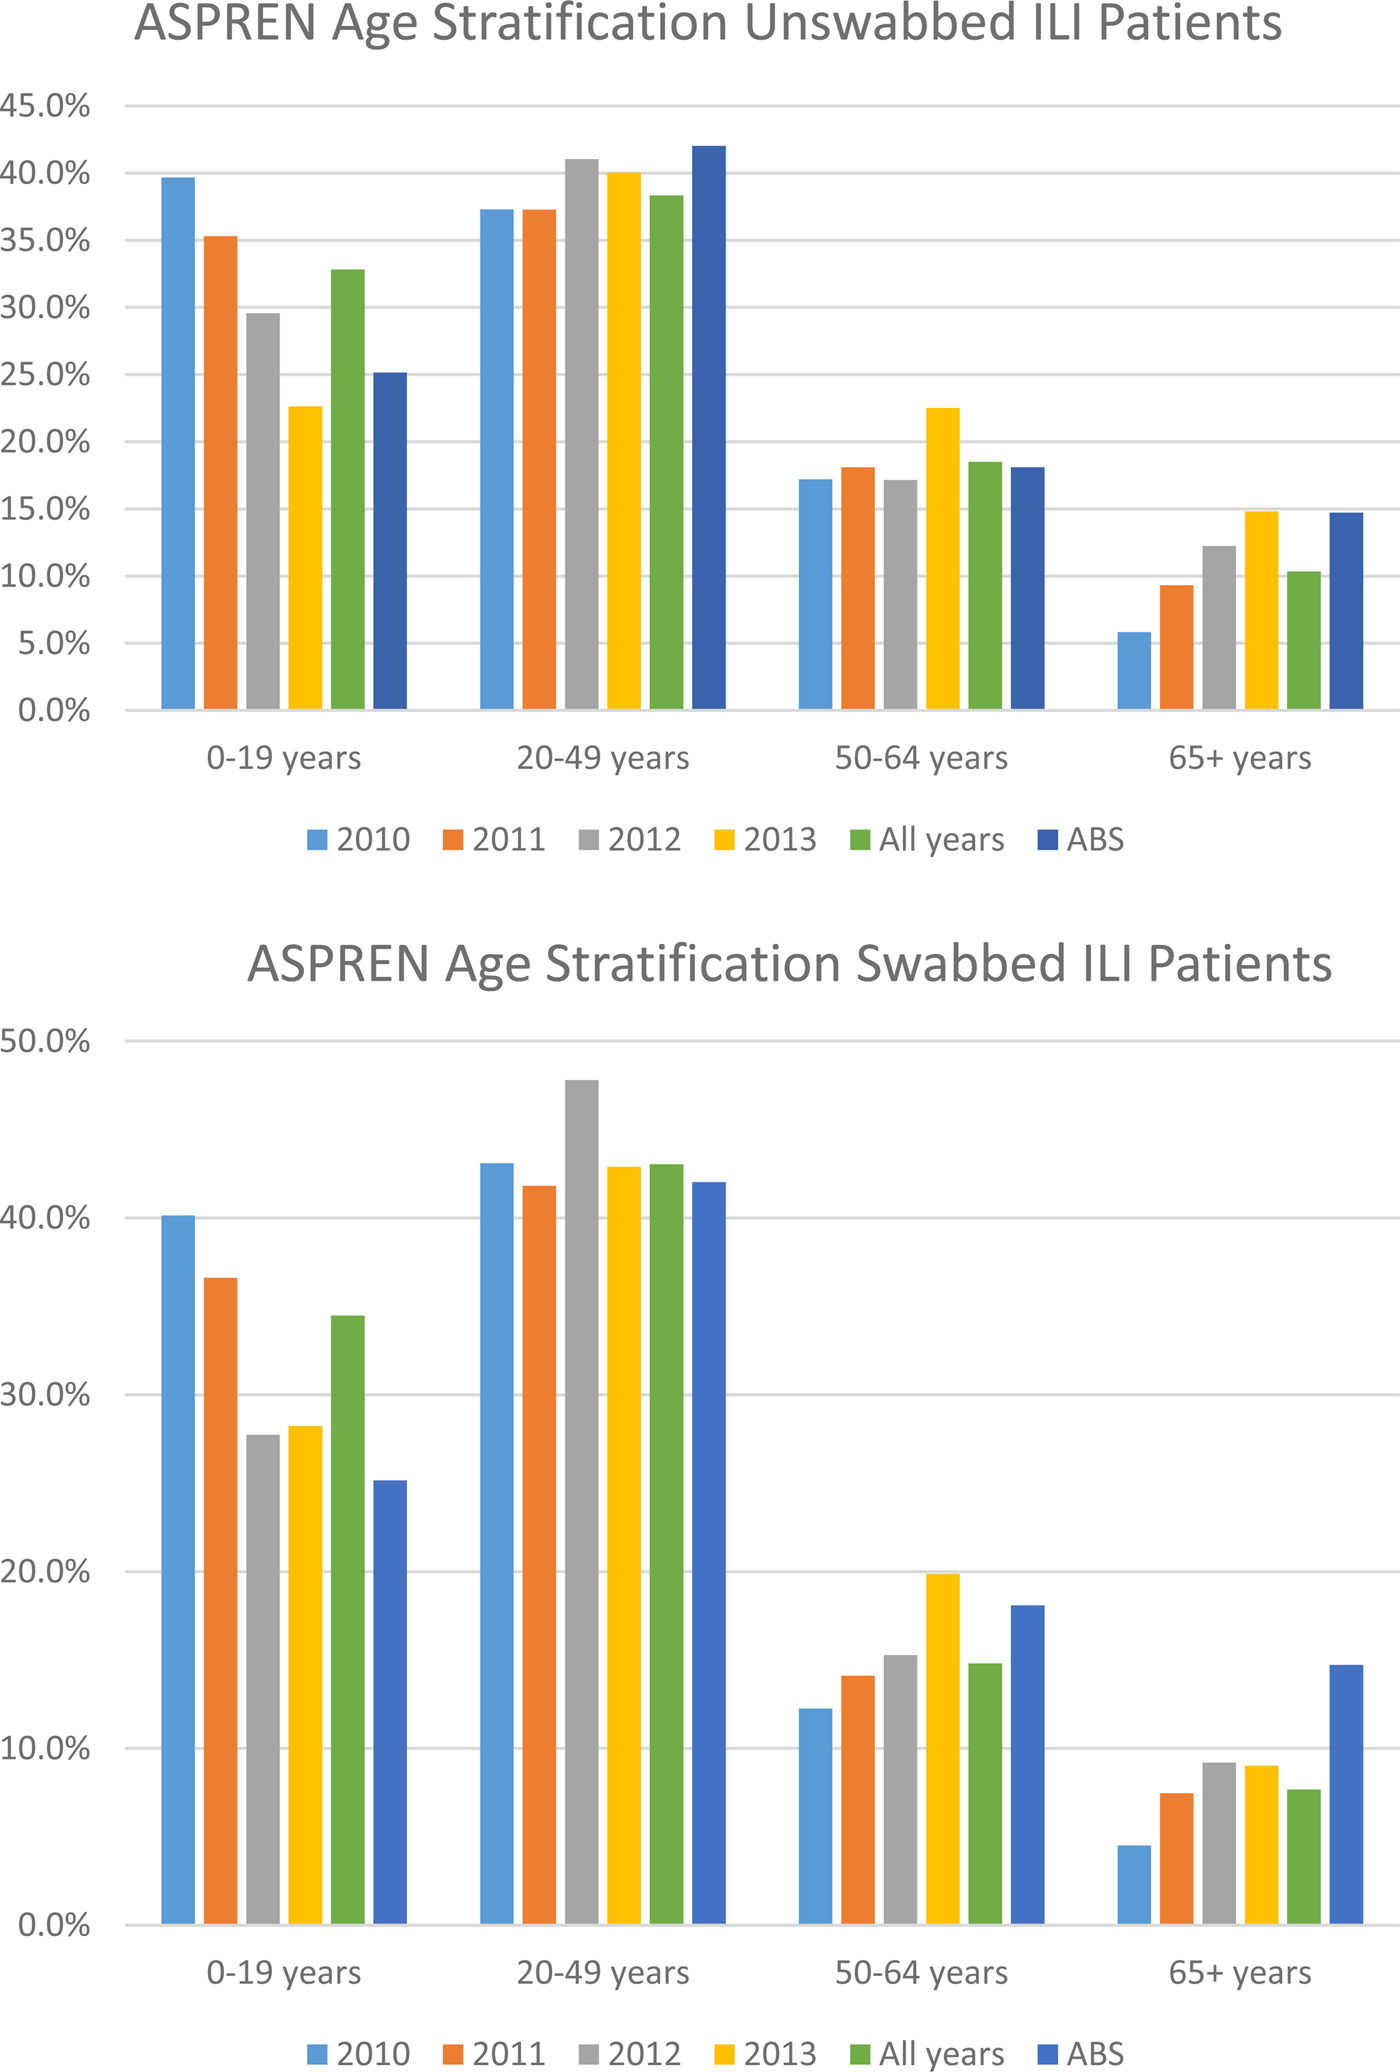
Fig. 1. Percentage of unswabbed and swabbed of ASPREN ILI patients by age group compared to Australian Bureau of Statistics (ABS) data: 2010–2013. Source: ABS (2014). Population by Age and Sex, Regions of Australia.
Over the 4 years of surveillance, 2012 had higher ILI rates than other years (12 cases/1000) followed by 2011 (nine cases/1000), 2010 (8.5 cases/1000) and the lowest rate was seen in 2013 (5.5 cases/1000).
Virus detection
Among the 22 429 ILI cases, 5031 (22.0%) swab samples were taken and tested for influenza and other respiratory viruses. Of these samples, 3201 (32.0%) were from individuals of working-age (20–64) and 1745 (54.0%) were female. In the study population, there were 1789 (55.8%) cases positive for at least one virus and a single infection was identified in 1677 (52.4%) patients. Influenza A and rhinovirus were most commonly detected, with an incidence proportion of 20.6% (661/3201) and 18.6% (596/3201), respectively. Of the 860 samples examined that were positive for influenza, 77.0% were type A and 23% were type B. Other viruses were found in <5.0% of the samples. The presence of mycoplasma pneumonia was detected in 41 cases, of which the majority (30 cases) were in working-age adults.
The age distribution of cases positive for respiratory viruses is summarised in Table 1. The proportion of ILI patients positive for IFA among those aged 20–49 years was slightly lower than those aged 50–64 years and considerably higher than those aged 65 + (OR = 1.42, 95% CI: 1.12–1.79). H1N1 (2009) proportions were higher in younger adults than in older working adults and the elderly (OR = 4.85, 95% CI: 2.41–9.75). Viruses such as RSV, ADV and PIV3 was more common in younger age groups (<20 years; 6%, 3.3% and 4.4%, respectively) than those in the working and older age groups (P < 0.05). Within the working-age groups, older adults (50–64 years) had significant higher RSV (5.1%) and PIV (5.1%) cases than younger adults (20–49 years, 2.4% and 1.7%, respectively; P < 0.05).
Table 1. Results of the logistic regression analyses for the odds of infection with viral (influenza and non-influenza viruses) and bacterial agents for influenza-like illness (ILI) swabbed cases by age group: 2010–2013
Models adjusted for month of specimen collection and State. Shaded cells denote statistical significance at P < 0.05 and blank cells indicate insufficient data. Total swabbed cases do not equal to 5031 due to missing data on age. Highlighted age group is our study population.
Within the working-age groups, co-infections were seen in 112 patients (3.4% of swabbed ILI cases). The most frequent combinations were IFA + HMPV (n = 16), IFA + HRV (n = 13), HMPV + HRV (n = 13), IFB + HMPV (n = 9), ADV + HRV (n = 6) and IFB + HRV (n = 6). The aetiological distribution of ILI co-infections by age group is shown in Table 2. It was also observed that younger adults recorded more co-infections than older working-age adults (34% and 14%, respectively). Additionally, co-infections of two or more viruses were detected in four individuals, three of which were aged 0–5 years.
Table 2. Distribution of viruses and bacteria related to co-infections among all influenza-like illness (ILI) patients by age group: 2010–2013
Contribution of respiratory viruses to ILI
Negative binomial regression
The results of the final NBR model of respiratory viruses on ILI consultations showed that ILI rates in working-age adults (20–64 years) increases by 1.2% [95% CI: 1.0049–1.0185] per month for every positive IFA result.
Seasonal distribution
Figure 2 provides a snapshot of the ILI activity and various respiratory viruses that circulated within the study population by a week from 2010 to 2013. Overall, there was a consistent pattern for ILI activity starting from a baseline level at the beginning of the year (weeks 1–8), with a slight rise during the autumn months of April–May and then increasing during the winter months of June–September. A peak is reached in August and ILI activity returns to baseline during the summer month of December. However, the ILI activity peak occurred very late in the spring months of October in 2010 (week 40) while in 2011 and 2013 the peak was during mid-August (week 33). Further, ILI rates peaked much earlier in 2012 (week 29; 26 cases/1000) than the peak in 2011 and 2013, with the ILI peak being highest in this year.
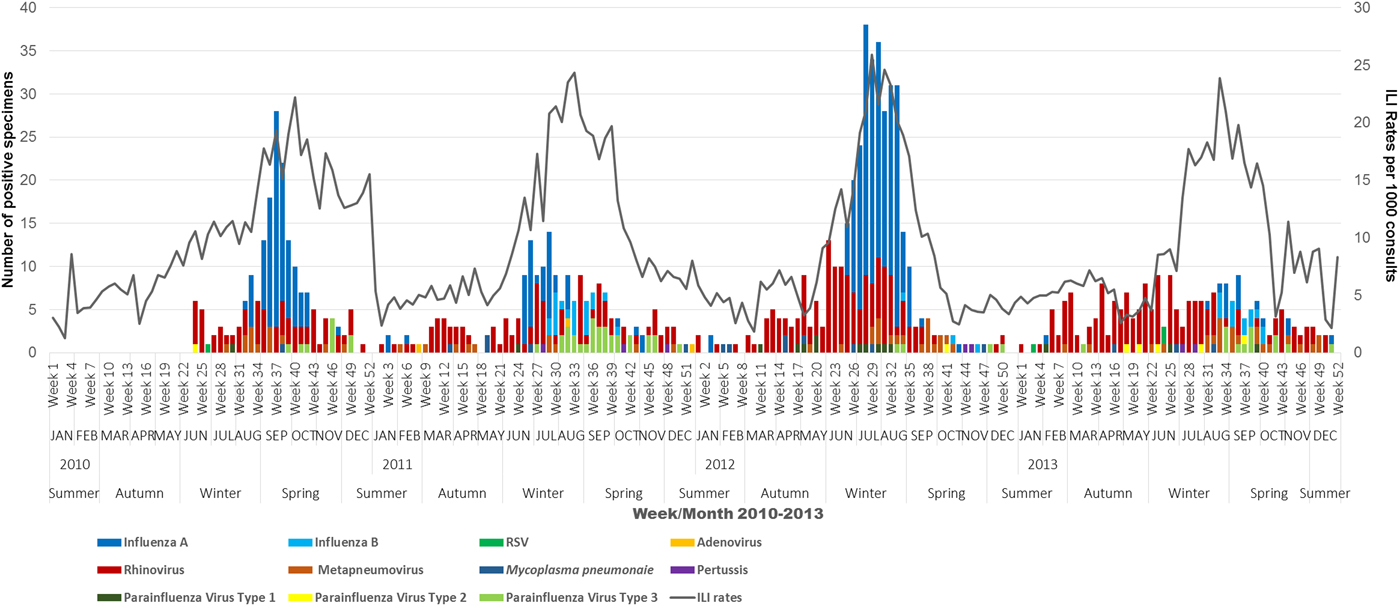
Fig. 2. Overview of ILI activity (ILI rates) and corresponding viral activity of influenza and other respiratory viruses for working-age adults by week, month and season, 2010–2013. Note: Zero virus detections until week 23 in 2010 as swab testing was only introduced in May 2010.
In Australia, 2012 was the most severe ‘flu season’ between 2010 and 2013, characterised as an early season dominated by H3N2, which is associated with more severe illness in the young and elderly [14]. ASPREN data support these findings.
The proportion or number of samples positive for influenza in 2012 was 33.9% (380) compared with 23.1% (480) in other years. Influenza A was the dominant type with 85.5% of cases positive for influenza A. Additionally, overall virus detection was higher at 57.9%.
Influenza viruses circulated throughout the year, but increased activity was seen during April–October. IFA and IFB often co-circulated throughout the study period but peaked at different times annually (IFA usually peaks in July and IFB usually peaks in August). HRV was active throughout the year peaking in February–March and continuing to be the dominant NIV in the following months until the peak of influenza viruses and further rising to a peak in the spring and early summer (Fig. 3). PIV3 was detected in high numbers in the spring months with December seeing a decrease in other respiratory viruses. RSV followed the HRV pattern of greater activity before and after the IFA peak. Clear cut seasonality was not seen for ADV and PIV 1, 2 as they circulated sporadically throughout the study period.
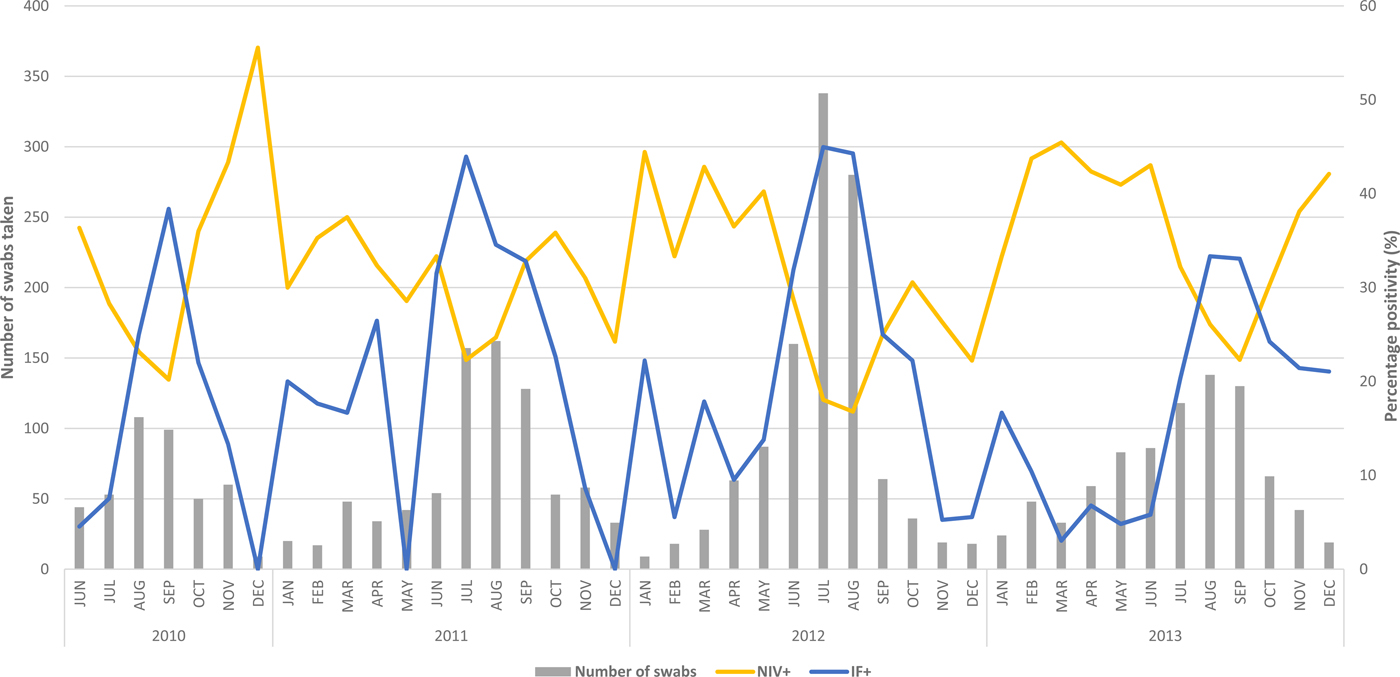
Fig. 3. Swab positivity (%) of influenza (IF+) and non-influenza viruses (NIV+) for working-age adults by month: 2010–2013. Note: Virus positivity is only graphed from June 2010 as swab testing was only introduced in May 2010.
The proportions of influenza and NIV's varied from year to year with 2010 and 2013 seeing a higher proportion of NIV (29.5%, 33.9%) compared with influenza virus (21.3%, 19.5%) (Fig. 3).
Influenza vaccination
Influenza vaccination amongst swabbed ILI cases was 20.3% overall, varying from 15% in 2010 to 24% in 2013 (see for Fig. S1).
Discussion
This is the first Australian study to report the viral aetiology and epidemiology of ILI in working-age adults using representative community surveillance data. Working-age adults made up 45.2% of all ILI notifications with 56% of samples positive for at least one respiratory virus, a finding consistent with recent international data [Reference Falchi15–Reference Bellei17]. In agreement with other studies [Reference Hombrouck18, Reference Zimmerman19], the viruses most commonly detected in our study included IFA (20.6%), HRV (18.6%), IFB (6.2%), HMPV (3.4%), RSV (3.1%), PIVs (3%) and ADV (1.3%). Further, we have demonstrated that IFA is the predominant virus that increases ILI (by 1.2% per month for every positive IFA case) in working-age adults during autumn–winter months while NIVs such as HRV, ADV and PIVs account for ILI activity throughout the year.
Rates of ILI presentations in working-age adults, compared with other groups, in our study appear to be high. Previous research has attributed high ILI notification rates in working-age adults to illness certification requirements by employers [Reference Miller20]. Secondly, it has been noted that following the 2009 pandemic, that risk perception concerning influenza among working adults was higher [Reference Troko21]. Age-stratification analyses show that our results are representative of the Australian population as a whole with the exception of a slight overrepresentation and underrepresentation in the under 19 and over 65 year age groups, respectively [22]. Two plausible reasons for this observation could be: the health-seeking behaviour of parents with children [Reference Van Cauteren23] and the proportion of older people living in residential facilities who access alternative care.
Consistent with previous studies [Reference Hasman16, Reference Mullins24, Reference Ren25], influenza viruses, accounting for 27% of ILI cases, were the most commonly detected viral cause of ILI in working-age adults. IFA in working-age adults was the most frequently detected viruses in this population (20.6% of all ILI cases). This finding is supported by the regression model results where one positive IFA result contributed a 1.2% increase in ILI rates/month. Children and the elderly are commonly assumed to be the most impacted as these populations tend to have lower immunity or are frailer [Reference Cedraschi4]. However, compared with those aged over 65 years, young adults aged 20–49 years had a higher odds of IFA infection due to H1N1pdm09 and greater absolute numbers. Studies have also reported sustained higher swab positivity, higher rates of outpatient ILI consultation and increased rates of hospitalisation, an impact which is unusual among ‘young working adults’ which carried over even after the pandemic years (2010, 2011 and 2013) when H1N1pdm09 was the circulating strain [Reference Chan26, Reference Ellis27]. Studies conducted during the 2009 pandemic have suggested that in comparison with younger age groups (<50 years), older adults and the elderly may have benefited from pre-existing immunity from past exposure to H1N1pdm09 strains that are similar to the 1918 strain [Reference Skountzou28, Reference Valkenburg29]. Higher ‘pre-existing anti-IFA antibodies’ were found in elderly adults born before the 1940–1950s compared with those born after by a Finnish and Belgian study [Reference Hombrouck18, Reference Ikonen30]. This could account for the higher attack rates of H1N1pdm09 among young adults during and after the pandemic.
Even though the proportion of IFB was higher in those aged 0–19 years, which is consistent with the literature [Reference Kelly, Grant, Williams and Smith31], they were the third most common virus among working-age adults (6.2% of all ILI cases) with increased levels of circulation seen in the spring months of 2012 (37% in weeks 36–48; 33% in weeks 49–53) and 2013 (30% in weeks 36–48) compared with other years. This pattern of increased influenza B activity followed by high IFA activity in 2012 and 2013 has been observed in North America and Europe [32, 33].
2012 saw a moderate to severe flu season characterised by high levels of H3N2 circulation, where 70% of swabbed patients were not vaccinated, this being higher than other years. Additionally, vaccine effectiveness against medically attended ILI was estimated to be low in this year 23% (95% CI, −4% to 43%) in 2012 compared with 60% (95% CI 45–70) in 2013 [Reference Sullivan34].
NIVs constituted 29% of all ILI cases in this population, which is in accordance with an ILI study conducted among university students [Reference Mullins24]. Following a typical ‘flu-season’, ILI rates generally start to decline in spring with studies showing that a decrease in influenza virus detection coincides with an increase in NIVs [Reference Linde35]. The percentage of NIVs in our study is higher than in a Korean study where 23% of adult respiratory samples had other viruses in addition to influenza [Reference Noh36]. Positivity may vary between studies due to the differences in case definitions, viral detection methods, viruses targeted and study population characteristics [Reference Peci9].
When we examined the types of NIVs found in our study, HRV was predominant (18%). Data from 12 European countries provide similar estimates in immune-competent adults at their first visit with 5% positive at follow-up [Reference Zlateva37]. Their study also found that even though viral shedding lasted between 1 and 2 weeks, re-infections were more common than prolonged infection and underlying co-morbidities could enhance the chances of re-infection [Reference Zlateva37]. The estimate of HRV from our study was similar to a Brazilian study that found 19.6% of ILI in healthy adults related to HRV infections [Reference Bellei17]. Our study demonstrates overlapping patterns of circulation for the predominant respiratory viruses such as IFA and HRV especially in the cooler months of the year. Even though HRV circulates year-round, the noticeable feature of HRV is that its activity is greater before and after the peak of IFA. This finding is congruent with studies that have found higher HRV circulation coinciding with lower influenza virus activity [Reference Razanajatovo38].
RSV was detected in 3% of ILI swabs which is the same as in a Korean study [Reference Noh36] but lower than a prospective study done in the USA [Reference Hall, Long and Schnabel39] that found a rate of 7% in healthy adults aged 18–60 years. This US study also reported that influenza and RSV infections were the most common causes for work absence constituting about 66% and 38% respectively of cases among those working in universities and healthcare services [Reference Hall, Long and Schnabel39]. Similar to HRV, RSV also has a higher potential for re-infections across all age groups and a mean duration of illness longer than influenza (9.5 vs. 6.8 days) which could add to medical costs and lost productivity [Reference Hall, Long and Schnabel39]. Lastly, RSV was observed to circulate in the same pattern as influenza with peaks in winter months (July) consistent with what was observed earlier, possibly due to their associations with cold temperatures in temperate regions [Reference Haynes40].
ILI rates decline after spring and achieve baseline levels in the temperate parts of Australia during summer spanning December (weeks 49–53) until March. NIVs are the predominant cause of baseline ILI activity during spring-summer. In contrast to this usually observed pattern, the spring–summer of 2010–2011 saw high numbers of IFA cases, which was reported by Kelly et al. (2012) who found increased influenza notifications in Victoria and across Australia during this time period [41]. The delayed IFA season in 2010, that peaked in late September–early October (spring), in contrast to the normal peak in mid-late winter (August), may explain the unusual circulation of influenza. The higher circulation of rhinovirus during the winter of 2010 may have resulted in the delayed IFA activity during spring that extended into summer (December 2010–February 2011). This phenomenon referred to as ‘viral interference’ or interaction is where two viruses that circulate in overlapping patterns or one after the other, compete with each other in a race to dominate the season [Reference Linde35, Reference Schnepf42]. Studies from France and Sweden have also reported delayed influenza activity due to viral interaction [Reference Linde35, Reference Casalegno43]. Understanding such interactions and the epidemiology of viral respiratory illness through the year could be of benefit to primary care clinicians when making decisions about swab testing and deciding when the ‘flu season’ has started. For instance given the low rates of IFA in the summer months doctors could chose not to test most ILI cases safe in the knowledge that most would have an NIV, conversely at the peak of the ‘flu season’ most ILI will be due to influenza and could be presumptively managed as such without immediate recourse to testing.
Co-infections affected 112 patients or 3.4% of ILI cases, which falls within the 0.7–15.3% range found in previous studies [Reference Yang44]. Our finding that younger working-age adults had more co-infections than older working-age adults (with HRV being most frequently found in combination) agrees with recent research [Reference Peci9]. Given that the H1N1pdm09 strain constituted most of the IFA cases among working-age adults, it has been proposed in the literature that they were also at greater risk of acquiring other co-circulating viruses [Reference Peci9]. Further, the frequent occurrence of co-infection with HRV–Influenza combination is attributed to the nature of HRV infection that reduces the immune function by altering the normal levels of lymphocytes (high to low) and neutrophils (low to high) [Reference Xiang45].
The present study has several limitations. Firstly, results regarding numbers of circulating viruses need to be interpreted carefully, given that estimates presented in our study were related only to those individuals presenting to their GPs and/or swabbed. Secondly, ASPREN data are limited to respiratory viruses that are currently monitored. Thirdly, date of vaccination was not recorded, therefore we are unable to ascertain whether the patients were fully vaccinated at the time of presentation (i.e. >14 days after vaccination received). Fourthly we could not include swab data from WA, although seasonal patterns may be different in the semi-tropical north, patterns in the more heavily populated South West are similar to the rest of Australia so the effect on the results will be small. Finally, data were not collected on work status, the purpose of GP visit and/or underlying medical conditions of patients; therefore, it was not possible to determine whether the burden of ILI-related viruses was related to co-morbidities.
Despite limitations, the ASPREN surveillance dataset has much strength. It is able to provide an improved understanding of trends over time of different respiratory viruses, their seasonality and the relative contribution of NIVs to morbidity in working-age adults. The results reinforce evidence that all ‘flu's’ in working-age adults are not due to influenza alone but are often caused by other respiratory viruses that produce similar symptoms. Further, understanding the seasonality patterns of respiratory viruses could improve the management of ILI in the community by reducing the use of antivirals outside the influenza peak in July/August and highlighting the viral nature of ILI throughout the year to decrease antibiotic prescribing. Continued testing is important because about 40% of adults receive antibiotics when diagnosed with ILI [Reference Bergus, Weber, Ernst and Ernst46]. Possible inclusion of other recently discovered respiratory pathogens that are detected using PCR technique may be useful to explore the unknown aetiology of 40% of ILI cases [Reference Peci9].
Supplementary material
The supplementary material for this article can be found at https://doi.org/10.1017/S0950268818000286
Acknowledgements
The authors wish to thank all the GPs participating to the ASPREN surveillance network and would also like to acknowledge Daniel Blakely (ASPREN project officer) for providing the data, Dr Lynne Giles and Ms Suzanne Edwards for advice on statistical analysis and Ms Christina Bareja, Dr Rachel de Kluyver and Dr Sheena Sullivan for reviewing the manuscript and providing their valuable comments. The Australian Sentinel Practices Research Network is supported by the Australian Government Department of Health (the Department). The opinions expressed in this paper are those of the authors, and do not necessarily represent the views of the Department. Elsa Dent is supported by an Australian National Health and Medical Research Council Early Career Fellowship (grant no. 1112672).
Declaration of Interest
None.


