


Introduction
Bovine brucellosis – an economically important reproductive disease of livestock – is one of the most widespread zoonoses globally and remains a major public health problem in many developing countries, including Bangladesh [1]. In humans, person-to-person transmission rarely occurs and disease control primarily depends on the control of brucellosis in animal populations [Reference Seleem, Boyle and Sriranganathan2]. Human brucellosis cases are geographically clustered in regions with a high animal brucellosis prevalence [Reference De Massis3], and control of brucellosis in animals drastically reduces the incidence of human brucellosis [Reference Zinsstag4, Reference Pappas5].
Bovine brucellosis causes infertility, reduced milk yield and calf loss [1]. Both human and animal brucellosis in Bangladesh is caused by Brucella abortus [Reference Rahman6]. The annual economic loss due to bovine brucellosis in indigenous cows in Bangladesh is estimated to be €720 000, and €12 per cross-bred cow [Reference Islam7]. The reported animal-level seroprevalence in Bangladesh cattle varies from 0% to 18.4% [Reference Islam8], based on the Rose Bengal test (RBT), standard tube agglutination test, interpreted either alone or in series. Since none of the tests used are considered a gold standard, reported prevalence estimates are apparent seroprevalence. Moreover, test performance evaluated in naturally infected Bangladesh cattle did not adjust for imperfect sensitivity (Se) and specificity (Sp) of the reference test [Reference Ahasan9].
Prerequisite to brucellosis control/eradication efforts is the correct evaluation of the diagnostic tests that will be used [Reference Greiner and Gardner10] to provide accurate information about disease prevalence. This is needed to estimate disease impact on human health and economic losses, and to design and conduct surveillance programmes. Making policy decisions without knowledge of true disease prevalence can lead to unsuccessful programmes and wastage of limited resources [Reference McDermott, Grace and Zinsstag11].
Diagnostic test performance is traditionally evaluated by comparison to a perfect test (i.e. a gold standard test, assumed to have 100% Se and Sp). Isolation and identification of Brucella spp. is considered to be the ‘gold standard’ for brucellosis diagnosis [Reference Alton12]. However, isolation is difficult to perform in developing countries (lack of trained personnel and sophisticated laboratory facilities with high level safety containment). Bayesian latent class models are increasingly gaining acceptance [Reference Arif13] as a valid alternative for estimating the accuracy of diagnostic tests in the absence of a gold standard. In these models, the true infection status is considered unknown – hence the term latent – and Se and Sp estimation is based on the cross-classified results of the tests under consideration after their application in multiple populations [Reference Black and Craig14].
In this study, we estimated the Se and Sp of three serological tests – indirect enzyme linked immunosorbent assay (iELISA), RBT and SAT – using Bayesian latent class models. Further, the animal-level true prevalence of brucellosis in two populations of naturally infected cattle in Bangladesh was estimated.
Methods
Study area and animal husbandry practice
The study area was Mymensingh district (MD) and the Government dairy farm (GF) in Savar, located in the Dhaka district of Bangladesh (Fig. 1), located between latitudes 23°31′ and 25°12′N and longitudes 90°01′ and 90°47′E. The areas were chosen because of the location of Bangladesh Agricultural University which manages the brucellosis diagnostic laboratory and because they have the highest livestock population density (>600/km2) in Bangladesh.
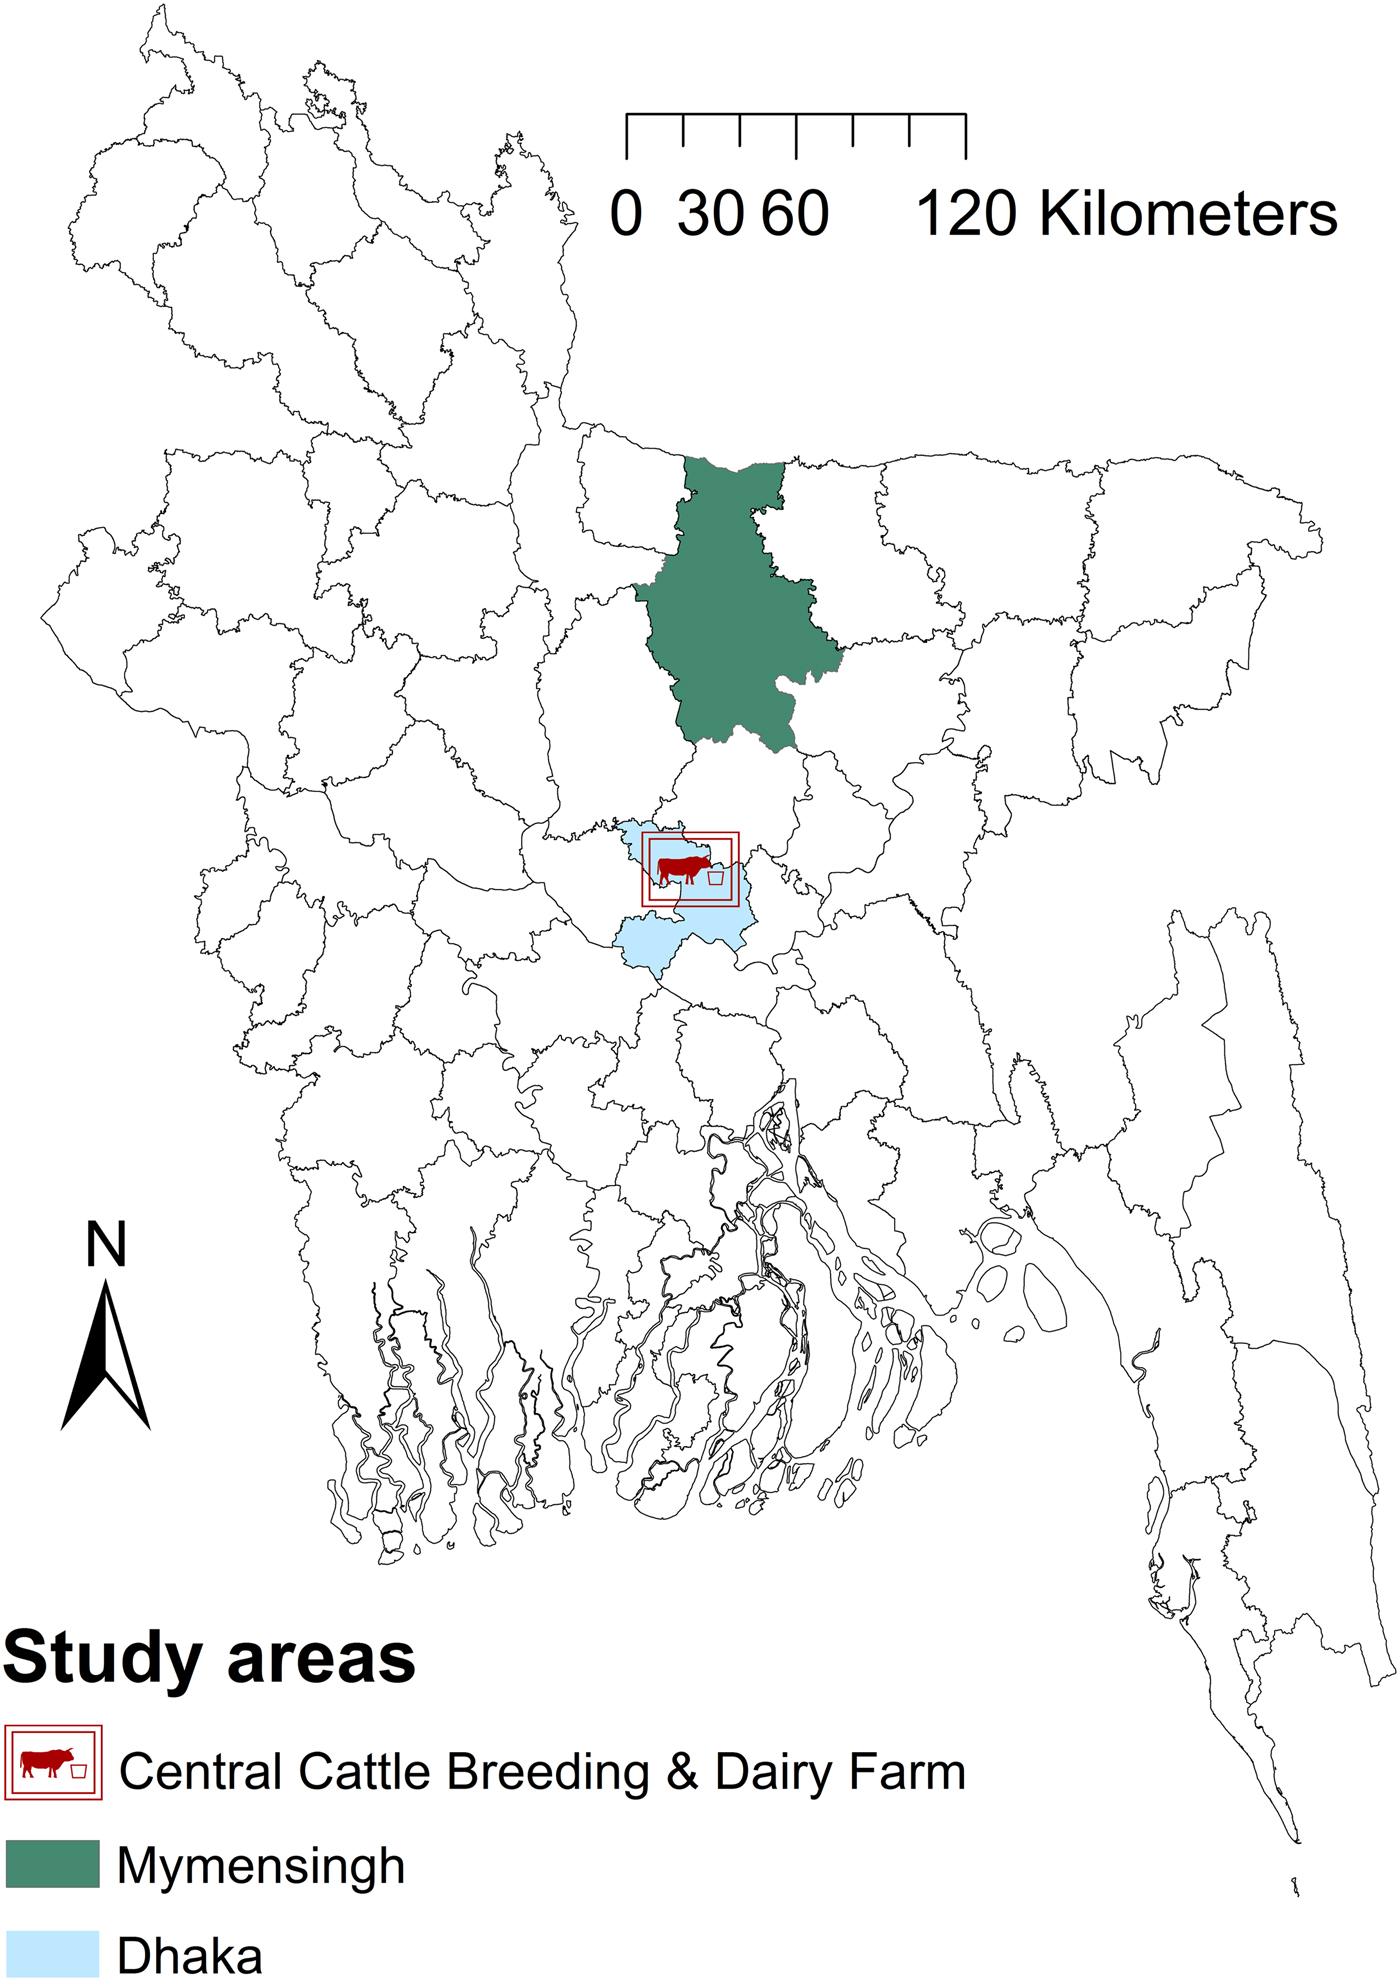
Fig. 1. Map of Bangladesh showing the areas included in a study of brucellosis test performance.
GF is the largest farm (n = 2500) in Bangladesh established to produce crossbred heifers and bulls, collect semen from tested bulls to support the national artificial insemination (AI) programme and to supply milk to Dhaka city. Holstein Friesian and Sahiwal breeds are mainly used for semen production. Cattle management is intensive and only AI is used for reproduction. The cattle management system in MD is small-scale dairy with traditional crop-based subsistence management systems; zero grazing (‘cut-and-carry system’) is mainly practiced, with occasional tethering. The common breeds are indigenous and their crosses with Holstein Friesian and Sahiwal. Both AI and natural service are practiced for reproduction. The study was conducted between September 2007 and August 2008. Vaccination against brucellosis has not been initiated in any livestock species in Bangladesh. The study protocol was approved by the Faculty of Veterinary Science of Bangladesh Agricultural University (01/2007/EB/FVS). Oral consent of farm owners was obtained prior to the collection of blood samples from their cattle. Cattle of MD and the GF were our study populations and cattle of other districts (except dairy intensive regions) and organised farms were our target populations. The response rate of farmers in MD was 100% and the study population and the target population are similar in terms of management.
Study design and sample size
A cross-sectional study was conducted in the MD of Bangladesh. There is no livestock databank in Bangladesh. A map of MD was digitised (ArcView Version 3.2, Environmental Systems Research Institute, Inc., Redlands, California). Of 146 unions (sub Upa-Zilla, where Upa-Zilla is a subdistrict) in MD, 28 were randomly selected. One geographical coordinate was randomly selected from each selected union and located by a hand-held global positioning system reader. Livestock farmers within 0.5 km of the selected point were informed about the survey [Reference Cringoli15]. All cattle in a selected farm were sampled. The sample size was calculated using the formula given in equation (1) [Reference Dohoo, Martin and Stryhn16]:
 $$\displaystyle{{{1.96}^2 \times P_{{\rm Exp}} \times (1-P_{{\rm Exp}})} \over {d^2}}$$
where P Exp = expected prevalence = 4.8% (median of previously reported prevalence for the smallholder system) and d = precision = 1.5% [Reference Pourhoseingholi, Vahedi and Rahimzadeh17]. These assumptions produce a sample size of 780. As cluster sampling was used, the design effect (D) of the study was calculated using the formula [Reference Bennett18]:
 $$\; D = 1 + (b-1)\,\rho \; $$
where b is the average number of samples per cluster (3) and ρ is the intra-cluster correlation coefficient. The intra-cluster correlation coefficient for B. abortus infection was reported to be 0.09 [Reference Otte and Gumm19]. The design effect was therefore calculated to be D = 1.2; when multiplied by the calculated sample size, this produced a minimum required sample size of 936. To allow for samples unsuitable for testing, a total of 1020 cattle were sampled.
Blood samples were collected at the GF, including all breeding bulls and a systematic sample of cows (every 10th cow). In addition, a questionnaire designed to collect animal and herd level data was administered during blood sampling of each herd.
Sample processing and testing
About 5–7 ml of blood was collected from each animal by jugular venipuncture with disposable needles and Venoject tubes, labelled and transported to the laboratory on ice (after clotting) within 12 h of collection. Samples were kept refrigerated (2–8 °C) and the following day sera were separated by centrifuging at 699 g for 10 min. Sera were stored at −20 °C. Each serum was divided (1–1.5 ml); one aliquot was used for testing and the other was preserved in a serum bank.
All sera were tested in parallel using iELISA, SAT and RBT. These were chosen based on availability, and rapid and easy use within the Bangladesh context. Moreover, simultaneous use of these three tests helps identify acute and chronic cases of brucellosis. The presence of only immunoglobulin G (IgG) indicates chronic brucellosis whereas the presence of both IgG and IgM indicate acute brucellosis [Reference Godfroid, Nielsen and Saegerman20].
The iELISA was performed according to Limet et al. [Reference Limet21] using B. abortus biotype 1 (Weybridge 99) S-lipopolysaccharide (Brucella smooth lipopolysaccharide) as the antigen. A detailed description of the method can be found in Rahman et al. [Reference Rahman22]. The cut-off value for a positive result was set to 5 IU/ml [Reference Rahman23] of test serum in MD and 12.5 IU/ml in GF [Reference Smit24] in the Bangladesh context. The RBT was performed as described by Alton et al. [Reference Alton12]. The procedure has been described in detail in a previous paper by Rahman et al. [Reference Rahman22]. The result was considered positive when agglutination was noted after 4 min. The SAT was carried out with ethylene diamine tetra acetic acid as described by Garin et al. [Reference Garin, Trap and Gaumont25]. Reading was performed on the basis of degree of agglutination and expressed in international units (IU). Any serum with an antibody titre greater than or equal to 30 IU/ml, as prescribed by the EU [Reference Shey-Njila26], was considered positive. Those performing the tests were blinded to the results of the other tests.
Bayesian latent class analysis
A Bayesian analysis framework was used in OpenBUGS [Reference Spiegelhalter27] and R 3.3.1 (The R Foundation for Statistical Computing, Vienna, Austria) to estimate the diagnostic accuracy of the three tests and the true prevalence of infection in the two subpopulations. An important consideration in the evaluation of multiple diagnostic tests is the assumption of conditional independence between tests, given the true disease status. Two tests are considered to be conditionally independent if the sensitivity or specificity of one test does not depend on the results of the other test.
As fully explained in Berkvens et al. [Reference Berkvens28], converting apparent prevalence into true prevalence requires one to solve a system of over-parameterised equations. This invariably requires the input of external (prior) information, either in the form of prior estimates of test sensitivity or test specificity, or in the form of some hypothesis such as conditional independence of tests or constancy of test characteristics across different populations. Several solutions have been proposed, from the Hui and Walter [Reference Hui and Walter29] model based on two conditionally independent diagnostic tests applied in two populations with sensitivity and specificity constant over the two populations, to the fully parameterised models proposed by e.g. [Reference Berkvens28, Reference Gardner30]. We used an extension of the conditional dependence model described by Gardner et al. [Reference Gardner30] for three tests considering constancy of test characteristics in two populations.
Definition of infection status
Bayesian latent class models create their own probabilistic definition of infection that depends on what analyte the tests actually detect (e.g. organisms or immune responses to organisms). This definition of the infection status must be interpreted and communicated from a biological perspective [Reference Kostoulas31].
In this study, all tests detect the humoral response of the host: iELISA detects only IgG antibodies, whereas RBT detects mainly IgG antibodies (though also detects IgM and IgA) and SAT detects mainly IgM (but also detects IgG and IgA). Hence, the latent infection under consideration is unambiguous and defined as the presence and persistence of Brucella within an animal long enough to produce a detectable humoral immune response at any time during their life.
Modelling conditional dependence
Let pr 1 and pr 2 be the true prevalence in MD and the GF respectively, and T 1,T 2 and T 3 represent the test outcomes for iELISA, RBT and SAT, respectively, with positive test outcomes represented by 1 (or +) and negative test outcomes by 0 (or −). Sensitivities and specificities are denoted by Se and Sp. The covariances between iELISA and RBT, between iELISA and SAT, between RBT and SAT and among iELISA, RBT and SAT in infected cattle are denoted by a 12, a 13, a 23, a 123 and in non-infected cattle by b 12, b 13, b 23, b 123, respectively. The probability of an animal from the first population (MD) testing positive in three tests is given in equation (3):
 $$\eqalignb{P_r(111) = &P_r(T_1^ +, T_2^ +, T_3^ + ) = pr_1(Se_{\rm E LISA} Se_{\rm RBT} Se_{\rm SAT} \cr &+ Se_{\rm ELISA} a_{23} + Se_{\rm RBT} a_{13} + Se_{\rm SAT} a_{12} + a_{123} ) \cr & + (1-pr_1)[(1-Sp_{\rm ELSIA} )(1-Sp_{\rm RBT} )(1-Sp_{\rm SAT} ) \cr & + (1-Sp_{\rm ELISA} )b_{23} + (1-Sp_{\rm RBT} )b_{13} \cr &+ (1-Sp_{\rm SAT} )b_{12} -b_{123} ]} $$
The multinomial cell probabilities for the other combinations in the first population – as well as in the second population (GF) – are calculated in a similar manner (see Supplementary file 1 for details).
The upper and lower limits of the sensitivity covariance between iELISA and RBT (i.e. a 12) are derived from the following probabilities given in equation (4):
 $$\max [-(1-Se_{{\rm ELISA}})\,(1-Se_{{\rm RBT}}),-Se_{{\rm ELISA}}Se_{{\rm RBT}}] \le a_{12} \le {\rm min[}Se_{{\rm ELISA}}(1-Se_{{\rm RBT}}),(1-Se_{{\rm ELISA}})\,Se_{{\rm RBT}}]$$
The other covariances between two tests and among three tests are calculated in a similar manner (see Supplementary file 1 for details).
To minimise the dependency of the model estimates on the specified prior information we adopted a semi-dependent model [Reference Kostoulas32] that reduced the number of parameters to be estimated. Specifically, the covariances of the tests in non-infected cattle (i.e. the dependencies between the Sps of the tests) were forced to be zero. A trade off exists between modelling accurately all dependencies, which leads to loss of identifiability, and the number of parameters to be estimated within the model. Hence, it is recommended to drop dependence terms with minimal impact on the final estimates [Reference Kostoulas31] so as to reduce the dependency of the model estimates on prior information. Based on the existing literature, the Sps of the tests were expected to be high and close to unity [Reference Abernethy33]. Hence, omitting the dependencies among Sps of highly specific tests has a minimal impact on the estimated parameters. Moreover, the covariances among the tests in infected cattle (i.e. the dependencies between the Ses of the tests) were forced to be positive to capture the biologically plausible assumption that tests based on the same biological principle have positively rather than negatively correlated results. The OpenBUGS model code used to estimate true prevalence and characteristics of the diagnostic tests is provided in Supplementary file 1.
Prior information on test characteristics
The external (prior) information was generated through meta-analysis by the ‘metandi’ [Reference Harbord and Whiting34] command in Stata 13.1 (Statistical Software: Release 13, College Station, TX, USA) using the results published in the following references: iELISA [Reference Abernethy33, Reference Van Aert35–Reference Saegerman39]; RBT [Reference Abernethy33, Reference Van Aert35, Reference Samartino38, Reference Dajer40–Reference Muma42] and SAT [Reference Abernethy33, Reference Van Aert35, Reference Stemshorn43, Reference Lord, Rolo and Cherwonogrodzky44]. A brief description of the meta-analysis based on the cited references is given in Supplementary file 3.
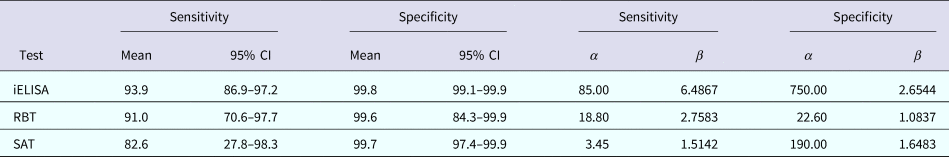
β distributions were used as priors for the parameters of interest (Ses, Sps and prevalences). A uniform prior distribution in the range 0–1 was chosen for both prevalences and sensitivity of SAT, β(1, 1). β distributions for the priors on Ses and Sps of three tests (Table 1) were calculated using the ‘betaExpert’ function of the package ‘prevalence’ [Reference Devleesschauwer45] in R 3.3.1.
Table 1. Summary values of the meta-analysis estimation of characteristics and corresponding β distribution parameters for three serological tests for detection of Brucella antibodies
CI, confidence interval.
Prior information on the four covariance parameters (for infected cattle) were not available and were generated in R 3.3.1 based on the range of possible values of the sensitivities and specificities listed in Table 1 (see Supplementary file 1).
Sensitivity analysis
To assess the influence of prior information [Reference Arif13] on the estimates of the model parameters three additional, different sets of prior information were considered: (a) uniform priors in the range 0 to 1 for Ses and Sps (i.e. β(1,1) distribution); (b) uniform priors in the range 0–1 for Sps and the informative priors for Ses used for the primary analysis and (c) uniform priors in the range 0–1 for Ses and the informative priors for Sps used for the primary analysis.
Model implementation
The model was run with a burn-in period of 50 000 iterations and estimates were based on a further 50 000 iterations using three chains. Model selection proceeded according to the method described in Berkvens et al. [Reference Berkvens28], making use of Deviance Information Criterion (DIC), pD and Bayes-p. Moreover, the convergence of the model was also assessed by time-series plots, Gelman Rubin convergence diagnostics, autocorrelation plots and Monte Carlo standard errors [Reference Gelman and Rubin46].
Adherence to the STARD-BLCM guidelines
For this study, we followed the STARD-BLCM reporting guidelines on the design, conduct and results of diagnostic accuracy studies (see Supplementary file 2) that use Bayesian latent class models [Reference Kostoulas31].
Results
Descriptive statistics
Mymensingh district (MD)
A total of 1020 cattle were subjected to the three serological tests in MD. Most (86% and 70%) of the cattle in MD were indigenous and female, respectively. The median age was 3 years (interquartile range (IQR), 1.5 to 6 years). The median body weight of cattle was 90.0 kg (IQR 50.0 to 120.0 kg). The herd size ranged from 1 to 11 with a median of two animals. Most (74%) of the herds consisted of only one, two or three cattle. Only one herd had more than 10 cattle. The average herd level apparent prevalence of brucellosis observed in the MD of Bangladesh was 2.48% (9/362).
Government dairy farm (GF)
In the GF, 340 sera samples (including 89 from breeding bulls) were tested by three serological tests (Table 2). The median age of cattle was 4 years (IQR 3 to 8 years). Most (88% and 64%) of the GF cattle were cross-bred and female, respectively. The median body weight of cattle was 200 kg (IQR 152 to 353 kg).
Table 2. Cross-classified test results for brucellosis in cattle in Mymensingh district (MD) and Government dairy farm (GF) of Bangladesh
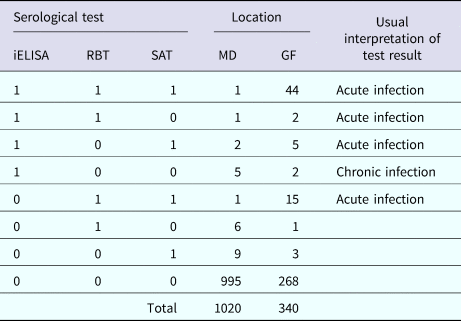
iELISA, indirect enzyme-linked immunosorbent assay; RBT, Rose Bengal test; SAT, slow agglutination test.
Serological results
Table 2 shows the numbers of animals that tested positive in the three tests. Only 6.1% (22/362) of herds from MD were serologically positive to at least one of the three tests (one animal and two animals positive per herd in 19 and 3 herds, respectively). Only 0.49% (5/1020) of cattle were both acutely and chronically infected in MD, and about 2.5% (25/1020) of cattle were positive in at least one serological test. The apparent prevalences were 0.9% (9/1020) based on iELISA and RBT, and 1.3% (13/1020) based on SAT.
In the GF, 19.4% (66/340) of cattle were acutely infected with brucellosis and only 0.6% (2/340) of cattle were chronically infected. About 21.2% (72/340) of cattle were positive in at least one serological test in the GF. The apparent prevalence was 15.6% (53/340), 18.2% (62/340) and 19.7% (67/340) based on iELISA, RBT and SAT, respectively.
Meta-analysis
Table 1 summarises the results of the meta-analysis and the corresponding parameters for the respective prior β distributions.
Characteristics of diagnostic tests and true prevalence
The posterior estimates of true prevalence, sensitivity, specificity and sensitivity covariances of diagnostic tests are provided in Table 3. The true estimated prevalence of brucellosis among cattle in MD and the GF were 0.6% (95% confidence interval (CI) 0.2–1.2) and 20.4% (95% CI 16.2–24.8), respectively. The covariance between RBT and SAT – in infected cattle – was 14.3%. The positive predictive value (PPV) and negative predictive value (NPV) of iELISA, RBT and SAT for the diagnosis of bovine brucellosis in Bangladesh are presented in Table 4. Table 5 presents the sensitivity, specificity, PPV, NPV and performance index of serial (an animal is considered positive if it is positive in all tests) and parallel (an animal is considered positive if it is positive in at least one test) interpretation of test combinations for the diagnosis of bovine brucellosis in Bangladesh. Serial interpretation of iELISA and SAT and RBT and SAT yielded the highest PPV (99.9%) in the GF. The highest PPV (99.2%) was observed for serial interpretation of iELISA and RBT in MD. Whereas, the parallel interpretation of iELISA and SAT, iELISA and RBT and RBT and SAT in MD yielded very high NPVs (99.9%). In GF, the parallel interpretation of iELISA and SAT produced the highest NPV (99.6%). The performance indices varied from 1.75 to 1.97.
Table 3. Posterior estimates of prevalence (%) of brucellosis, sensitivity, specificity and sensitivity covariances of iELISA, RBT and SAT at MD and GF, Bangladesh
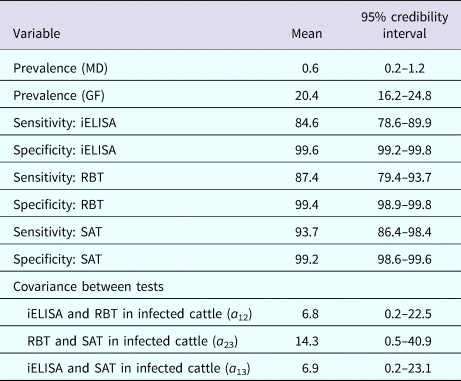
Table 4. Positive and negative predictive values of iELISA, RBT and SAT for the diagnosis of bovine brucellosis at MD and GF, Bangladesh
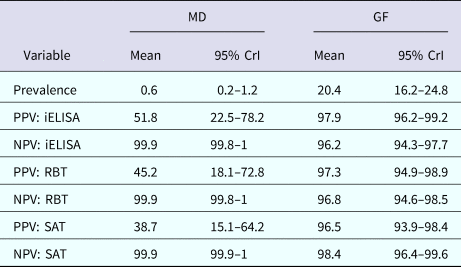
PPV, positive predictive value; NPV, negative predictive value; MD, Mymensingh district; GF, Government farm; CrI, credibility interval.
Table 5 Sensitivity, specificity, PPV, NPV and performance index of serial and parallel interpretation of test combinations for the diagnosis of bovine brucellosis in Bangladesh
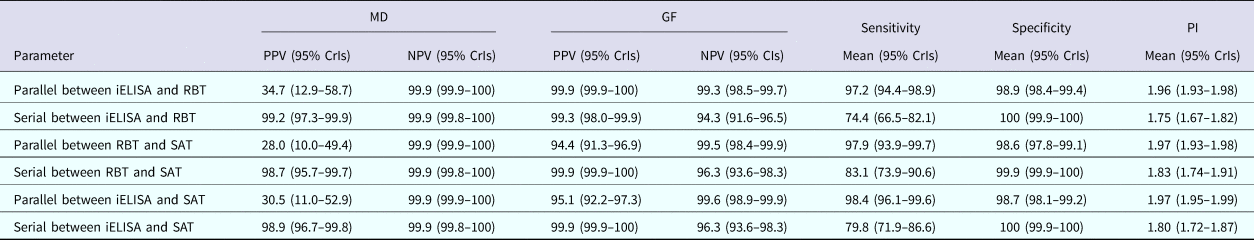
PI, performance index (sensitivity + specificity).
Sensitivity analysis
The results of the sensitivity analysis are presented in Table 6. The posterior specificity estimates for the three tests and sensitivity estimates of RBT and SAT were similar. As expected the influence of specified prior information on the posterior estimates for the sensitivity of the iELISA was minor (Tables 3 and 6).
Table 6. Se and Sp estimates under alternative prior specifications (sensitivity analysis)

Discussion
We estimated the performance of three serological tests for the diagnosis of bovine brucellosis in Bangladesh. Such information is needed by clinicians and decision-makers in the context of clinical diagnoses or quantitative risk assessments, as well as for prevalence estimation or risk factor studies [Reference Alton12]. This information is also critical for designing control programmes to reduce brucellosis in cattle and indirectly in humans as a public health risk.
Serial interpretation of the iELISA-SAT produced the highest PPV in GF and high PPV in MD (i.e. decreased false positive results). A higher probability of being diseased given a test positive result is helpful for culling decisions. In contrast, parallel interpretation of iELISA and SAT yielded highest NPV in both MD and the GF (i.e. minimised false negative results). A higher probability of being healthy given a test negative result is helpful in import decisions [Reference Arif13]. Based on study results and brucellosis biology (discussed below), we recommend the combined use of IgG iELISA and SAT and their serial or parallel interpretation depending on the intended use: culling or import decisions, respectively.
The benefit of using SAT is that it can detect IgM antibody. Simultaneous presence of IgM and IgG indicates acute brucellosis; IgG alone is an indication of chronic brucellosis [Reference Godfroid, Nielsen and Saegerman20]. The simultaneous use (one serum is tested by both tests) and serial interpretation of SAT and IgG iELISA helps define the stage of brucellosis in animals. We found that 0.49% and 19.4% cattle were acutely infected with brucellosis in MD and the GF, respectively. Culling of these acutely infected cattle will reduce the spread of infection in cattle populations and thereby risk of brucellosis in humans.
We estimated the true prevalence of brucellosis applying multiple tests in parallel on blood samples from cattle in Bangladesh. This is an essential piece of information for decision makers before implementing prevention and control measures. We estimated – via a Bayesian analysis framework – the prevalence of brucellosis in cattle in MD and the GF to be 0.6% (95% CI 0.2–1.2) and 20.4% (95% CI 16.2–24.8), respectively. Estimated true prevalence in MD is even lower than the lower limit of previous apparent prevalence estimates, which ranged from 1.1% to 10.6% [Reference Islam8]. The smaller sample size, non-randomness of sample collection and types and interpretation of tests used may be responsible for the great variation in prevalences estimated in previous studies (e.g. 9.7% estimated by Ahasan et al. [Reference Ahasan9]).
In Bangladesh, indigenous cattle are reared in a subsistence management system whereas in commercial management systems mostly cross-bred cattle are maintained. The prevalence of brucellosis is reported to be significantly higher in the commercial production system [Reference Islam8]. This is also supported by our data: most (86%) cattle in this study (in MD) are indigenous breed, reflecting the general breed distribution in Bangladesh. Farmers are aware of the disease and cows showing signs suggestive of brucellosis are usually sold to butchers. Moreover, around 3.5 million cattle are slaughtered annually in Bangladesh, about 40% during the festival of Eid-ul-Azha [47]. During this mass slaughter, the carcasses of animals infected with brucellosis may be removed from the population, partially explaining the very low prevalence in subsistence management systems such as in MD. As a result of the shorter life span of animals, there is a lower risk of Brucella transmission in this population because this disease is most common in sexually mature animals [Reference Lopes, Nicolino and Haddad48, Reference Godfroid49]. In addition, the small size of the herds in MD might also be responsible for lower prevalence of brucellosis [Reference Al-Majali50]. In such a low prevalence situation, test and slaughter policies to control brucellosis can be successfully implemented [Reference Hegazy, Ridler and Guitian51].
The prevalence in the GF exceeds the upper limit of the previous prevalence reports. There might be several reasons, including larger herd size, irregularly/not testing cattle, high proportion of cross-breed cattle, recent cattle introductions without proper testing and the sole use of AI at the GF. AI using semen from brucellosis infected bulls can spread disease [Reference Rahman6, Reference Chiebao52].
In Bangladesh the main source of human brucellosis is occupational, rather than foodborne [Reference Seleem, Boyle and Sriranganathan2]. Recommendations to use vaccines against brucellosis in Bangladesh for the first time in herds in which the prevalence is very high (as in the largest GF) should be made with caution. Vaccines such as S19 can interfere with serological diagnosis, can induce abortion if administered during pregnancy and S19 strain also infects humans [Reference Olsen and Tatum53]. The RB51 vaccine does not induce antibody responses that are detected by conventional brucellosis serologic tests. However, this vaccine can induce abortion, infects humans [Reference Olsen and Tatum53] and this vaccine strain is resistant to rifampicin, a widely used antibiotic in the treatment of human brucellosis [Reference Ariza54]. Therefore, we do not recommend the introduction of vaccine for brucellosis in Bangladesh at this time. More studies are needed to determine the status (and prevalence) of brucellosis in commercial dairy farms.
The model we used is non-identifiable because the degrees of freedom in the data are fewer than the parameters to be estimated. Hence some of our estimates depend on the specified priors; a fact that was also indicated from the change in the posterior estimates (especially the Se of iELISA) under alternative priors. That is why – as is the case with any non-identifiable model – the sound justification for the selection of priors is imperative [Reference Kostoulas31].
One study limitation might be that findings do not represent the brucellosis status in dairy intensive regions of Bangladesh. We have assumed that the prevalence in farms of MD is similar because the cattle herd size and management practice in MD are similar. Brucellosis is endemic in MD, and currently there is no control programme in place. Thus, MD farms are expected to fall within the same prevalence ‘window’ and the distribution of the infection stages between these farms is expected to be similar. Another issue is the size of the sample we have chosen for Bayesian analysis. There is no unique way to estimate sample size requirements under Bayesian analysis and especially for these types of models. Most methods adopt a case-specific stochastic simulation approach and required sample sizes also depend on the existing information that will be incorporated as priors. Hence, it is often an iterative approach that cannot be specified a priori. Standard formulas for prevalence estimation – as the one used here – generally produce larger sample sizes and are more transparent for the broader audience. Hence, their use here but in other similar papers.
In Bangladesh, bovine brucellosis in small-scale dairy and subsistence management systems appears to be controlled naturally without any directed control measures. Simultaneous use and serial and parallel interpretation of iELISA and SAT help culling and animal importation decisions, respectively. Surveillance in conjunction with a test-and-cull approach will reduce the prevalence of brucellosis in commercial dairy farms even in a resource poor setting. Controlling brucellosis in animals and increasing awareness of risk factors for human brucellosis might also reduce the level of exposure and thereby the disease.
Supplementary material
The supplementary material for this article can be found at https://doi.org/10.1017/S0950268818003503.
Author ORCIDs
Brecht Devleesschauwer, 0000-0002-2867-6892 and Michael Ward, 0000-0002-9921-4986.
Acknowledgements
The authors are grateful to the farmers who participated in this study and provided data and samples.
Financial support
This work was supported by Belgian Development Cooperation as a PhD scholarship for the first author.
Conflict of interest
None.


 Open access