


Introduction
The single largest repository of biodiversity and biomass carbon on Earth is the Amazon forest, still covering almost 5.3 million km2 and representing a uniquely large and relatively contiguous tropical forest (Aragão et al. Reference Aragão, Poulter, Barlow, Anderson, Malhi and Saatchi2014). Around the margins of Amazonia are additional, distinctive global biodiversity centres with endemic biota and conservation challenges (Myers et al. Reference Myers, Mittermeier, Mittermeier, da Fonseca and Kent2000). Amazonia holds significant remaining terrestrial biodiversity, provides ecosystem services and economic goods (Gardner et al. Reference Gardner, Barlow, Chazdon, Ewers, Harvey, Peres and Sodhi2009) and contributes to the regulation of ecosystem functions such as South American and global hydrological cycles, climates and carbon storage (Aragão et al. Reference Aragão, Poulter, Barlow, Anderson, Malhi and Saatchi2014).
Amazonia carbon storage (e.g., Malhi et al. Reference Malhi, Wood, Baker, Wright, Phillips and Cochrane2006) and net carbon sinks (e.g., Phillips & Brienen Reference Phillips and Brienen2017) are at risk due to environmental change. The evidence of a multi-decadal biomass carbon sink from ground-based measurements (e.g., Phillips et al. Reference Phillips, Malhi, Higuchi, Laurance, Nunez and Vasquez1998, Pan et al. Reference Pan, Birdsey, Fang, Houghton, Kauppi and Kurz2011) and atmospheric analyses (e.g., Stephens et al. Reference Stephens, Gurney, Tans, Sweeney, Peters and Bruhwiler2007) indicates a long-term decline in the rate of net carbon accumulation into Amazon biomass (Brienen et al. Reference Brienen, Phillips, Feldpausch, Gloor, Baker and Lloyd2015). The mechanisms related to this decline involve both shortening carbon residence times due to increased mortality rates and levelling off of growth rate increases (Brienen et al. Reference Brienen, Phillips, Feldpausch, Gloor, Baker and Lloyd2015). These long-term basin-wide changes are consistent with drought sensitivity and multiple anthropocentric environmental threats (Phillips et al. Reference Phillips, Aragao, Lewis, Fisher, Lloyd and Lopez-Gonzalez2009, Aragão et al. Reference Aragão, Poulter, Barlow, Anderson, Malhi and Saatchi2014, Gatti et al. Reference Gatti, Gloor, Miller, Doughty, Malhi and Domingues2014, Anderson et al. Reference Anderson, Aragão, Gloor, Arai, Adami and Saatchi2015). Nevertheless, the potential impact of climate change and its interaction with anthropogenic disturbances (e.g., fragmentation and fire) on South American forests remains highly uncertain (Aragão et al. Reference Aragão, Poulter, Barlow, Anderson, Malhi and Saatchi2014, Tollefson Reference Tollefson2016), and how these ecosystems will feed back on climate change is poorly understood (e.g., Davidson et al. Reference Davidson, de Araújo, Artaxo, Balch, Brown and Bustamante2012, Aragão et al. Reference Aragão, Poulter, Barlow, Anderson, Malhi and Saatchi2014).
Regionally, recent droughts and fire have especially impacted forests at the southern Amazon border (Brienen et al. Reference Brienen, Phillips, Feldpausch, Gloor, Baker and Lloyd2015, Doughty et al. Reference Doughty, Metcalfe, Girardin, Amézquita, Cabrera and Huasco2015, Feldpausch et al. Reference Feldpausch, Phillips, Brienen, Gloor, Lloyd and Lopez-Gonzalez2016), which have experienced four major droughts over the past two decades allied to abnormalities such as El Niño and other extreme climatic events (Anderson et al. Reference Anderson, Aragão, Gloor, Arai, Adami and Saatchi2015). Thus, before the 2005 drought, long-term monitoring of permanent forest plots indicated significant accumulation of carbon in forest biomass in the order of 0.45 MgC ha–1 year–1 (Phillips et al. Reference Phillips, Aragao, Lewis, Fisher, Lloyd and Lopez-Gonzalez2009). The decline in the net sink in the last decade has been linked to the increasing frequency of droughts, especially in the south (Phillips & Brienen Reference Phillips and Brienen2017), accompanied by enhanced fire-mediated carbon emission with land-use intensification (Anderson et al. Reference Anderson, Aragão, Gloor, Arai, Adami and Saatchi2015).
Recent climate trends (e.g., Jiménez-Muñoz et al. Reference Jiménez-Muñoz, Mattar, Barichivich, Santamaría-Artigas, Takahashi and Malhi2016) and climate model projections (e.g., Chen et al. Reference Chen, Morton, Andela, Giglio and Randerson2016) indicate more frequent and intense droughts with hotter dry seasons in southern Amazonia interacting synergistically with fire (Brando et al. Reference Brando, Balch, Nepstad, Morton, Putz and Coe2014, Aragão et al. Reference Aragão, Anderson, Fonseca, Rosan, Vedovato and Wagner2018). During the 2010 drought, for instance, up to c. 13 000 km2 or c. 4.5% of the remaining pristine old growth forest and 60 000 km2 or c. 28% of remaining Brazilian Cerrado burned in Mato Grosso, releasing c. 56 Tg of carbon into the atmosphere according to analysis of multi-temporal satellite-derived data (Anderson et al. Reference Anderson, Aragão, Gloor, Arai, Adami and Saatchi2015).
The extensive Amazon–Cerrado Transition Zone (hereafter, ZOT) supports a wide range of different vegetation types, including savanna and various forest formations (Ratter et al. Reference Ratter, Richards, Argent and Gifford1973, Marimon et al. Reference Marimon, Duarte, Chieregatto and Ratter2006, Marimon et al. Reference Marimon, Marimon-Junior, Feldpausch, Oliveira-Santos, Mews and Lopez-Gonzalez2014). Understanding the transitions in vegetation structure and composition here has been the focus of several recent studies (e.g., Marimon et al. Reference Marimon, Duarte, Chieregatto and Ratter2006, Marimon et al. Reference Marimon, Marimon-Junior, Feldpausch, Oliveira-Santos, Mews and Lopez-Gonzalez2014, Morandi et al. Reference Morandi, Marimon, Eisenlohr, Marimon-Junior, Oliveira-Santos and Feldpausch2016), with soil properties, fragmentation, frequency of fire, and local water supply all playing a role (e.g., Brando et al. Reference Brando, Balch, Nepstad, Morton, Putz and Coe2014, Veenendaal et al. Reference Veenendaal, Torello-Raventos, Feldpausch, Domingues, Gerard and Schrodt2015). While the ZOT has experienced more frequent droughts in the last two decades (Anderson et al. Reference Anderson, Aragão, Gloor, Arai, Adami and Saatchi2015), lack of long-term monitoring here has prevented an evaluation of their ecosystem impacts. The ZOT also lies within the ‘arc of deforestation’, where the new agricultural frontiers that opened in the late twentieth century continue to advance and consolidate (Morandi et al. Reference Morandi, Marimon, Eisenlohr, Marimon-Junior, Oliveira-Santos and Feldpausch2016). It is plausible that the interactive outcome of drought intensity, deforestation and burning at the ZOT will intensify tree mortality and carbon release to the atmosphere (Anderson et al. Reference Anderson, Aragão, Gloor, Arai, Adami and Saatchi2015), with unpredictable feedbacks on regional and global climate change (e.g., Nepstad et al. Reference Nepstad, Stickler, Soares-Filho, Merry, Alencar and Nepstad2008, Nobre et al. Reference Nobre, Sampaio, Borma, Castilla-Rubio, Silva and Cardoso2016).
A key conservation challenge within the ZOT, therefore, is to understand the current trajectory of ecosystem change and which factors may help – or hinder – efforts to protect remaining ecosystems. While forests in the ZOT are exceptionally dynamic and variable compared to other forests in Amazonia and beyond in the tropics (Phillips et al. Reference Phillips, Hall, Gentry, Sawyer and Vasquez1994, Marimon et al. Reference Marimon, Marimon-Junior, Feldpausch, Oliveira-Santos, Mews and Lopez-Gonzalez2014), and in spite of modelling and experimental work on the drivers of vegetation dynamics in the ZOT (e.g., Hirota et al. Reference Hirota, Nobre, Oyama and Bustamante2010, Dionizio et al. Reference Dionizio, Heil Costa, de Almeida Castanho, Ferreira Pires, Schwantes Marimon and Hur Marimon-Junior2018, Silverio et al. Reference Silvério, Brando, Bustamante, Putz, Marra, Levick and Trumbore2019), there has been little attempt to actually assess on the ground how remaining vegetation here has fared. However, a state-wide network of monitoring plots capable of assessing ecosystem functions and change in relation to environmental impacts is now available in the ZOT of Mato Grosso (Marimon et al. Reference Marimon, Marimon-Junior, Feldpausch, Oliveira-Santos, Mews and Lopez-Gonzalez2014, Morandi et al. Reference Morandi, Marimon, Eisenlohr, Marimon-Junior, Oliveira-Santos and Feldpausch2016). Plots with up to a decade or more of careful tree-by-tree records from across the region provide an opportunity to track and analyse forest responses to the changing environment. Here, we attempt to analyse for the first time whether forests here have actually accumulated biomass and to explore the likely environmental drivers of changes, with a particular focus on the threats of fire and drought, as well as the potential for forests with local riverine water sources to mitigate these threats.
Our approach involves evaluating the stocks, net balance and gross fluxes of biomass among the forest ecosystems in the ZOT, both as a whole and when analysed at the level of different vegetation types. We hypothesize that forests here have gained biomass, in parallel with other parts of Amazonia (Brienen et al. Reference Brienen, Phillips, Feldpausch, Gloor, Baker and Lloyd2015), but that there will be significant variation in carbon balance between forest types (Brienen et al. Reference Brienen, Phillips, Feldpausch, Gloor, Baker and Lloyd2015, Flores et al. Reference Flores, Holmgren, Xu, van Nes, Jakovac, Mesquita and Scheffer2017). In particular, we expected that this will be related to the distinctive susceptibility of vegetation types to fire in the ZOT, as occurs elsewhere in Amazonia (Flores et al. Reference Flores, Holmgren, Xu, van Nes, Jakovac, Mesquita and Scheffer2017). Furthermore, given that the ZOT is climatically susceptible to moisture deficiencies, we expect riparian forests to behave differently from upland formations – either losing biomass over time as a consequence of greater sensitivity to the impacts of drought and fire (e.g., Flores et al. Reference Flores, Holmgren, Xu, van Nes, Jakovac, Mesquita and Scheffer2017) or gaining it if their locally enhanced water supply mitigates these threats. In summary, we aimed to: (1) estimate the long-term biomass change rate; (2) determine the extent to which forest changes are influenced by forest type and fire; and (3) use these results to evaluate drivers of biomass change and to assess the threat to forests from upcoming environmental change in the ZOT.
Methods
Study Area
Our study is based on forest in the ZOT between Amazon and Cerrado in eastern Mato Grosso (Brazil). Vegetation inventories were conducted from as early as 1996 to as recently as 2016, with most censuses occurring between 2007 and 2016. Among the 30 permanent monitoring plots, 18 represent terra firme (upland forest) and 12 riparian forests, and each was sampled at least twice between 1996 until 2016 (Supplementary Table S1, available online). The plots span 1200 km of spatial extent in the ZOT (Supplementary Fig. S1). The climate in our study area varies from typical savanna (Aw), with a rainy summer and a dry winter, to wet tropical monsoon (Am) according to the Köppen classification (Peel et al. Reference Peel, Finlayson and McMahon2007, Alvares et al. Reference Alvares, Stape, Sentelhas, De Moraes Gonçalves and Sparovek2013). Average annual precipitation varies from 1508 to 2353 mm, and average temperature from 24.1°C to 27.3°C.
Our data set represents the most complete, standard and systematic information yet acquired from permanent monitoring of different vegetation types in any neotropical forest–savanna transition zone. It includes a range of phytophysiognomies – riparian forests, flooded forests (known locally as ‘impucas’), seasonal perennial forests, seasonal deciduous forests, open ombrophyllous evergreen forests, monodominant forests and cerradão forests. We classified each forest plot according to association with water courses, including riparian and floodplain forest as one category and all upland forests as another (hereafter, riparian and terra firme, respectively). We also recorded the occurrence of burning events for comparative analysis of dynamics of aboveground biomass (AGB). Burning evidence was identified at each census by field observation of fire scars and burned stems, and any damage and death due to fire was recorded during the census. Burning events were observed at least once in eight riparian forests, while four of them did not burn. On the other hand, fire occurred only in one upland cerradão forest.
In each plot, vegetation was sampled in 25 subplots of 20 × 20 m each, totalling 1 ha, with some minor exceptions (Supplementary Table S1). All trees were identified, tagged with a specific number and measured in terms of their diameter following standard RAINFOR protocols (Phillips et al. Reference Phillips, Baker, Feldpausch and Brienen2010), representing more than 20 000 trees in the 30 ZOT plots. The average number of censuses per plot was 3.2 (range: 2–8). Species were identified based on voucher collection and direct expert observation, and all names were checked for synonymy according to Brazilian Flora 2020 (http://floradobrasil.jbrj.gov.br) using the flora package in R; plot census data were rigorously reviewed for consistency and potential measuring errors, and they were deposited in the ForestPlots.net database (Lopez-Gonzalez et al. Reference Lopez-Gonzalez, Burkitt, Lewis and Phillips2012; https://www.forestplots.net).
AGB Estimation
To enable standardized and accurate comparative analysis of the biomass change of multiple vegetation inventories at plot scale, we used recently developed allometric models to estimate biomass, accounting for tree diameter, woody specific gravity and tree height. Thus, we employed the Chave Moist equation, where AGB is calculated according to the following log–log model (Chave et al. Reference Chave, RéjouMéchain, Búrquez, Chidumayo, Colgan and Delitti2014): ln(AGB) = α + βln(ρ × D2 × H) + ε, where ρ, D2 and H are woody specific gravity, tree diameter at breast height and tree height, respectively, and the ε error term is assumed to be normally distributed. The parameters α and β are model coefficients estimated from ordinary least squares regression, yielding 0.0673 and 0.9760, respectively, in the AGB estimation model: AGBest = 0.0673 × (ρ × D2 × H)0.976 (details in Chave et al. Reference Chave, RéjouMéchain, Búrquez, Chidumayo, Colgan and Delitti2014). Height was estimated using a Weibull regional equation parameterized for Brazilian shield forests (Feldpausch et al. Reference Feldpausch, Banin, Phillips, Baker, Lewis and Quesada2011, Reference Feldpausch, Lloyd, Lewis, Brienen, Gloor and Monteagudo Mendoza2012). AGB was estimated using functions available in the online version of the ForestPlots.net platform (Lopez-Gonzalez et al. Reference Lopez-Gonzalez, Burkitt, Lewis and Phillips2012; https://www.forestplots.net).
Data Analysis
Net biomass change rates were derived and analysed both at the level of each interval and for each plot as the difference between total standing biomass at the final census and the first census divided by the interval length. Gains of woody biomass (‘tree growth’ plus ‘recruitment’) and biomass loss (‘mortality’) were computed at the stand level for each interval between successive censuses and for each plot using methods described elsewhere (Talbot et al. Reference Talbot, Lewis, Lopez-Gonzalez, Brienen, Monteagudo and Baker2014, Brienen et al. Reference Brienen, Phillips, Feldpausch, Gloor, Baker and Lloyd2015). To describe overall trends, we report averages and standard errors considering multiple sample plots and censuses along with one of the categorical factors: riparian or terra firme; burned or unburned; pre-2010 or during and after 2010. The one-sample Wilcoxon test was used to compare mean AGB net change rate variation from zero, after checking for non-normality with a Shapiro–Wilk test (Supplementary Fig. S2(a)); otherwise, a one-sample Student t-test was used. Welch’s t-tests were used to compare mean AGB net change rates among burned and non-burned forests and among riparian and terra firme forests, and as an alternative to the normal sample distribution, we used two-sample Wilcoxon tests after checking for normality, unequal sample sizes or heterogeneous variances. For the comparison between pre-2010 and during and after 2010 drought, we used only unburned plots to disentangle the direct effect of fire from drought. The same procedures were used for statistical analysis of productivity and mortality rates. All analyses were conducted in R (R Core Team 2017).
Results
Long-Term AGB Dynamics
Among all forest plots monitored in our study, we estimate a net overall biomass balance (mean ± standard error) of −0.66 ± 0.99 Mg ha–1 year–1 (Table 1 and Supplementary Table S2). Despite substantial plot-to-plot variation in biomass dynamics (5.43 standard deviations; Supplementary Fig. S2(a) and S2(b)), overall changes in net AGB among plots remained at balance over the monitored period (V = 260, p = 0.584). Terra firme forests gained 1.12 ± 0.64 Mg ha–1 year–1, while riparian forests lost −3.32 ± 2.11 Mg ha–1 year–1. Despite similar rank net AGB change among two forest types (W = 75, p = 0.171), only terra firme had gains greater than zero (V = 133, p = 0.038).
Table 1. Means and standard errors of net aboveground biomass change (Mg ha–1 year–1), evaluated by vegetation type and burning occurrence among plots for the whole period and within plots for specific intervals before and after the 2010 drought. Paired t-tests compare non-burned versus burned census intervals within plots.
a Marginally significant values, possibly due to small sample size (p < 0.10).
b Indicates absolute value due to only one sample.
c Full comparisons of pre-2010 and during and after the 2010 drought are not shown in the main text, given that they follow the same patterns observed for the whole period and there are not enough degrees of freedom for all burned combinations.
* Significant difference from a mean of 0 according to one-sample t-tests (or Wilcoxon rank tests for non-normal data).
‘i’ denotes the number of inventories (or censuses) within each class in the table, which may reflect remeasurements for multiple plots.
Determinants of AGB Net Change
Markedly divergent net AGB change among plots was due to burning effects (W = 31, p = 0.003). Thus, for example, while unburned forests had net gains (+1.37 ± 0.56 Mg ha–1 year–1; t = 2.42, df = 20, p = 0.025), there were significant losses of –5.39 ± 2.45 Mg ha–1 year–1 in burned forests (t = –2.20, df = 8, p = 0.059). Moreover, the burning effect was much more severe in riparian burned forest (–6.27 ± 2.59; t = –2.42, df = 7, p = 0.046), contrasting with average gains in unburned riparian forests (+2.56 ± 0.40; t = 6.36, df = 3, p = 0.008) or the average balance in terra firme forests (1.09 ± 0.68; t = 1.61, df = 16, p = 0.128) (Fig. 1).
Fig. 1. Box-and-whisker chart showing variation in whole period net biomass change rates in Mg ha–1 year-1, calculated as the aboveground biomass (AGB) difference within plots divided by the total time elapsed (averaged over the years) and plotted against forest type and burning occurrence.
The difference in biomass change between unburned and burned forests was entirely driven by mortality processes, since neither forest type nor fire had any effect on AGB productivity (gain plus recruitment by Mg ha–1 year–1; W = 314, p = 0.800 and W = 552, p = 0.5507, respectively; Fig. 2(a)). Instead, AGB mortality was closely associated with burning occurrence (W = 580, p < 0.001), with mortality in riparian burned forests being on average 8.26 ± 1.33 Mg ha–1 year–1, while it was only 2.10 ± 0.32 Mg ha–1 year–1 in riparian unburned forests, 3.42 ± 0.41 Mg ha–1 year–1 in terra firme unburned forests and 4.45 ± 1.03 Mg ha–1 year–1 in terra firme burned forests (Fig. 2(b)). Rates of tree mortality were not related to forest type in isolation (W = 578, p = 0.348). Overall, increased tree mortality associated with burning occurrence has driven rapid biomass loss in riparian forests but not in terra firme forests over the average time of monitoring, which spanned from c. 1 to 7 years between inventories (Supplementary Table S1).
Fig. 2. Box-and-whisker charts showing variation in rates of biomass gain (a: productivity) and loss (b: mortality) in Mg ha–1 year–1, calculated by census-to-census aboveground biomass (AGB) change within plots and plotted according to forest type and burning occurrence.
There was no effect of the 2010 drought in isolation on the biomass balance, woody productivity or mortality in terms of AGB. However, there was a significant relationship between burning occurrence and the 2010 drought (t = –2.19, df = 26.65, p = 0.037; Supplementary Fig. S3). Despite this, no relation was found between maximum climatological water deficit (MCWD) and biomass change (R2 = 0.001, F(1, 28) = 0.018, p = 0.894), which we attribute to broad year-to-year variation in the effects of climate on vegetation dynamics (including biomass gains and losses).
Plot-Scale Variation in AGB
At the individual plot scale, there was substantial variation; however, every plot with magnified loss of biomass was burned at least once in the studied period (Fig. 3 and Supplementary Table S2). For instance, PEA-06 lost biomass at the fastest rate, decreasing by –15.20 Mg ha–1 year–1 in one interval between 2008 and 2016, followed by GAU-01 with –8.47 Mg ha–1 year–1 between 1999 and 2013. Among unburned plots, net losses in ALF-02 (–5.67 ± 4.90 Mg ha–1 year–1 from 2008 to 2013) are associated with a low productivity of 4.60 ± 4.91 Mg ha–1 year–1 and a high mortality -8.78 ± 4.66 Mg ha–1 year–1 over the monitored period (Supplementary Table S2). Despite not being burned, TAN-03 lost –2.98 Mg ha–1 year–1 from 2009 to 2015, where a low productivity 3.60 ± 1.37 Mg ha–1 year–1 and a high mortality –6.19 ± 1.78 Mg ha–1 year–1 appear consistent with expectations of drought impacts. Large net increases were found elsewhere, such as in FLO-02 (+5.94 ± 0.12 Mg ha–1 year–1 between 2010 and 2015), POA-01 (+5.17 ± 5.16 Mg ha–1 year–1 from 2014 to 2016) and ALF-01 (+1.56 ± 0.39 Mg ha–1 year–1 from 2002 to 2013) (Supplementary Fig. S2(b)). Overall, this suggests no consistent region-wide signal of impact of recent droughts.
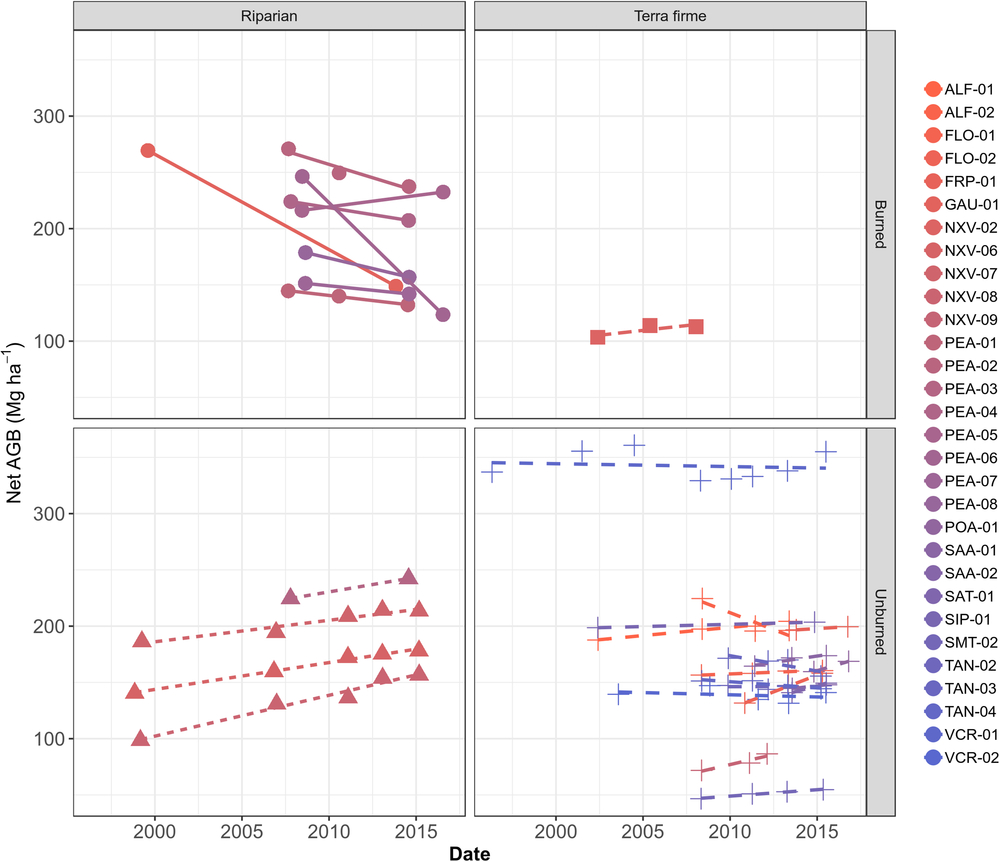
Fig. 3. Plot-scale temporal variation in aboveground biomass (AGB) in Mg ha–1, split among forest types and according to burning occurrence over the monitored period.
Discussion
Long-Term Biomass Change
Firstly, our results indicate that forests in the ZOT remain in balance, taking up carbon from the atmosphere at the same rate as losing it. Permanent monitoring plots elsewhere in Amazonia indicate significant spatial variation in biomass and productivity (e.g., Johnson et al. Reference Johnson, Galbraith, Gloor, De Deurwaerder, Guimberteau and Rammig2016) and significant changes over time (e.g., Phillips et al. Reference Phillips, Aragao, Lewis, Fisher, Lloyd and Lopez-Gonzalez2009, Brienen et al. Reference Brienen, Phillips, Feldpausch, Gloor, Baker and Lloyd2015), showing that both spatial and time-variable environmental factors modulate Amazon forest dynamics. Nevertheless, substantial uncertainty on the future biomass balance of Amazon forest remains (Huntingford et al. Reference Huntingford, Zelazowski, Galbraith, Mercado, Sitch and Fisher2013), and an oft-neglected source of uncertainty is the ecological diversity within Amazonia ecosystems themselves (Levine et al. Reference Levine, Zhang, Longo, Baccini, Phillips and Lewis2016).
The apparent rate of change in AGB in unburned forests (net gain of c. 1.4 Mg ha–1 year–1, albeit with substantial site-to-site variation) is comparable to values recorded for decades across the transitions zones of Amazon (Phillips & Brienen Reference Phillips and Brienen2017) as well as African (Lewis et al. Reference Lewis, Lopez-Gonzalez, Sonké, Affum-Baffoe, Baker and Ojo2009) and Asian tropical forests (Qie et al. Reference Qie, Lewis, Sullivan, Lopez-Gonzalez, Pickavance and Sunderland2017). This suggests that the ultimate drivers of this sink may be the same widespread processes, possibly related to the planet-wide increase in gross primary production of more than 30% over the past century (Campbell et al. Reference Campbell, Berry, Seibt, Smith, Montzka and Launois2017). However, at the ZOT, we observed that the net rate of biomass change was significantly greater (more positive) in terra firme forests than in riverine forests (1.12 ± 0.64 and –3.32 ± 2.11 Mg ha–1 year–1, respectively). To our knowledge, this is the first time a biomass dynamic comparison has been attempted anywhere in Amazonia using multiple permanent monitoring plot data, and the results show that the Amazon carbon sink conceals substantial long-term variation from one forest type to another.
Drivers of Biomass Change
Our results suggest that the different forest ecosystems here vary in their capacity to store and take up carbon, and that this is driven primarily by their sensitivity to fire, despite the potential interaction with drought (Brando et al. Reference Brando, Balch, Nepstad, Morton, Putz and Coe2014, Alencar et al. Reference Alencar, Brando, Asner and Putz2015). In our study, overall, burned riparian forests lost biomass, but unburned riparian forests and terra firme forests gained biomass. Notably, it is likely that differing responses to ongoing environmental changes can be expected among these different forest ecosystems (Levine et al. Reference Levine, Zhang, Longo, Baccini, Phillips and Lewis2016, Esquivel-Muelbert et al. Reference Esquivel-Muelbert, Baker, Dexter, Lewis, ter Steege and Lopez-Gonzalez2017, Flores et al. Reference Flores, Holmgren, Xu, van Nes, Jakovac, Mesquita and Scheffer2017). However, although we could not demonstrate direct effects of the 2010 drought from our long-term data before this period, a partial correlation between burning occurrence and drought was evident, suggesting that fire-prone ecosystems may suffer most from a fire–drought interaction (Brando et al. Reference Brando, Balch, Nepstad, Morton, Putz and Coe2014). Drought potentially increases the flammability of riparian forests, which seem much less resilient to burning events than upland forests at the scale analysed here and elsewhere (de Faria et al. Reference de Faria, Brando, Macedo, Panday, Soares-Filho and Coe2017, Flores et al. Reference Flores, Holmgren, Xu, van Nes, Jakovac, Mesquita and Scheffer2017).
Our results show that riparian forests are losing their capacity to take up carbon because fire is causing high biomass mortality rather than impacting forest regrowth. The impacts of fire presumably extend well beyond the forest biomass balance, including also the plant and animal species compositions of the forests, grass invasion and edge effects (Silvério et al. Reference Silvério, Brando, Balch, Putz, Nepstad, Oliveira-Santos and Bustamante2013). The comparison among forest types suggests that riparian forests are not sensitive to direct drought effects – gaining biomass even during and after the severe drought event of 2010 – but instead they are more impacted by burning events. Despite this, some of our plots have suffered biomass loss not associated with burning occurrence (Supplementary Fig. S2(b)), and we suggest that a combination of drought and edge effects due to forest fragmentation may also be playing a role here as in another parts of Amazonia (Alencar et al. Reference Alencar, Brando, Asner and Putz2015, de Faria et al. Reference de Faria, Brando, Macedo, Panday, Soares-Filho and Coe2017, Rappaport et al. Reference Rappaport, Morton, Longo, Keller, Dubayah and dos-Santos2018).
Amazon-wide, fire is associated with drought, and remote sensing analyses show that this is much more frequent during extreme drought events (Chen et al. Reference Chen, Morton, Jin, Collatz, Kasibhatla and van der Werf2013, Aragão et al. Reference Aragão, Poulter, Barlow, Anderson, Malhi and Saatchi2014, Reference Aragão, Anderson, Fonseca, Rosan, Vedovato and Wagner2018, Brando et al. Reference Brando, Balch, Nepstad, Morton, Putz and Coe2014). Thus, indirect effects related to enhanced forest flammability caused by drought are also plausible here in the ZOT, given that MCWD seemed to vary widely after the 2010 drought and was associated with plots where burning had occurred (Supplementary Fig. S3). In riparian forests, fires deliberately set to stimulate grass regrowth (Silvério et al. Reference Silvério, Brando, Balch, Putz, Nepstad, Oliveira-Santos and Bustamante2013) may invade forest areas more frequently and intensively in drier years. Associated with organic fuel sources of riparian forests, soils may magnify burning intensity, causing biodiversity erosion and biomass loss with a clear tendency towards the biotic homogenization of tree taxonomic composition (Da Silva et al. Reference Da Silva, Mews, Marimon-Junior, de Oliveira, Morandi, Oliveras and Marimon2018).
The long-term association between drought and fire (e.g., Chen et al. Reference Chen, Morton, Jin, Collatz, Kasibhatla and van der Werf2013) and the recent 2015–2016 El Niño spike in fire frequency (Aragão et al. Reference Aragão, Anderson, Fonseca, Rosan, Vedovato and Wagner2018) show that this is an ongoing threat at the ZOT. Remote sensing analyses also suggest that elsewhere in Amazonia floodplain forests are more sensitive to the joint effects of drought and fire (Flores et al. Reference Flores, Holmgren, Xu, van Nes, Jakovac, Mesquita and Scheffer2017). Floodplain forests seem more vulnerable because of naturally higher flammability compared with upland forests, with larger masses of exposed root mats or fine litter in the soils that may burn and spread fire easily in drier years. Our long-term monitoring on the ground thus validates and advances our understanding of the trends identified by satellite and previous field reports for Amazon riparian forests in relation to fire sensitivity (de Resende et al. Reference de Resende, Nelson, Flores and de Almeida2014, Maracahipes et al. Reference Maracahipes, Marimon, Lenza, Marimon-Junior, De Oliveira and Mews2014, de Almeida et al. Reference de Almeida, Nelson, Schietti, Gorgens, Resende, Stark and Valbuena2016).
Overall, our results suggest that the synergistic effects of ongoing climate change and widespread fires (Chen et al. Reference Chen, Morton, Jin, Collatz, Kasibhatla and van der Werf2013, Brando et al. Reference Brando, Balch, Nepstad, Morton, Putz and Coe2014) are the main threats to Amazonia’s stability, especially along riparian and flooding forests, corroborating other studies (e.g., Alencar et al. Reference Alencar, Brando, Asner and Putz2015, Flores et al. Reference Flores, Holmgren, Xu, van Nes, Jakovac, Mesquita and Scheffer2017). In this respect, the forests at the southern Amazon edge are at particular risk because of the large area of contact edges between riparian forest ecosystems and adjacent savannas and agriculture, which increase incidental burning risk (Chen et al. Reference Chen, Morton, Jin, Collatz, Kasibhatla and van der Werf2013). The existence of extensive variability among floodplain forests (Schöngart et al. Reference Schöngart, Wittmann, Junk, Teresa and Piedade2017), and also regarding upland forest floristic composition and structure (Alencar et al. Reference Alencar, Brando, Asner and Putz2015), should be extensively considered in future analysis of biomass and carbon dynamics in the face of ongoing environmental threats throughout the Amazon basin.
Implications for Forest Conservation
The pathway to potential ‘biomass collapse’ (Laurance et al. Reference Laurance, Laurance, Ferreira, Rankin-deMerona, Gascon and Lovejoy1997) may take different forms in different ecosystems of Amazonia. Here at the southern edge, the joint effects of ongoing climate change and widespread and uncontrolled burning for land clearance and pasture management represent twin threats. Our long-term plots provide substantial evidence that riparian forests are sensitive to uncontrolled fires that are widespread over the southern Amazonia edge in most dry seasons and especially during drought years. Conserving the crucial ecosystem functions of the remaining riparian forests requires both stopping deforestation and reducing the occurrence of accidental fires. In addition, the ongoing small carbon sink into unburned forests in the region and the lack of an obvious direct impact of drought show that the ecosystems of the region retain substantial resilience to environmental change – including the heating and drying that has occurred here already (Brando et al. Reference Brando, Balch, Nepstad, Morton, Putz and Coe2014, Marimon et al. Reference Marimon, Marimon-Junior, Feldpausch, Oliveira-Santos, Mews and Lopez-Gonzalez2014). If these forests can be protected from burning, then there is every chance that they can thrive and continue to sustain their unique biodiversity (Flores et al. Reference Flores, Holmgren, Xu, van Nes, Jakovac, Mesquita and Scheffer2017, Sullivan et al. Reference Sullivan, Talbot, Lewis, Phillips, Qie and Begne2017) and continue to provide critical regional and global ecosystem services. Whether or not they will be protected is less clear, as they are profoundly threatened by the greatly weakened protection laws for riverine forests embodied in recent changes in the Brazilian Forest Code.
Supplementary material
To view supplementary material for this article, please visit www.cambridge.org/core/journals/environmental-conservation
Author ORCIDs
Beatriz S Marimon, 0000-0003-3105-2914; Ted R Feldpausch, 0000-0002-6631-7962; Denis S Nogueira, 0000-0001-8893-7903; Oliver L Phillips, 0000-0002-8993-6168; Edmar A Oliveira, 0000-0002-6446-3376
Acknowledgements
For help with field measurements, vegetation identification and helpful discussions, we thank the members of the LABEV – Plant Ecology Laboratory at UNEMAT.
Financial Support
DSN was supported by CNPq-PDJ scholarships (150622/2015-5 and 150577/2016-8) associated with the PVE project (401279/2014-6) to OLP. We also thank CNPq for scholarships and other support through projects PELD/CNPq (403725/2012-7 and 441244/2016-5) and productivity grants (BSM) PPBIO-CNPq 457602/2012-0, and CAPES PVE project 177/2012 to TRF. The British Council Newton Fund (grant 275556724) and the NERC TROBIT project (Tropical Biomes in Transition, NE/NE/D005590/1) also contributed. OLP was supported by an ERC Advanced Grant and a Royal Society–Wolfson Research Merit Award. PM, EAO, FE, ECN and SMR are grateful for scholarship support from CAPES, FAPEMAT and CNPq.
Conflict of Interest
None.
Ethical standards
Due to the nature of the study, ethical permission was not required.


 Open access