


Introduction
Montmorillonite (Mnt) belongs to the smectite (Sme) family; smectite is a 2:1 phyllosilicate (Reference KretzKretz, 1983; Reference Whitney and EvansWhitney & Evans, 2010; Reference WarrWarr, 2020). The Mnt structure is composed of a stack of two types of sheets: an octahedral sheet (MO4 (OH)2), represented by O, where M can be either Al or Mg, surrounded by two tetrahedral sheets (SiO4), symbolized by T. This structure is known as T–O–T or 2:1, and has a layer thickness of ~9.6 Å (Reference BrownBrown, 1982; Reference Drits and TchoubarDrits & Tchoubar, 1990; Reference Güven and BaileyGüven & Bailey, 1988; Reference MollMoll, 2001; Reference NewmanNewman, 1987). Additionally, there are isomorphic substitutions in the (T) and/or (O) sheets caused by the localization of cations of various natures in the various cavities. The Mnt is characterized by their large cation exchange capacity (CEC), permeability, layered structure, various hydration properties, very large specific surface area (SSA), porosity, and resistance to mechanical stresses (Reference Oueslati, Mejri and Ben Haj AmaraOueslati et al., 2022b). The CEC is an intrinsic feature of phyllosilicates and is defined by the compensating cations (CC) from the soil solution (SS) located in the interlamellar space (IS) (Reference Bérend, Cases, François, Uriot, Michot, Masion and ThomasBérend et al., 1995; Reference Cases, Bérend, François, Uriot, Michot and ThomasCases et al., 1997; Reference Sato, Watanabe and OtsukaSato et al., 1992). The type of CC, amount and location of charge, as well as external factors such as thermal gradient, pressure, relative humidity (RH), and pH of the SS significantly affect this feature, which is the origin of the mineral hydration behavior. Indeed, the location of intrinsic layer charge and compensating cations, as well as the presence of water molecules in the interlamellar space (IS), determine the progressive expansion of the IS, known as the hydration process. This process causes the basal spacing of the 001 plane to vary discontinuously. Different hydration states (HS) can be defined based on the number of water layers intercalated in the IS: the dehydration state 0W (d 001 ~ 10 Å), one-water hydration state 1W (d 001 ~ 12.2 Å), two-water hydration state 2W (d 001 ~ 15.4 Å), three-water layers 3W (d 001 ~ 18.2 Å), and eventually four-water layers 4W (d 001 ~ 21 Å). The type, amount, and location of compensating cations, as well as external factors such as thermal gradient, pressure, relative humidity (RH), and pH of the soil solution, affect significantly the hydration process, which is responsible for the mineral’s hydration behavior (Reference Bérend, Cases, François, Uriot, Michot, Masion and ThomasBérend et al., 1995; Reference Dazas, Ferrage, Delville and LansonDazas et al., 2014, Reference Dazas, Lanson, Delville, Robert, Komarneni, Michot and Ferrage2015; Reference Oueslati and MeftahOueslati & Meftah, 2018; Reference Oueslati, Rhaiem and AmaraOueslati et al., 2011; Reference Sato, Watanabe and OtsukaSato et al., 1992; Reference Yan and ZhangYan & Zhang, 2021). There are several other properties of clay minerals that are highly sensitive to changes in temperature gradients, kinetics during cation exchange processes, fluctuations in relative humidity, atmospheric pressure, the type and nature of CCs, as well as the solid–liquid ratio for heavy-metal removal (Reference Ammar, Oueslati, Chorfi and RhaiemAmmar et al., 2014a, Reference Ammar, Oueslati, Rhaiem and Amara2014b, Reference Ammar, Oueslati, Ben Rhaiem and Ben Haj Amara2014c; Reference BerendBerend, 1991; Reference Coles and YongColes & Yong, 2002; Reference Es-Sahbany, Berradi, Nkhili, Hsissou, Allaoui, Loutfi and El YoubiEs-Sahbany et al., 2019; Reference Karmous, Rhaiem, Robert, Lanson and AmaraKarmous et al., 2009; Reference Marty, Grangeon, Lassin, Madé, Blanc and LansonMarty et al., 2020; Reference Meftah, Oueslati and AmaraMeftah et al., 2010; Reference OueslatiOueslati, 2019; Reference Oueslati, Ben Rhaiem, Karmous, Naaman and Ben Haj AmaraOueslati et al., 2006, Reference Oueslati, Rhaiem and Amara2012, Reference Oueslati, Chorfi and Abdelwahed2017; Reference Potgieter, Potgieter-Vermaak and KalibantongaPotgieter et al., 2006; Reference Pufahl, Fredlund and RahardjoPufahl et al., 1983; Reference Schroeder, Pruett and MelearSchroeder et al., 2004; Reference Tournassat, Grangeon, Leroy and GiffautTournassat et al., 2013; Reference Vidal, Baldeyrou, Beaufort, Fritz, Geoffroy and LansonVidal et al., 2012; Reference Yin and ZhuYin & Zhu, 2016; Reference Yuan, Theng, Churchman and GatesYuan et al., 2013).
The wide abundance of Mnt in nature and its low cost have made it suitable for various applications. It is known as one of the most effective materials for pollutant removal, especially in the field of mineralogy (Reference Chaari, Medhioub and JamoussiChaari et al., 2011; Reference De Queiroga, Franca, Rodrigues, Santos, Fonseca and Jaberde Queiroga et al., 2019; Reference Mahy, Tsaffo Mbognou, Léonard, Fagel, Woumfo and LambertMahy et al., 2022; Reference Nistor and MironNistor & Miron, 2007). Furthermore, it is utilized as a geological barrier for the containment of industrial and radioactive waste in deep disposal sites (Reference Bobin, Huffer and NifeneckerBobin et al., 2021). These sites are built on the multibarrier concept, which involves the combination of four interfaces: waste/metal package, metal package/concrete, concrete/clay, and clay/host rock (Reference AbadieAbadie, 2020; Reference Antoine, Marchiol, Brocandel and GrosAntoine et al., 2005; Reference DizierDizier, 2011; Reference Landrein, Vigneron, Delay, Lebon and PagelLandrein, et al., 2013). These storage locations are situated typically at ~500 m below sea level. The main advantages of using geological clay liners in these sites are their large adsorption capacity for radioactive elements and their low permeability, which helps to slow down the migration of radionuclides in the host rock (Reference Anastácio, Aouad, Sellin, Fabris, Bergaya and StuckiAnastácio et al., 2008; Reference Huber, Heck, Truche, Bouby, Brendlé, Hoess and SchäferHuber et al., 2015; Reference Laverov, Yudintsev, Kochkin and MalkovskyLaverov et al., 2016; Reference Pusch, Knutsson, Al-Taie and HatemPusch et al., 2012; Reference Sellin and LeupinSellin & Leupin, 2013).
In the field of medicine, Mnt has shown promise as a drug-delivery system due to its large surface area and biocompatibility (Reference Massaro, Lazzara, Milioto, Noto and RielaMassaro et al., 2017; Reference Mousavi, Hashemi, Salahi, Hosseini, Amani and BabapoorMousavi et al., 2018; Reference Neves, da Silva, da Silva, Guirardello and VieiraNeves et al., 2022; Reference Panchal, Fakhrullina, Fakhrullin and LvovPanchal et al., 2018). In cosmetic compounds, Mnt has been used as a natural alternative to synthetic thickeners and emulsifiers (Reference Whittaker, Lammers, Carrero, Gilbert and BanfieldWhittaker et al., 2019). As an ion exchanger, Mnt can be used for the removal of heavy metals and other pollutants from wastewater (Reference Carretero and PozoCarretero & Pozo, 2009, Reference Carretero and Pozo2010; Reference Gomes and SilvaGomes & Silva, 2007; Reference Gubitosa, Rizzi, Fini and CosmaGubitosa et al., 2019; Reference Hussain and AliHussain & Ali, 2021; Kang et al., 2019; Reference Otunola and OloladeOtunola & Ololade, 2020; Reference Papadopoulos, Giouri, Tzamos, Filippidis and StoulosPapadopoulos et al., 2014; Reference Yingying, Baoqiang and YangYingying et al., 2020).
Many studies have been conducted to investigate the adsorption properties of Mnt in various applications. The solid/liquid ratio is frequently a factor in the adsorption efficiency, as it affects the availability of active sites on the Mnt surface (Reference Mejri, Oueslati and AmaraMejri et al., 2021). Overall, the unique properties of Mnt make it a valuable resource in many different fields. Reference Usman, Kuzyakov and StahrUsman et al. (2004) reported that a mere 4 to 8% of clay suspension can remove effectively up to 70% of heavy metals from a solution with an initial concentration of 100%. Furthermore, studies have shown that increasing the dose of the clay mineral results in an increase in adsorption (Reference Wahba, Labib, Darwish and ZaghloulWahba et al., 2017; Reference Zhang, Li, Li, Hu and ZhengZhang et al., 2011).
While significant research has been conducted on the use of clay membranes for various applications, the impact of external stress coupling on clay membranes has not yet been addressed fully. Recent studies have shown that the binding selectivity of various phases in a clay membrane can be affected by both chemical and mechanical stress activities (Reference Whittaker, Lammers, Carrero, Gilbert and BanfieldWhittaker et al., 2019). Additionally, clay membranes can change their structure in response to changes in pH and temperature (Reference Meftah, Oueslati and AmaraMeftah et al., 2011). In a recent study, Reference Mejri, Oueslati, Haj and AmaraMejri et al., (2022a, Reference Mejri, Oueslati and Amara2022b) found that the exfoliation process and mesopore diameter of clay membranes increased with increasing strength of constraint coupling, including changes in SS pH and thermal gradient. The behavior of clay membranes in relation to hydration, porosity, selectivity, membrane permeability, CEC, adsorber performance, ion exchanger completion, and aging geomembranes can all be affected by constraint coupling (Reference Ammar, Oueslati, Chorfi and RhaiemAmmar et al., 2014a, Reference Ammar, Oueslati, Rhaiem and Amara2014b, Reference Ammar, Oueslati, Ben Rhaiem and Ben Haj Amara2014c; Reference Bataillon, Musy and RoyBataillon et al., 2001). Furthermore, Reference Marty, Grangeon, Lassin, Madé, Blanc and LansonMarty et al. (2020) emphasized the relationship between the chemistry and hydration of clays and the preponderance of H2O, considering the relative humidity and interstitial solution composition.
Many studies (Reference Ammar, Oueslati, Chorfi and RhaiemAmmar et al., 2014a, Reference Ammar, Oueslati, Rhaiem and Amara2014b, Reference Ammar, Oueslati, Ben Rhaiem and Ben Haj Amara2014c; Reference Bataillon, Musy and RoyBataillon et al., 2001; Reference Ishidera, Okazaki, Yamada, Tomura and ShibutaniIshidera et al., 2022; Reference Karmous, Ben Rhaiem, Naamen, Oueslati and Ben Haj AmaraKarmous et al., 2006; Reference Oueslati, Mejri and Ben Haj AmaraOueslati et al., 2022b; Reference Saravanan, Ramamurthy and MadrasSaravanan et al., 2015) have focused on the impact of individual parameters on clay material functionality, without taking into consideration the interplay of multiple environmental parameters that affect its behavior in real-world conditions.
A limited number of studies have employed this highly realistic methodology, as seen in works such as those by Reference Chalghaf, Oueslati, Ammar, Rhaiem and AmaraChalghaf et al. (2013) and Reference Whittaker, Lammers, Carrero, Gilbert and BanfieldWhittaker et al. (2019). This methodology involves simulating real-world stresses at the laboratory scale using a well-defined scientific approach, including: (1) identifying the nature and intensity of the stresses applied to the mineral; (2) selecting the order of stress couplings to be performed; (3) implementing the chosen stress coupling in the laboratory; (4) characterizing the material's structural response; and (5) evaluating, optimizing, or explaining the results obtained.
The objective of the current study was to combine multiple physicochemical constraints at the laboratory scale to study the hydration behavior and structural response of Wyoming montmorillonite (W-Mnt) under the combined influence of geochemical, thermal, and kinetic perturbations. These constraints included variations in the pH of the SS saturated with different divalent cations such as Ni(II), Mg(II), or Zn(II), as well as modifications in temperature gradients and contact periods. The main goal of this study was to investigate the CEC and hydration behavior of the mineral, particularly the modifications in IS. The aim was to gain a comprehensive understanding of how these perturbations influence the mineral's response, specifically the changes in layer spacing configuration. To achieve this, a set of structural parameters was analyzed, including the type of compensating cation, the abundance of different layer types and their relative probability, the positioning of atoms/ions within the structure, the average number of layers (M̄), layer stacking modes, and the quantity of water molecules. The quantification of mineral structure relied on the quantitative analysis of 00l reflections. This work is based on two main hypotheses. The first approach involved studying the impact of the dominance of a single applied constraint (zero order) while ignoring the coupling effects of the kinetic, thermal, and geochemical (second order) constraints on the mineral's structural response. The second hypothesis suggested that a direct relationship would be found among the properties of ionic potential (IP), the electronegativity (EN) of CC, and the migration of water molecules (H2O) within the IS, resulting from changes in the d 001 distance, thereby leading to the emergence of specific hydration behavior.
Materials and Methods
Baseline Material
Wyoming montmorillonite (W-Mnt), represented by SWy-2, is an American bentonite that served as the initial material. This Sme was obtained from the Source Clays Repository of The Clay Minerals Society (Reference MollMoll, 2001). The W-Mnt is described by a half-cell structural formula, as follows (Reference Mermut and CanoMermut & Cano, 2001):

Pretreatment
To prepare a Na-rich montmorillonite suspension, a pretreatment of the starting material was performed. A small amount of clay (~10 g) was dispersed in a 1 M NaCl solution (~100 mL). The suspensions, named ‘SWy-2,’ underwent mechanical shaking for 24 h in the saline solution. Then, the solid fraction was separated by centrifugation, and fresh saline solution was added. This process was repeated four to five times to ensure the cation exchange process (CEP) was complete. Excess salt was removed by four to five washing cycles, each lasting 24 h, accompanied by sedimentation, supernatant removal, and immersion in deionized water. After the clay suspension (SWy-Na) was recovered, it was subjected to oven drying at 60°C for a period of 1 day. Following the drying process, it was removed from the oven.
Second-Order Coupling Constraints
Three metal cations (Ni2+, Mg2+, and Zn2+) were studied and were selected mainly because of their common presence in industrial and radioactive waste, as well as their various properties (Reference Ammar, Oueslati and Ben Haj AmaraAmmar et al., 2018; Reference Oueslati, Mefath, Rhaiem and AmaraOueslati et al., 2009).
Second-order constraints were coupled by combining three external factors: geochemistry (variation of the pH of the soil solution), thermal gradients (variation of temperature, T in °C), and kinetics (variation of the duration of cationic exchange t in hours) at the laboratory scale.
To implement this approach, solutions of NiCl2, MgCl2, and ZnCl2 (from MP Biomedicals, Illkirch-Graffenstaden, France) were prepared separately (250 mL, each sample) with a well defined pH (initially, pH = 2). The CEP was initiated by adding SWy-Na (0.5 g of powder for each solution). For each sample, a specific duration of mechanical agitation (initially set at t = 5 h) was applied concurrently with a specific temperature (initially set at 50°C). Afterward, a sample of the solution was taken and centrifuged at 4000 rpm (~ × 0.9 g) to separate the solid fraction from the liquid fraction. The solid fraction obtained was washed several times with distilled water to remove chloride ions (excess salt). The resulting samples were designated as SWy-M, where M represents a type of metal cation (e.g. SWy-Ni, SWy-Mg, and SWy-Zn).
For the solutions agitated for 5 h at pH = 2 and T = 50°C, an adjustment of the total volume of the MCl2 solution was made to reach 250 mL by adding drops of hydrochloric acid or sodium hydroxide (HCl/NaOH) and distilled water, compensating for the volume decrease of the soil solution due to evaporation at 50°C (in the case of the first sample). The addition of NaOH was not random; it was done to increase the pH of the new solution by one pH unit (from 2 to 3). Then, a temperature increase was performed (in 25°C increments) by adjusting the T value on the magnetic-stirrer hot plate after each sampling, accompanied by a significant increase in the stirring duration (contact time of the sodic clay with the heavy metal), in steps of 5 h each time. This process was repeated multiple times until the final sample was obtained (pH = 6, T = 150°C, t = 25 h), (Fig. 1).
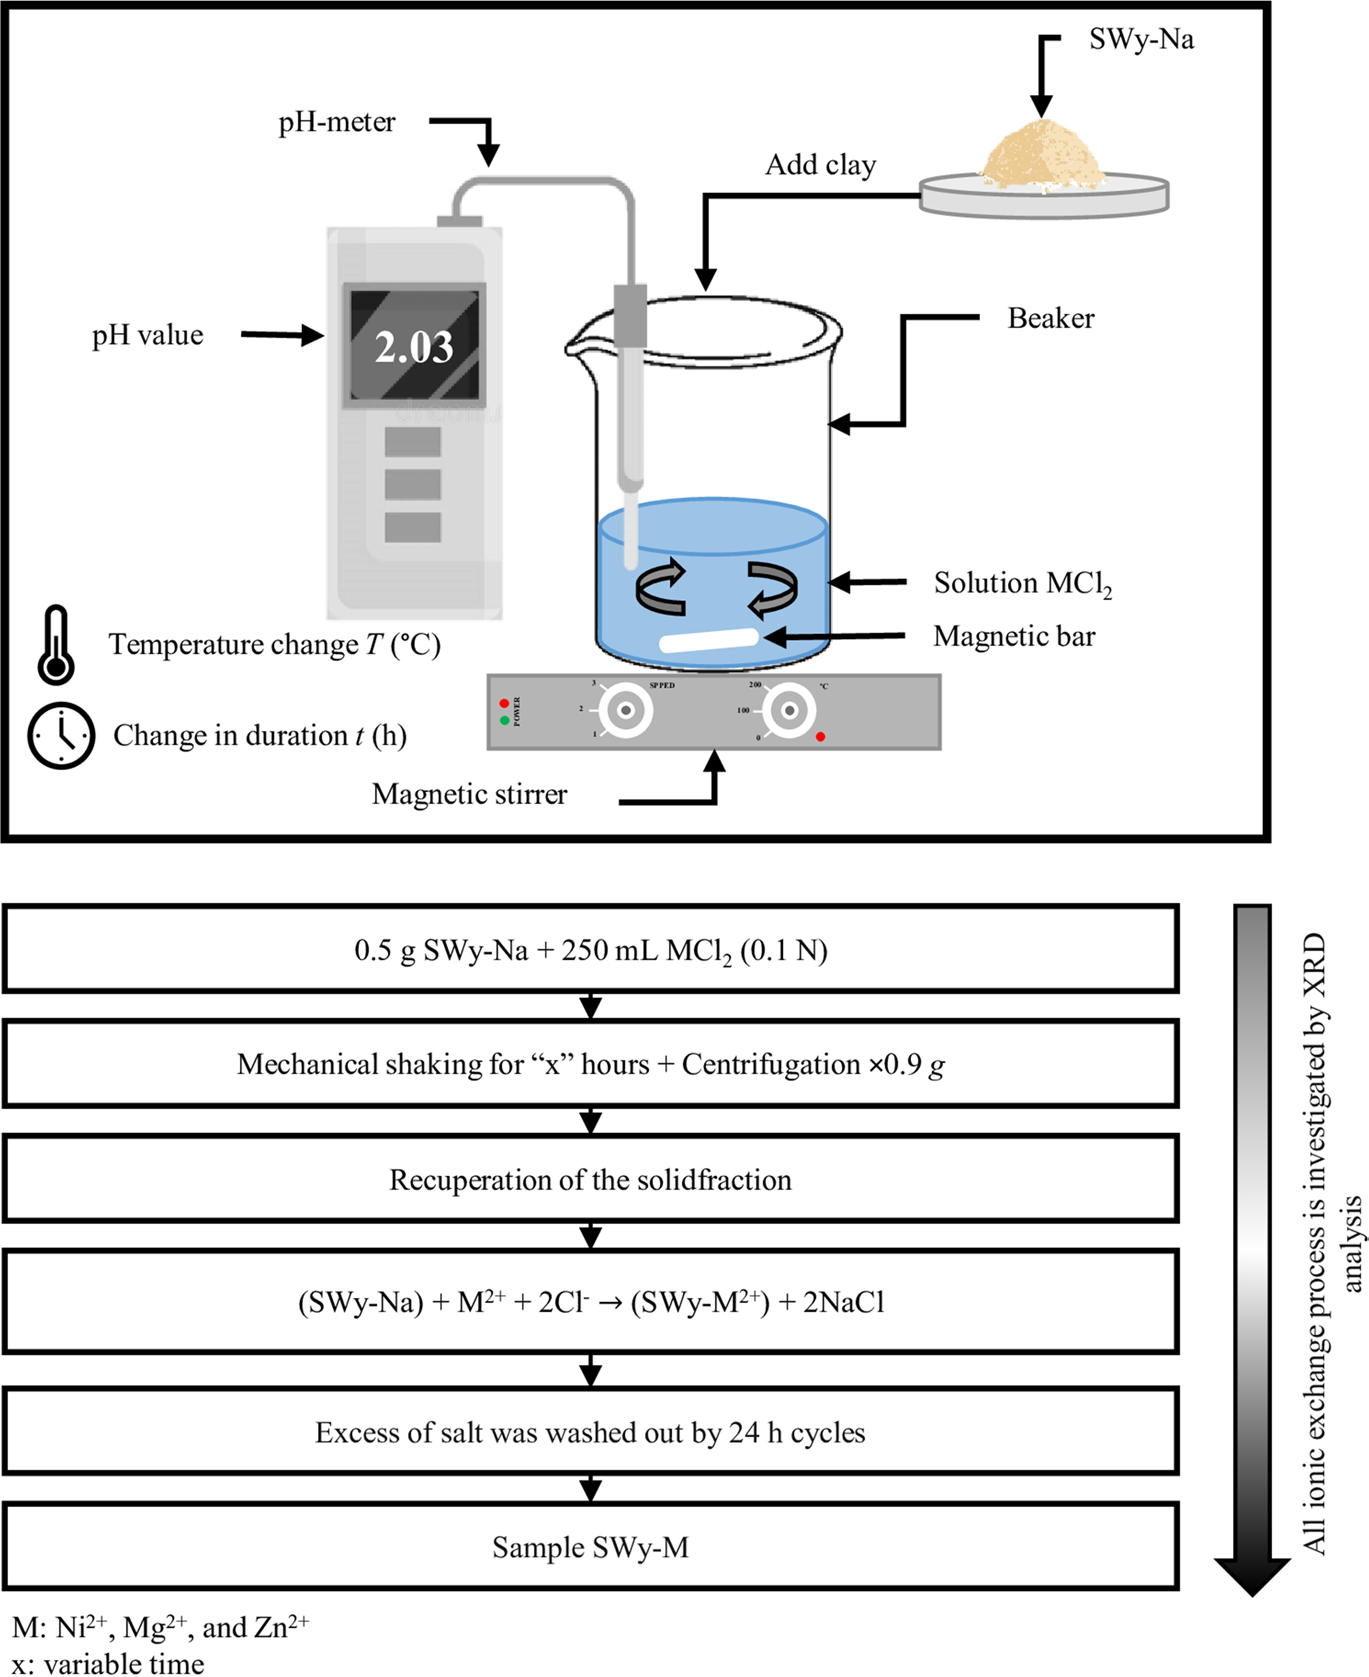
Fig. 1 Detail of the experimental protocol of the CEP under the effect of the second-order coupling of the applied constraints
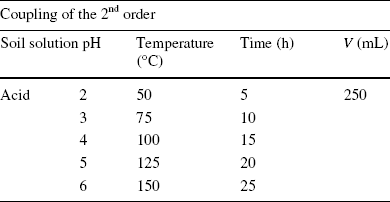
The three experiments were carried out simultaneously under the same atmospheric pressure, at the laboratory scale. The acidity and temperature of the solutions (MCl2) were monitored using a pH meter and a thermometer, respectively. The duration of the cation exchange was measured using a stopwatch (Table 1).
Table 1 Experimental values of soil solution pH, temperature (T), and contact time (t) of the second-order constraint coupling applied
To analyze the complexes obtained by X-ray diffraction, oriented samples were prepared by depositing the suspensions on glass slides in a dry environment for 24 h.
X-ray Diffraction (XRD)
To study crystal structures, a Bruker D8 ADVANCE X-Ray diffractometer (Bruker AXS GmbH, Karlsruhe, Germany) was used, equipped with CuKα monochromatic radiation (λ = 0.15406 nm) at 40 kV and 20 mA. The scan settings consisted of a step size of 0.01°2θ, a counting time of 6 s per step, and an angular range from 3.5 to 60°2θ. All experimental diffractograms were recorded at room temperature (Bizerte, Tunisia). The XRD research was carried out using a combination of semi-quantitative and quantitative analyses.
Semiquantitative and quantitative XRD analysis
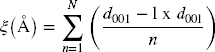
The compounds studied were characterized and identified using XRD, as reported in previous studies (Reference LeoniLeoni, 2008; Reference Scardi and LeoniScardi & Leoni, 2002; Reference Scardi, Leoni and BeyerleinScardi et al., 2011). Two associated analysis concepts were utilized to achieve this. The first was the ‘semi-quantitative XRD analysis,’ which involved determining the structure of the compounds by calculating the d 001 basal intercalated value, the full width at half maximum (FWHM), the crystallite size (solved using the Scherrer equation), and the rationality parameter (ξ). The expression for ξ is as follows (Reference BaileyBailey, 1980; Ben Reference Ben Brahim, Besson and TchoubarBrahim et al., 1984):
The second was ‘quantitative XRD analysis,’ which involved determining the structural parameters (SP) at the nanoscale and provided a detailed overview of the interlamellar space (IS) contents, the arrangement of hydrated CC (M
2+ + H2O molecules), the average number of layers per stacking
 , the layer stacking mode (LSM), the homogeneity, and/or heterogeneity of the crystallites, crystallite defects, and more. This approach was implemented using an indirect modeling technique that involved comparing experimental profiles with theoretically predicted ones. This highlights the importance of conducting a quantitative investigation and the limitations of semiquantitative analysis in understanding the lamellar structure.
XRD profile modeling: Theoretical diffracted intensity and modeling strategy
Modeling diffractograms enables the quantification of mixed-layer structures (MLS) (Reference LansonLanson, 2005), identification of the hydration state (0W → 3W), determination of structural heterogeneities, CEC variations, crystallite size D, optimal IS configuration, and average number of layers per crystallite. This indirect method follows a well determined mathematical formalism (Reference Drits and TchoubarDrits & Tchoubar, 1990), and the expression of the diffracted intensity for the space following the reciprocal z-axis is given by:
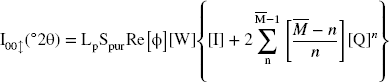
In the above equation, Re represents the real part of the final matrix, Spur is the sum of the diagonal terms of the real matrix, Lp is the Lorentz polarization factor,
 is the number of layers per stack, and n ranges from 1 to (1–
 –1). [Ф] is the matrix of structure factors, [I] is the identity matrix, [W] is the diagonal matrix of the proportions of the different types of layers, and [Q] is the matrix representing the interference phenomena between adjacent layers.
This indirect method allows for the determination of the abundance of different types of layers (Wi), the layer types of LSM, and the average number,
 , for the distributions of layers per coherent scattering domain (CSD) (Reference Oueslati, Rhaiem and AmaraOueslati et al., 2012). Within a CSD, the stacking of layers is described by a set of junction probabilities (Pij). The relationship between probabilities and the abundance Wi of two different layer types (i and j) can be described as follows: (1) segregation tendency is given by Wi < Pii and Wj < Pjj; (2) total demixing is obtained for Pii = Pjj = 1; (3) regular tendency is obtained if Wi < Pji < 1 and Wj < Pij < 1; and (4) the boundary between the last distribution labeled chaotic or random is obtained when Wi = Pji = Pii, Wj = Pij = Pjj with ΣWi = 1 and ΣPij = 1 (Reference Drits and TchoubarDrits & Tchoubar, 1990; Reference Sakharov and LansonSakharov & Lanson, 2013).
The fitting strategy is an approach used to determine the structural parameters of materials from experimental XRD data (Reference Oueslati, Mejri and AmaraOueslati et al., 2022a). It involves comparing the experimental diffractogram model with a theoretical model that is created using a principal interstratified structure. This theoretical model can be adjusted by introducing extra contributions, such as a mixed-layer structure, to account for any discrepancies between the experimental and theoretical models. The aim of this fitting process is to achieve an improved agreement between the theoretical and experimental models, which allows for the determination of the structural parameters of the material being studied.
The presence of two MLS does not imply that two particle populations exist physically in the sample (Reference Ammar, Oueslati, Chorfi and RhaiemAmmar et al., 2014a, Reference Ammar, Oueslati, Rhaiem and Amara2014b, Reference Ammar, Oueslati, Ben Rhaiem and Ben Haj Amara2014c; Reference Ferrage, Lanson, Sakharov and DritsFerrage et al., 2005a, Reference Ferrage, Lanson, Malikova, Plançon, Sakharov and Drits2005b; Reference LansonLanson, 2005; Reference Oueslati and MeftahOueslati & Meftah, 2018). Therefore, layers with a similar HS appear in different MLS, contributing to the diffracted intensity, and are expected to have identical properties such as chemical composition, layer thickness, and z-coordinates of atoms. The XRD modeling method’s details are explained extensively in previous work (Reference Ammar, Oueslati, Chorfi and RhaiemAmmar et al., 2014a, Reference Ammar, Oueslati, Rhaiem and Amara2014b, Reference Ammar, Oueslati, Ben Rhaiem and Ben Haj Amara2014c; Reference Ferrage, Lanson, Sakharov and DritsFerrage et al., 2005a, Reference Ferrage, Lanson, Malikova, Plançon, Sakharov and Drits2005b; Reference Manohar, Krishnan and AnirudhanManohar et al., 2002; Reference Oueslati and MeftahOueslati & Meftah, 2018; Reference Oueslati, Rhaiem and AmaraOueslati et al., 2012).
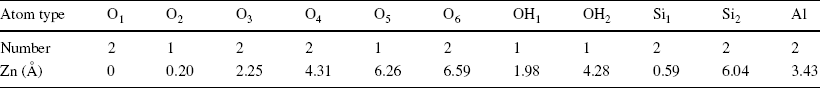
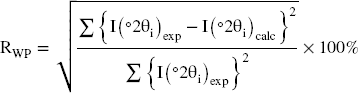
The z-coordinates in the T–O–T layer of the IS content (exchangeable cation, molecules, etc.) are optimized during the modeling process to reduce the disagreement between the theoretical and experimental findings (Table 2). This is controlled using an RWP unweighted factor, expressed by Reference LansonLanson (2011) and Reference Laverov, Yudintsev, Kochkin and MalkovskyLaverov et al. (2016) as:
Table 2 The types of atoms, their number, and their z-positioning along the c* axis for the case of a TOT phyllosilicate
To achieve optimal quantitative structural characterization of a given sample, it is necessary to search for agreement between the calculated profiles and the experimental profiles (Reference Bérend, Cases, François, Uriot, Michot, Masion and ThomasBérend et al., 1995; Reference Cases, Bérend, François, Uriot, Michot and ThomasCases et al., 1997; Reference Oueslati and MeftahOueslati & Meftah, 2018), regardless of the type of hydration state of the layers or the position of the exchangeable metal cations (located in the middle of the IS along the c* axis).
Modeling Strategy
Optimizing the structural parameters involves two steps. The first step is identifying the ‘modulation function,’ which is related to the positions of the characteristic XRD reflections. This is achieved by varying parameters such as the Wi proportions of different distances and Pij relative probabilities of succession between different layer types (i and j), as well as the
 average number of layers per stack. In the second step, adjustments are made to parameters such as the z-layer position atom composition along the c* axis, the number and z-position of the exchangeable cations, and the abundance and configuration of interlayer water molecules, to improve the agreement between experimental and calculated profiles. The aim is to reduce the RWP value to < 10%. The modeling strategy was summarized by Reference Oueslati, Mejri and AmaraOueslati et al. (2022a), and previous studies have highlighted the importance of considering the abundance and configuration of interlayer water molecules in the optimization process (Reference Ben Brahim, Besson and TchoubarBen Brahim et al., 1984; Reference AmaraBen Haj Amara, 1997; Reference Oueslati, Ben Rhaiem, Karmous, Naaman and Ben Haj AmaraOueslati et al., 2006; Reference Sakharov and DritsSakharov & Drits, 1973; Reference Sakharov and LansonSakharov & Lanson, 2013).
Results and Discussion
Semi-quantitative XRD Investigation of the Baseline Samples
The XRD experimental profile of the baseline SWy-Na (Fig. 2) of the reference (Reference Mejri, Oueslati, Haj and AmaraMejri et al., 2022a, Reference Mejri, Oueslati and Amara2022b) exhibited the presence of three characteristic reflections (n = 1, 2, and 4). The first reflection (n = 1) was observed at a position of 7.16°2θ (d 001 = 12.33 Å), suggesting the presence of a 1W HS (Table 3). The homogeneity of the observed character was verified by calculating the FWHM and ξ parameter value (Reference Ferrage, Kirk, Cressey and CuadrosFerrage et al., 2007a, Reference Ferrage, Kirk, Cressey and Cuadros2007b). The SWy-Na has been the subject of many studies as it was considered a reference sample (Reference Ahmed, Soliman and OthmanAhmed et al., 2021; Reference Altin, Ozbelge and DoguAltin et al., 1999a, Reference Altin, Ozbelge and Dogu1999b; Reference Alshabanat, Al-Arrash and MekhamerAlshabanat et al., 2013; Reference Ammar, Oueslati, Chorfi and RhaiemAmmar et al., 2014a, Reference Ammar, Oueslati, Rhaiem and Amara2014b, Reference Ammar, Oueslati, Ben Rhaiem and Ben Haj Amara2014c; Reference Bérend, Cases, François, Uriot, Michot, Masion and ThomasBérend et al., 1995; Reference Cases, Bérend, François, Uriot, Michot and ThomasCases et al., 1997; Reference Chalghaf, Oueslati, Ammar, Rhaiem and AmaraChalghaf et al., 2012; Reference Gregoire, Dazas, Leloup, Hubert, Tertre, Ferrage and PetitGregoire et al., 2020; Reference Hu, Zhu, Cai, Hu and FuHu et al., 2017; Reference Huber, Heck, Truche, Bouby, Brendlé, Hoess and SchäferHuber et al., 2015; Reference Ishidera, Okazaki, Yamada, Tomura and ShibutaniIshidera et al., 2022; Reference Jiang, Liu, Peng and ZhouJiang et al., 2021; Reference Karmous, Ben Rhaiem, Naamen, Oueslati and Ben Haj AmaraKarmous et al., 2006; Reference Kozaki, Sawaguchi, Fujishima and SatoKozaki et al., 2010; Reference Kraevsky, Tournassat, Vayer, Warmont, Grangeon, Wakou and KalinichevKraevsky et al., 2020; Reference Lahbib, Meftah, Mejri, Oueslati and AmaraLahbib et al., 2023; Reference Leong, Du, Au, Clode and LiuLeong et al., 2018; Reference Liu and YangLiu & Yang, 2022; Reference Liu, Zhang, Jiang, Li, Dai and JiaLiu et al., 2021; Reference Mejri, Oueslati and AmaraMejri et al., 2023; Reference Ohkubo, Okamoto, Kawamura, Guégan, Deguchi, Ohki, Shimizu, Tachi and IwadateOhkubo et al., 2018; Reference Oueslati and MeftahOueslati & Meftah, 2018; Reference Oueslati, Rhaiem and AmaraOueslati et al., 2012, Reference Oueslati, Ammar and Chorfi2015, Reference Oueslati, Mejri and Ben Haj Amara2022b; Reference Saravanan, Ramamurthy and MadrasSaravanan et al., 2015; Reference Sato, Watanabe and OtsukaSato et al., 1992; Reference Scholtzová and TunegaScholtzová & Tunega, 2019; Reference Segad, Jonsson, Åkesson and CabaneSegad et al., 2010; Reference Shi, Zhong, Wang and FengShi et al., 2022; Reference Tan, Li, Xia, Li, Song, Wu and FaríasTan et al., 2022; Reference Tournassat, Grangeon, Leroy and GiffautTournassat et al., 2013, Reference Tournassat, Davis, Chiaberge, Grangeon and Bourg2016; Reference Wakou and KalinichevWakou & Kalinichev, 2012; Reference Wu, Bi and LiWu et al., 2022; Reference Yan and ZhangYan & Zhang, 2021; Reference Yotsuji, Tachi, Sakuma and KawamuraYotsuji et al., 2021; Reference Zhang, Liu, Tinnacher and TournassatZhang et al., 2018, Reference Zhang, Liu, Dai, Zhu, Liu and Jia2022; Reference Zhang, An, Li, Liu, Chen, Ren, Wang, Zhang and WangZhang et al., 2020; Reference Zhu, Iroh, Rajagopolan, Aykanat and VaiaZhu et al., 2022).
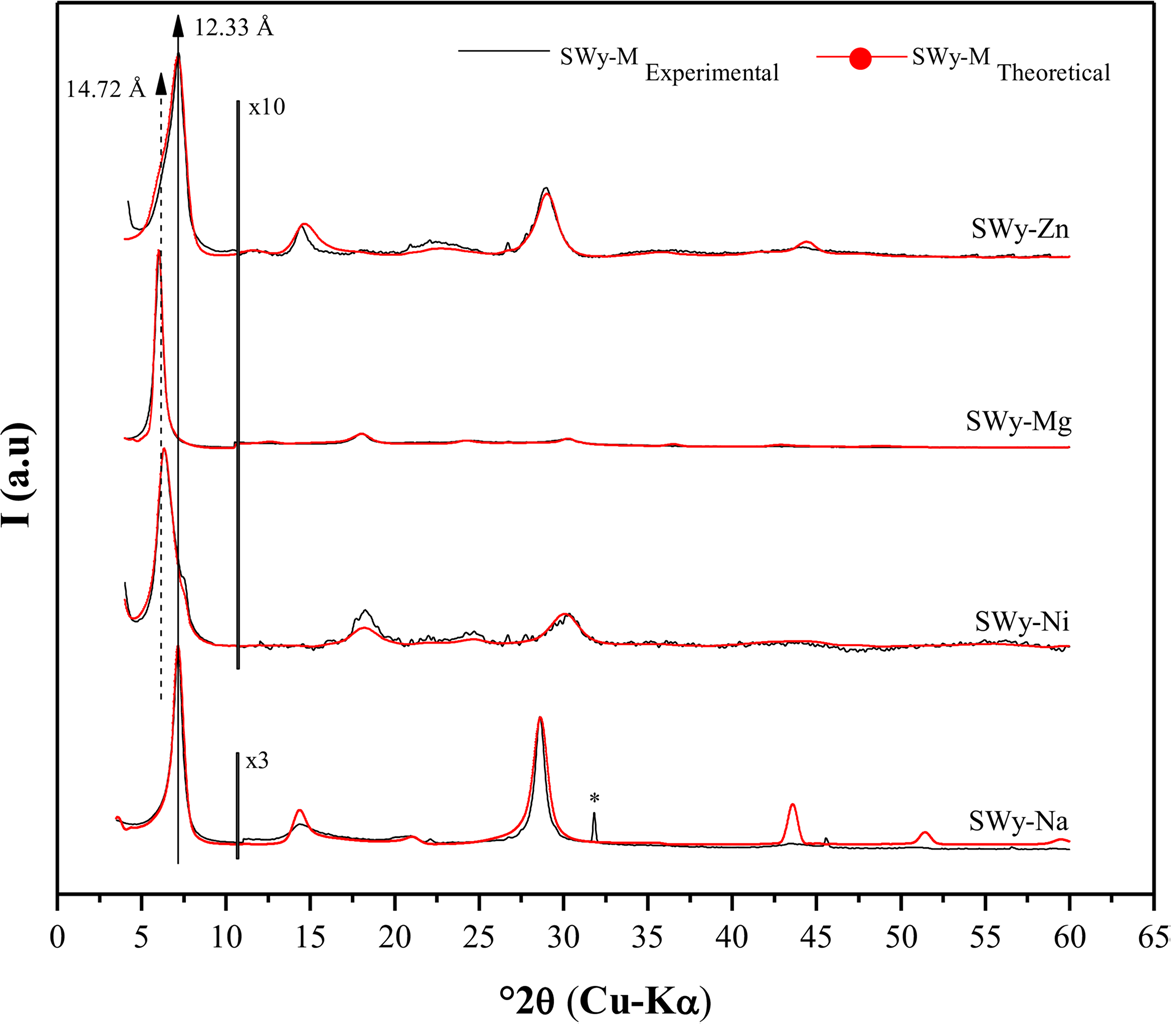
Fig. 2 Modeling of the experimental XRD patterns for the starting sample SWy-Na (Mejri et al., 2022) and the reference samples SWy-Ni, SWy-Mg, and SWy-Zn. (*) Halite, NaCl
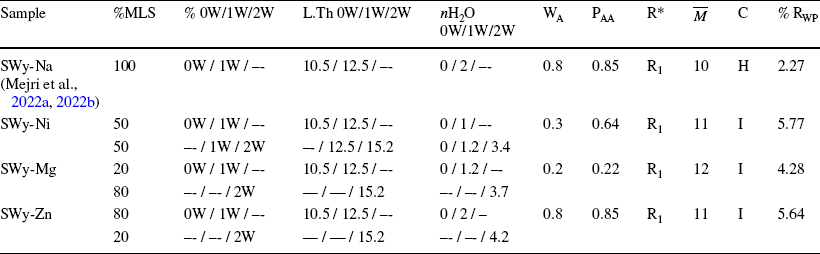
Table 3 Qualitative X-ray analysis of the starting sample, SWy-Na (Reference Mejri, Oueslati, Haj and AmaraMejri et al., 2022a, Reference Mejri, Oueslati and Amara2022b), and the reference samples SWy-Ni, SWy-Mg, and SWy-Zn
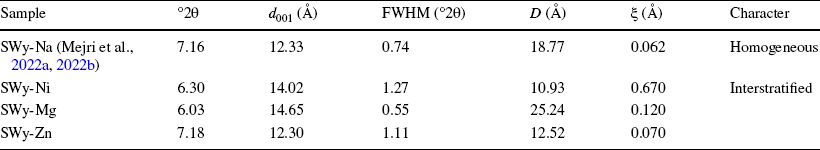
°2θ Bragg’s angle, d 001 Basal distance of the 1st reflection, D average crystalline size, FWHM Full Width at Half Maximum, ξ Rationality deviation parameters
The nickel (SWy-Ni)- and magnesium (SWy-Mg)-saturated samples exhibited four characteristic reflections (n = 1, 2, 3, and 5) in their X-ray experimental patterns. The first reflections (n = 1) were located at ~ 6°2θ (d 001 ≈ 14.7 Å), indicating a mixed hydration state between 1 and 2W (Fig. 2). This suggested a heterogeneous (interstratified) character and an incomplete CEP (Table 3). These findings were consistent with previous research (Reference Ammar, Oueslati, Chorfi and RhaiemAmmar et al., 2014a, Reference Ammar, Oueslati, Rhaiem and Amara2014b, Reference Ammar, Oueslati, Ben Rhaiem and Ben Haj Amara2014c, Reference Ammar, Oueslati and Ben Haj Amara2018; Reference Karmous, Ben Rhaiem, Naamen, Oueslati and Ben Haj AmaraKarmous et al., 2006; Reference Oueslati, Ben Rhaiem, Karmous, Naaman and Ben Haj AmaraOueslati et al., 2006).
In the zinc-saturated sample (SWy-Zn), an asymmetry was observed for the main 001 reflection, which was located at 7.18°2θ (d 001 ≈ 12.3 Å) due to the presence of sodium residue resulting from the starting sample SWy-Na (Fig. 2). Additionally, a shoulder toward the small angles around 5.9°2θ with d 001 ≈ 15 Å was observed, which was indicative of a minor 2W HS presence allocated to the Zn2+ cation in IS (Reference Jiang, Liu, Peng and ZhouJiang et al., 2021; Reference Oueslati, Mefath, Rhaiem and AmaraOueslati et al., 2009). In general, the perception of asymmetric 001 reflections indicated the appearance of a mixed HS in the crystallite and suggested a partial CEP.
(level2)Modeling of XRD Profiles of the Samples SWy-Na, SWy-Ni, SWy-Mg, and SWy-Zn.
Structural optimization using the X-ray modeling approach of the SWy-Ni, SWy-Mg, and SWy-Zn reference samples (Fig. 2) confirmed the heterogeneous character of the samples, with the presence of an MLS formed by 0W, 1W, and 2W, indicating an incomplete CEP (Reference LansonLanson, 2005). The two hydration states, 0W and 1W, were attributed to the sodium residue from the starting sample SWy-Na. The IS was filled by the ‘M’ metal cation (Ni, Mg, and Zn) in the case of 2W.
According to bibliographic outcomes, only one water molecule sheet (H2O) was detected in the middle of the IS along the c* axis for the 1W phase, unlike the 2W phases where two water sheets enveloped the CC placed in the middle of the IS. The absence of H2O in the IS was claimed for the dehydrated 0W phases (Reference Ammar, Oueslati, Chorfi and RhaiemAmmar et al., 2014a, Reference Ammar, Oueslati, Rhaiem and Amara2014b, Reference Ammar, Oueslati, Ben Rhaiem and Ben Haj Amara2014c; Reference Bérend, Cases, François, Uriot, Michot, Masion and ThomasBérend et al., 1995; Reference Cases, Bérend, François, Uriot, Michot and ThomasCases et al., 1997; Reference Ferrage, Lanson, Sakharov and DritsFerrage et al., 2005a, Reference Ferrage, Lanson, Malikova, Plançon, Sakharov and Drits2005b, Reference Ferrage, Lanson, Michot and Robert2010; Reference Manohar, Krishnan and AnirudhanManohar et al., 2002; Reference Oueslati, Rhaiem and AmaraOueslati et al., 2012; Reference Sato, Watanabe and OtsukaSato et al., 1992). The average number of layers per crystallite was 10. Acceptable RWP confidence factor values were obtained, reflecting the high quality of the fitting (Table 4).
Table 4 Extraction of all structural parameters of the SWy-Na (Reference Mejri, Oueslati, Haj and AmaraMejri et al., 2022a, Reference Mejri, Oueslati and Amara2022b), SWy-Ni, SWy-Mg, and SWy-Zn samples, via the modeling approach
MLS Mixed Layer Structure, 0W/1W/2W Layer hydration state, L.Th Layer Thickness (Å), nH2O Number of water molecules per half-cell, WA Abundance of layer type A, PAA Relative probabilities of succession law between two-layers type A, R* Reichweite factor R0 and R1 describe the MLS with random interstratifications or with partial segregation, respectively,
 Average number of sheets per stack, C Character: H Homogeneous, I Interstratified, RWP Confidence factor
Semi-quantitative Description of XRD Analysis after Applying Second-Order Coupling Stress
Case of the SWy-Ni samples
Based on the X-ray experimental results for the SWy-Ni samples, which were subjected to varying conditions of pH, temperature, and duration (pH = 2; T = 50°C; t = 5 h ⟶ pH = 4; T = 100°C; t = 15 h), an asymmetry was observed for the main 001 reflections at 5.8°2θ with d 001 ≈ 15 Å, indicating the presence of 2W, filled by Ni2+ cations in the middle of IS and bounded between two sheets of water. A shoulder toward the wide angles around 7°2θ (d 001 ≈ 12.6 Å) was also observed and was attributed to excess salt in the starting sample SWy-Na. The asymmetry of the 001 reflections was reflected in large values of FWHM and ξ, indicating the appearance of a set of hydration states in the mineral and an incomplete CEP. However, for samples with higher pH, temperature, and duration values (pH = 5; T = 125°C; t = 20 h / pH = 6; T = 150°C; t = 25 h), the absence of the shoulder toward the wide angles (linked to the sodium residue) was observed, and the symmetry of the 001 lines was probably due to a complete CEP (Table 5).
Table 5 Qualitative X-ray analysis of the samples SWy-Ni, SWy-Mg, and SWy-Zn
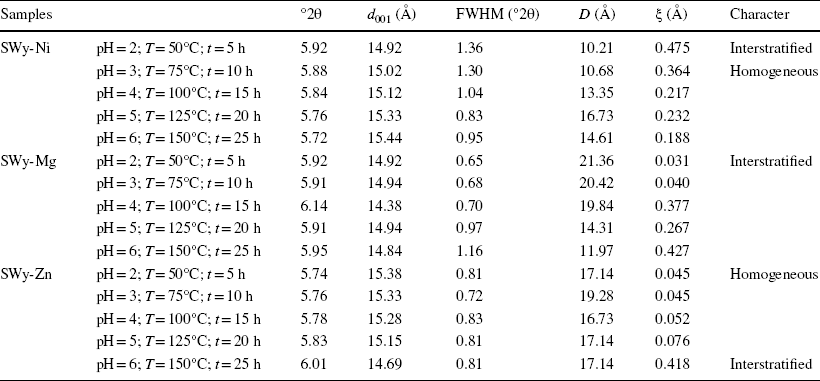
°2θ Bragg angle, d 001 basal distance of the 1st reflection, D average crystalline size, FWHM full width at half maximum, ξ rationality deviation parameters
Case of the SWy-Mg samples
The X-ray experimental models for SWy-Mg samples obtained at low values of pH, T, and t (pH = 2; T = 50°C; t = 5 h ⟶ pH = 4; T = 100°C; t = 15 h) showed 001 reflections (n = 1) localized at ~5.9°2θ (d 001 ≈ 14.9 Å), indicating the appearance of two hydration states (1W and 2W) within the stacks accompanied by partial cation exchange (Reference Ammar, Oueslati and Ben Haj AmaraAmmar et al., 2018). The Mg2+ compensating cation could be distinguished from the starting sodium cation Na+ by XRD analysis at room conditions in this case (Table 5). For the other complexes (pH = 5; T = 125°C; t = 20 h / pH = 6; T = 150°C; t = 25 h), an increase in the FWHM value was observed, along with the creation of a stacking toward the wide angles (7.15°2θ ⟶ d 001 = 12.35 Å), which was attributed to the sodium residue from the starting sample SWy-Na (Fig. 4).
Case of the SWy-Zn samples
The experimental X-ray diffractogram profiles of SWy-Zn samples (Fig. 5) revealed that, for most samples (pH = 2; T = 50°C; t = 5 h ⟶ pH = 5; T = 125°C; t = 20 h), the main 001-reflection was situated at ~ 5.8°2θ (d 001 ≈ 15.2 Å), indicating a 2W hydration state. This probably reflects a complete CEP (Reference Oueslati, Rhaiem and AmaraOueslati et al., 2011). However, there was a slight deviation in the intensity of the 001-reflections toward the wide angles with an increase in the applied coupling constraint intensity. The profile of the last sample (pH = 6; T = 150°C; t = 25 h) was positioned at ~ 6°2θ (d 001 ≈ 14.7 Å), which was interpreted as the appearance of two hydration states (1W and 2W – interstratified structure), estimated by partial cation exchange, knowing that the zinc (Zn2+) hydrate was bound to two layers of water 2W (~ 15 Å) (Table 5).
XRD Modeling Profiles after Applying Second-Order Coupling Stress
Case of the SWy-Ni samples
The quantitative XRD analysis of the SWy-Ni series indicated the appearance of two different hydration states as the amplitude of applied stresses increased (Fig. 3). The complexes with small values of pH, T, and t (pH = 2; T = 50°C; t = 5 h → pH = 4; T = 100°C; t = 15 h) indicated the emergence of two hydration states (i.e. 1W → d 001 ≈ 12.2 Å and 2W → d 001 ≈ 15.2 Å), with 2W being the dominant state. The CEC of the results obtained was satisfied partially by Na+ and Ni2+ cations. This was because, under ambient conditions, sodium hydrated to form a single water layer (1W) (Reference Oueslati and MeftahOueslati & Meftah, 2018), while nickel hydrated with two water layers (2W). When the applied stress strength was increased, the interstratification spacing (IS) expanded, with the d 001 value changing from 15 to 15.4 Å for samples with pH = 5, T = 125°C, and t = 20 h and pH = 6, T = 150°C, and t = 25 h. This expansion occurred due to the transition from an interstratified 1W/2W phase to a harmonically stacked 2W phase, which was saturated by Ni2+ cations only. The widening of the IS was attributed to the prolonged contact time (t ≈ 20 to 25 h) of the soil solution (NiCl2) with the sample (Table 6).
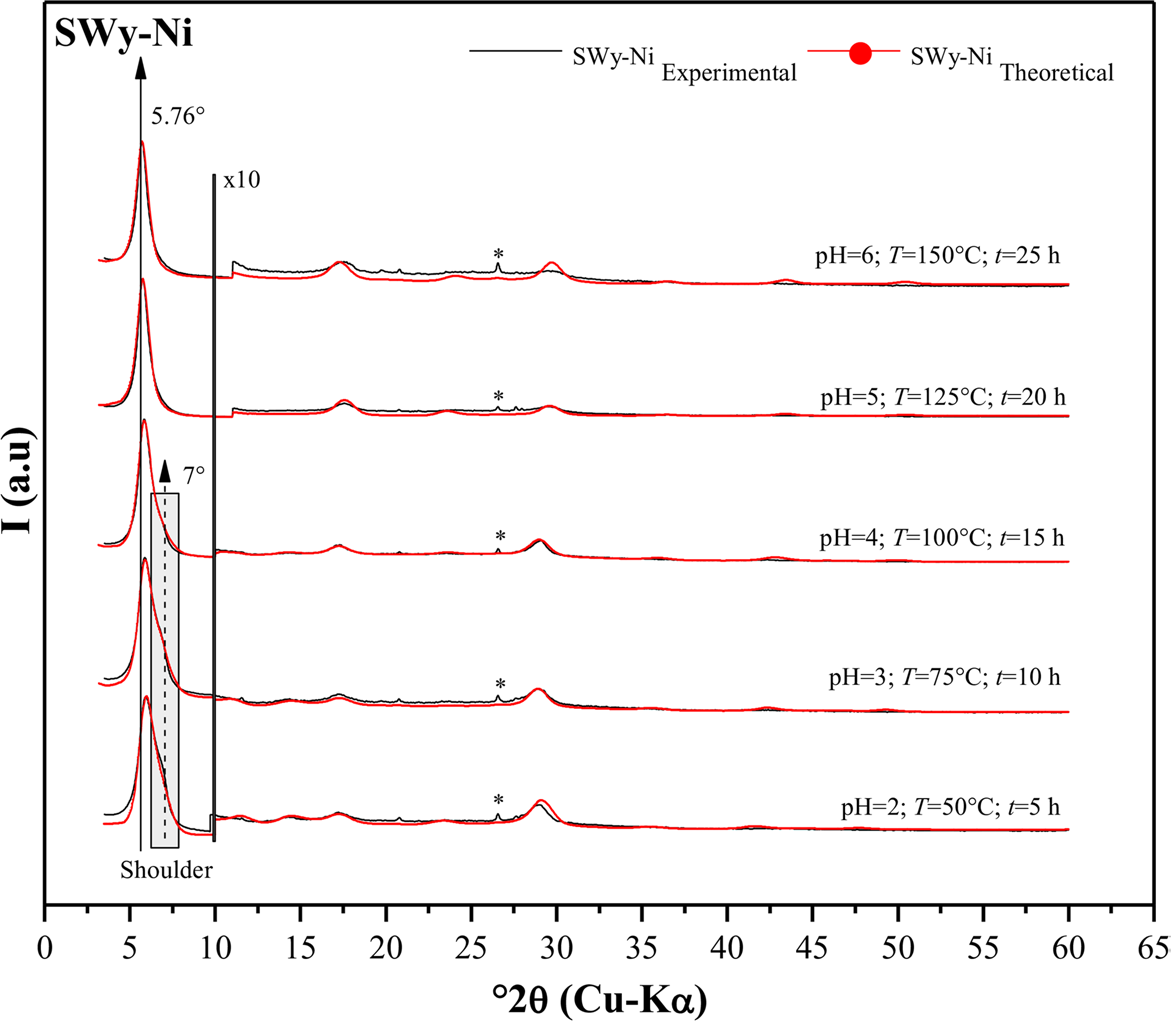
Fig. 3 Modeling of the experimental XRD patterns for SWy-Ni samples. (*) Halite, NaCl
Table 6 Extraction of all structural parameters of the SWy-Ni, SWy-Mg, and SWy-Zn samples, via the modeling approach
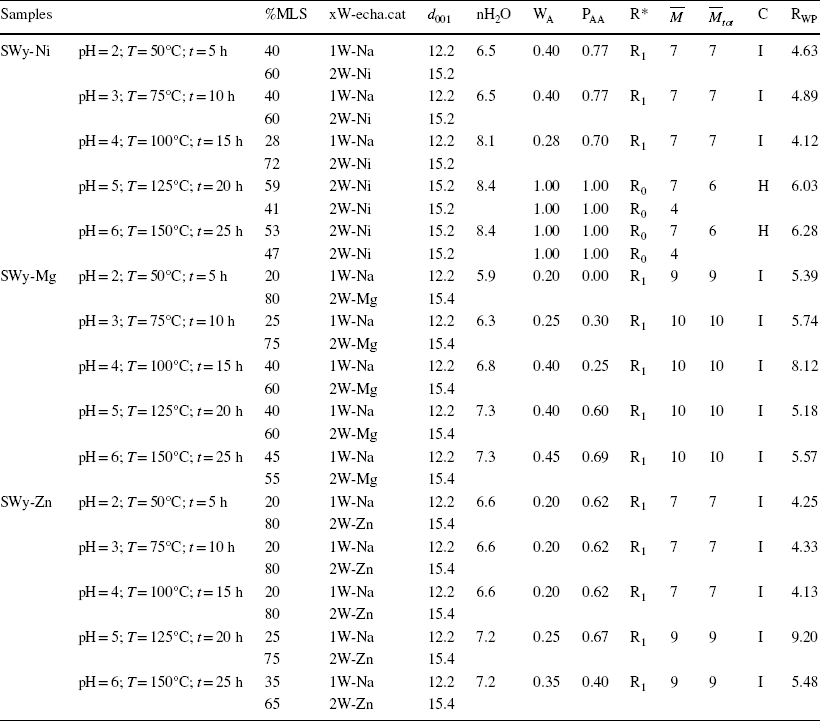
MLS Mixed Layer Structure, xW-echa.cat Layer type and associated exchangeable cation, d
001 interlamellar distance (Å); nH2O number of water molecules per half-cell, WA abundance of layer type A, PAA relative probabilities of succession law between two-layers type A, R* Reichweite factor R0 and R1 describe the MLS with random interstratifications, or with partial segregation/order respectively,
 average number of sheets per stack,
 total average number of sheets per stack, C Character: H Homogeneous, I Interstratified, RWP Confidence factor
Case of the SWy-Mg samples
Theoretical models obtained through modeling (Fig. 4) confirmed the heterogeneous character of the samples by establishing a correlation between two types of hydration phases, namely 1W/2W (intermediate phase), regardless of the intensity of the applied external stress. Specifically, the minor contribution of the 1W phase increased from 20 to 45% as the intensity of the applied external stress rose (pH = 2; T = 50°C; t = 5 h ⟶ pH = 6; T = 150°C; t = 25 h). This increase was attributed primarily to the presence of sodium residue in the SWy-Na starting sample. On the other hand, the major hydration state observed in the calculated profile was the 2W phase, which was associated with the layer fragment saturated with the bivalent cation Mg2+. This fluctuation in weighting suggests an incomplete (partial) CEP (d 001 ≈ 14.8 Å < 15 Å), which aligned with the qualitative analysis. Additionally, the slight shrinkage of the IS (d 001 ≈ 14.92 Å ⟶ d 001 ≈ 14.84 Å) was due probably to the temperature increase during the CEP (Table 6).
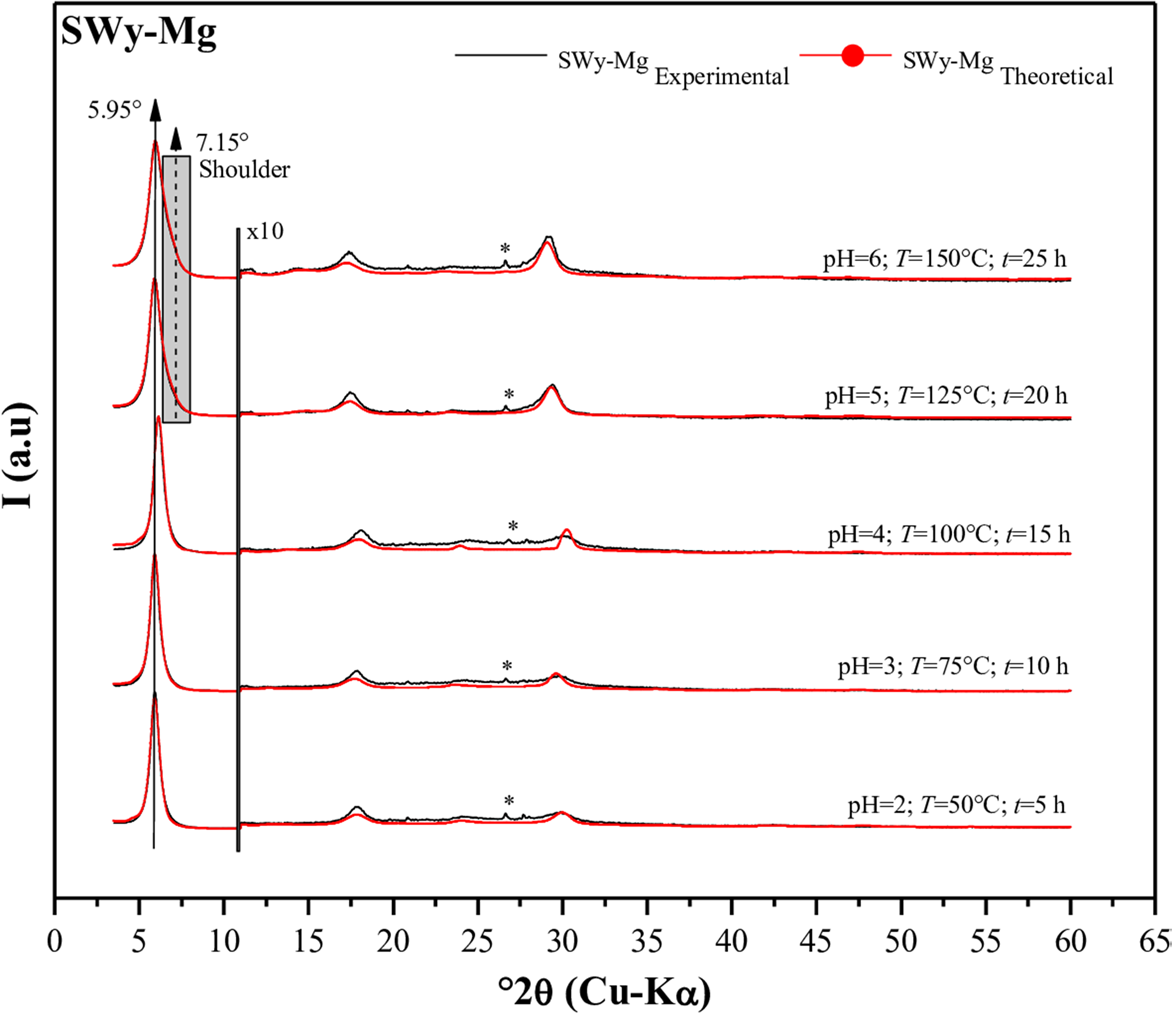
Fig. 4 Modeling of the experimental XRD patterns for SWy-Mg samples. (*) Halite, NaCl
Case of the SWy-Zn samples
The refinement of the experimental model (Fig. 5) uncovered the presence of two types of layers with a similar stacking mode (R1), as determined by the modeling. This mixed-layer system (MLS) consists of two hydration states (Reference LansonLanson, 2005), namely: (1) 1W with d 001 = 12.2 Å, and (2) 2W with d 001 = 15.4 Å. Throughout the entire series of experiments (ranging from pH = 2; T = 50°C; t = 5 h to pH = 6; T = 150°C; t = 25 h) a heterogeneous character was observed, characterized by a minor presence of the ubiquitous 1W HS (~20–35% abundance). This 1W state was saturated with the Na+ cation, as reported by SWy-M (Reference Oueslati and MeftahOueslati & Meftah, 2018). Conversely, the major phase observed was the 2W phase (80–65% abundance), associated with the elemental part where the CEC was due probably to the temperature increase during the CEP (Table 6) saturated with the Zn2+ divalent cation (Reference Tan, Zhang, Zhang, Xie and LiuTan et al., 2008; Reference Oueslati, Mefath, Rhaiem and AmaraOueslati et al., 2009; Shi et al., 2010). This indicated an incomplete CEP. During the CEP, the increase in temperature (T ≈ 50°C ⟶ 150°C) along with the variation in the pH of the SS (pH ≈ 2 ⟶ 6) and the duration of contact (t ≈ 5 h ⟶ 25 h) resulted in the closure (shrinkage) of the IS. This closure was evident from the decrease in the value of d 001 (Table 6). It is important to note that, for all the samples examined in the current study, the Debye–Waller temperature factor (the mean square displacement of an atom from the ideal position in the structure) exhibited a variation ranging from 2.3 to 10.9 Å2 (Reference Ferrage, Lanson, Sakharov and DritsFerrage et al., 2005a, Reference Ferrage, Lanson, Malikova, Plançon, Sakharov and Drits2005b, Reference FerrageFerrage, 2016).
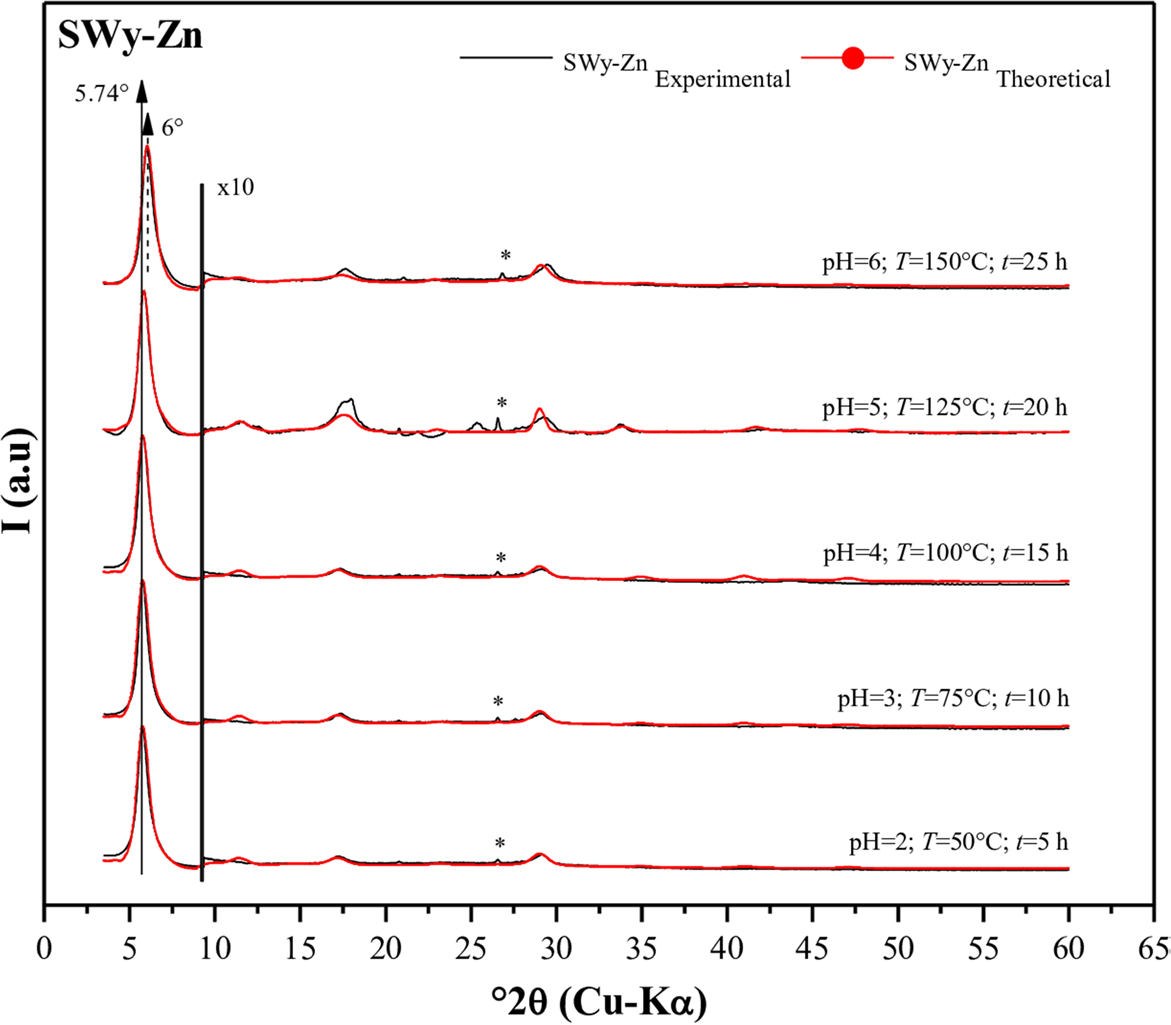
Fig. 5 Modeling of the experimental XRD patterns for SWy-Zn samples. (*) Halite, NaCl
In this study, the samples saturated with magnesium and zinc demonstrated similar hydration behavior under increasing imposed coupling constraint intensity, contrasting with the sample saturated with nickel. The interlayer space (IS) thickness decreased for SWy-Mg and SWy-Zn, resulting in a reduction of the 2W phase and an increase in the 1W phase. This indicated an incomplete cation exchange process (CEP). Conversely, for SWy-Ni, the IS thickness increased, suggesting a transition from an intermediate hydration state (1W/2W) to a homogeneous state (2W). This observation was confirmed by modeling and the absence and/or disappearance of the sodium residue.
In this work, two hypotheses were developed to explain the hydration behavior of the samples:
(1) The first hypothesis suggests that hydration behavior of the SWy-Mg and SWy-Zn series was primarily influenced by the remarkable increase in temperature, while the impact of modifying the pH value of the soil solution (SS), and the duration of contact can be ignored. Previous studies (Reference Chalghaf, Oueslati, Ammar, Rhaiem and AmaraChalghaf et al., 2013; Reference Cui, Zhang and HanCui et al., 2020; Reference Meftah, Oueslati and AmaraMeftah et al., 2010, Reference Meftah, Oueslati and Amara2011; Reference Momeni, Bayat and AjalloeianMomeni et al., 2022; Reference Tlemsani, Taleb, Piraúlt-Roy and TalebTlemsani et al., 2022) demonstrated that the addition of an acidic and/or basic additive (HCl/NaOH) induced significant change in the mineral structure within a pH range of ~ 8–11 (basic medium). However, in the present study, the pH of the SS varied from 2 to 6 and, thus, the impact of pH variation was considered negligible. Similarly, the duration of the CEP was also considered to be negligible. This conclusion was supported by the observation that, despite the relatively long contact time (~ 48 h) during the CEP, the d 001 value of the reference sample SWy-Mg (Table 4) remained at ~14.65 Å, indicating partial cation exchange. The modeling further confirmed the presence of three hydration states 0W, 1W, and 2W with percentages of 6, 14, and 80%, respectively. This finding was consistent with the SWy-Mg sample (pH = 2; T = 50°C; t = 5 h) where the CEP lasted only 5 h (Tables 5 and 6) and resulted in an interlamellar distance of 14.9 Å, indicating incomplete cationic exchange. This condition was characterized by the appearance of two phases (1W ≈ 20% and 2W ≈ 80%). The similarity observed in these results challenges the assumption that the structure of the smectite (Sme) evolves with variations in the duration of the CE.
(2) The second hypothesis based on the present study considers the relationship between the ionic potential (IP) and electronegativity (EN) of different samples. SWy-Mg and SWy-Zn, which have the lowest IP values of 2.78 and 2.70 eV, respectively (Reference ShannonShannon, 1976), display a similar hydration behavior (d 001 ↘) as the imposed constraint strength increased. EN also followed the same trend, with SWy-Mg having an EN of 1.31 and SWy-Zn an EN of 1.65 (Fig. 6). In contrast, for SWy-Ni, increasing the coupling constraint intensity resulted in the expansion of the interlayer spacing (IS) (d 001 ↗), which was attributed to its high IP value. For larger values, the IP indicated a greater affinity of the cation for water, and as water migrates in the IS, the compensating cations M2+ also migrate, leading to IS swelling. It was noteworthy that the IP value for Ni-saturated Mnt was 2.90 eV (IP – SWy-Ni > > IP – SWy-Mg > IP – SWy-Zn), and EN = 1.91 (EN – SWy-Ni > > EN – SWy-Zn > EN – SWy-Mg). This hypothesis aligned with a similar study by Reference Mejri, Oueslati, Haj and AmaraMejri et al., (2022a, Reference Mejri, Oueslati and Amara2022b), which investigated the influence of coupling first-order constraints (SS pH variation and thermal gradient) on three different metal cations (Co2+, Cu2+, and Ba2+). The study demonstrated that Mnt samples saturated with compensating cations (SWy-Co and SWy-Cu) possessing larger IP and EN values (IP – SWy-Co = 3.08 eV > IP – SWy-Cu = 2.74 eV > > IP – SWy-Ba = 1.48 eV et EN – SWy-Co = 1.88 ≈ EN – SWy-Cu = 1.90 > > EN – SWy-Ba = 0.89) exhibited a specific hydrous behavior, characterized by the expansion of IS (Fig. 7).
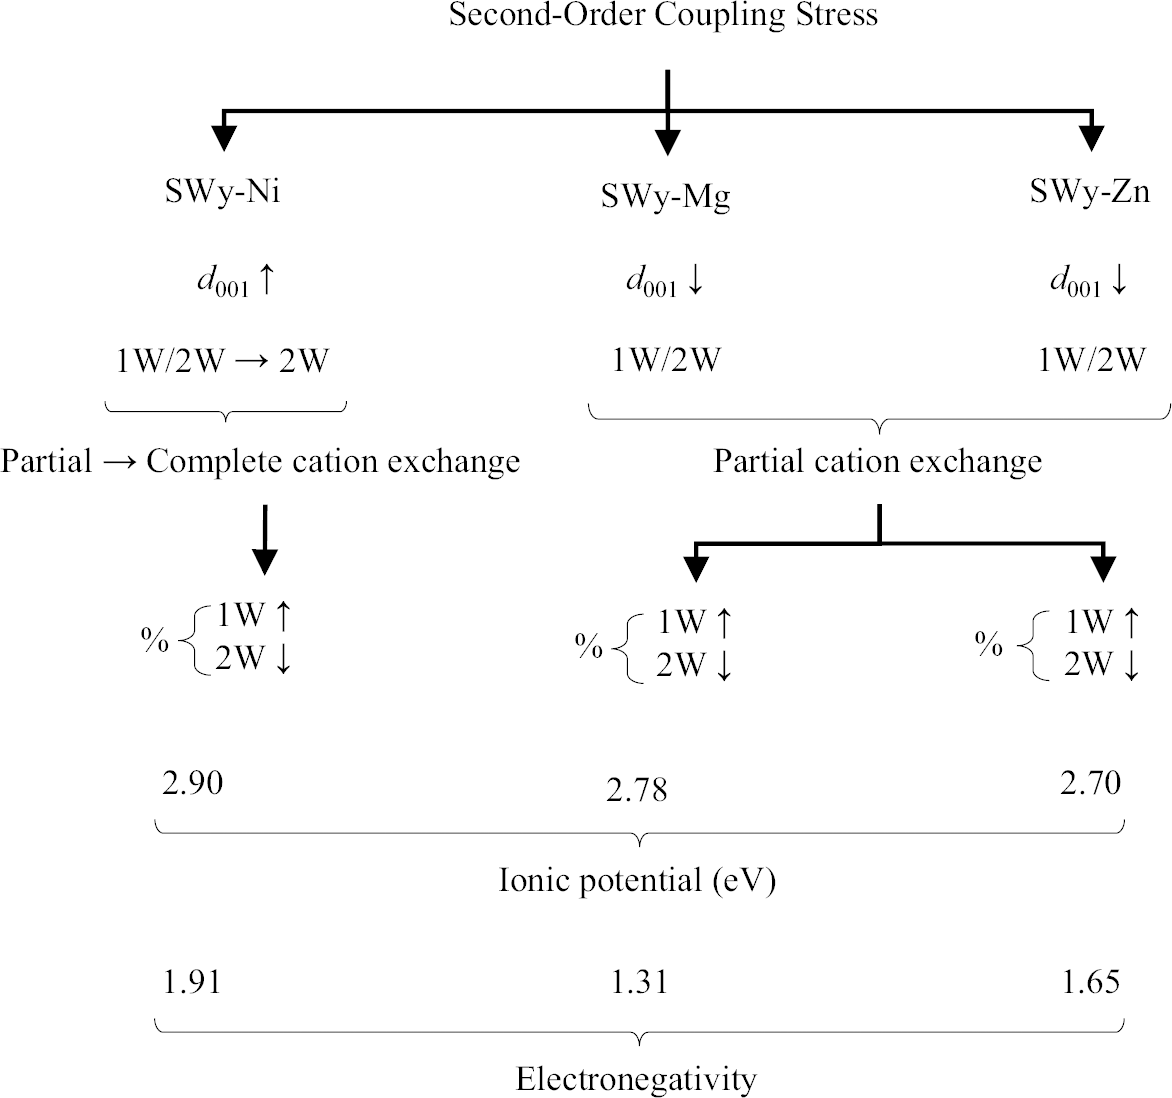
Fig. 6 Summary of the water behavior of SWy-Ni, SWy-Mg, and SWy-Zn samples under the effect of second-order coupling stress applied as a function of IP and EN, via an XRD modeling approach (Reference ShannonShannon, 1976)
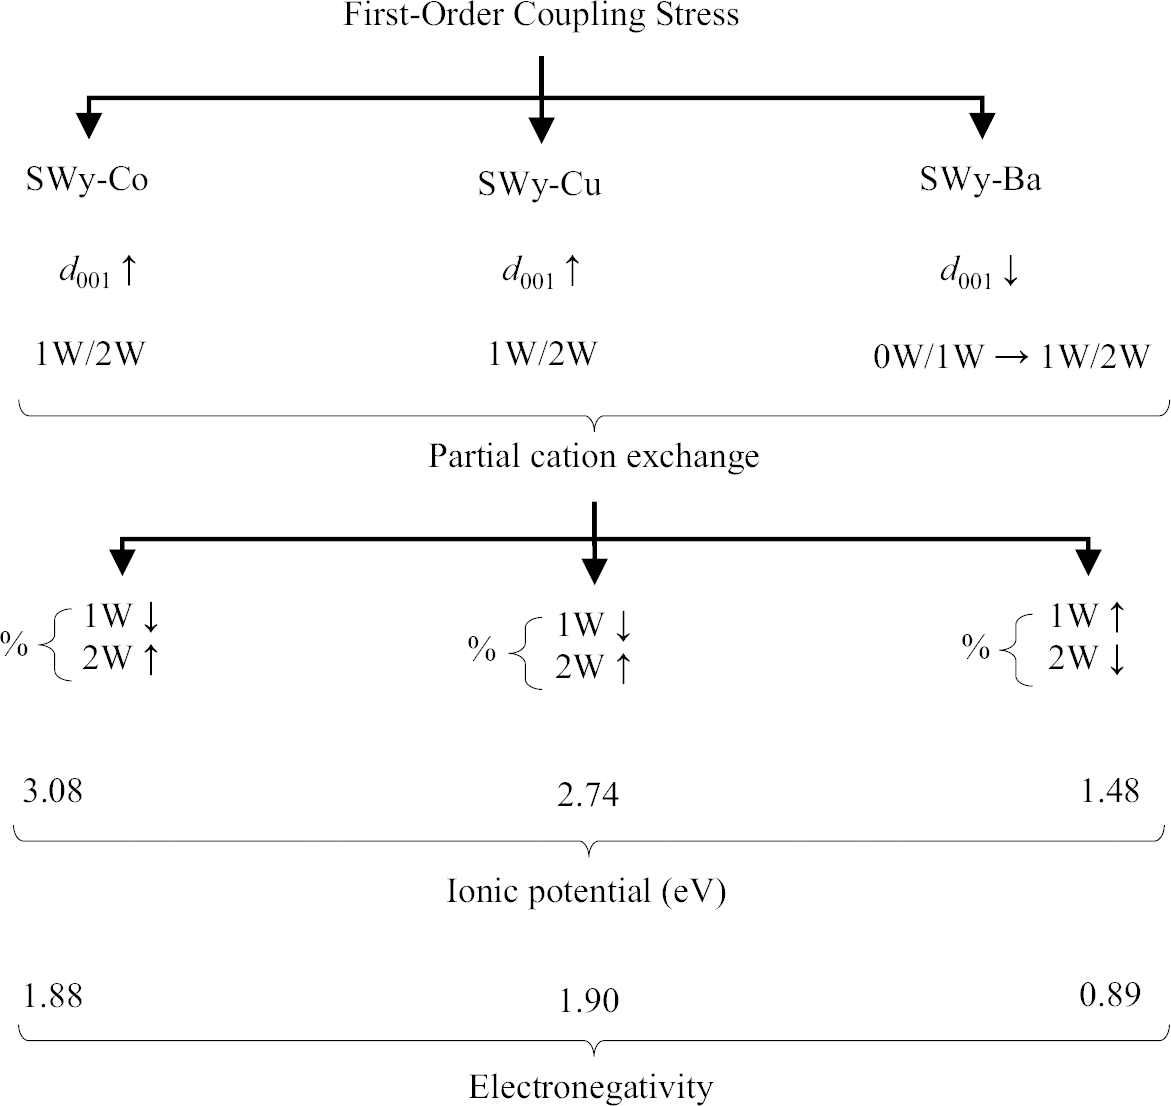
Fig. 7 Summary of the water behavior of SWy-Co, SWy-Cu, and SWy-Ba samples under the effect of first-order coupling stress applied as a function of IP and EN, via an XRD modeling approach (Mejri et al., 2022; Reference ShannonShannon, 1976)
The increase in the percentage of the 2W phase was attributed to bivalent cations hydrating at two water layers. This leads to the development of an electronegativity limit (Fig. 8) that describes the hydrous behavior of Mnt saturated with metal cations (SWy-M) when subjected to similar external pressures with varying intensities.
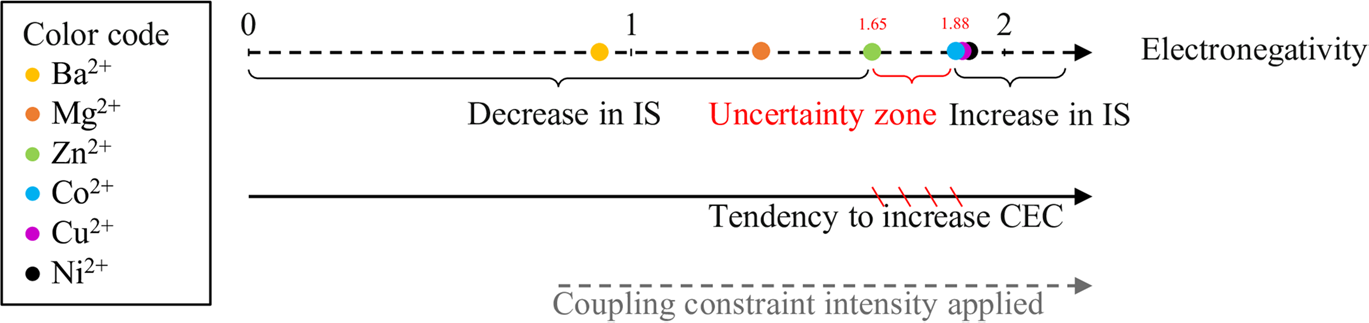
Fig. 8 Limit of the CEP as a function of the electronegativity of the compensating cations (Mejri et al., 2022; Reference ShannonShannon, 1976)
The electronegativity limit defines the point at which layers of Mnt saturated with metal cations (SWy-M) start to open or close based on specific EN values (layer opening > 1.88 and layer closing < 1.65). An area of ambiguity exists between the values of 1.65 and 1.88 where the hydration behavior is not well understood. Therefore, additional experiments using different cations with varying IP and EN values should be conducted to gain further insight into this range of ambiguity.
Despite the originality of the first hypothesis, the rest of the work adopted the second idea because it seemed more logical.
It is important to note that the saturation of the monohydrated interlayers (1W) can occur not only with sodium (Na+) but also with compensating cations such as Ni2+, Mg2+, or Zn2+, depending on variations in the relative humidity levels (Reference Ammar, Oueslati, Chorfi and RhaiemAmmar et al., 2014a, Reference Ammar, Oueslati, Rhaiem and Amara2014b, Reference Ammar, Oueslati, Ben Rhaiem and Ben Haj Amara2014c; Reference Ferrage, Lanson, Sakharov and DritsFerrage et al., 2005a, Reference Ferrage, Lanson, Malikova, Plançon, Sakharov and Drits2005b; Reference Oueslati, Karmous, Rhaiem, Lanson and AmaraOueslati et al., 2007, Reference Oueslati, Rhaiem and Amara2012). Because the RH was not taken into account during the acquisition of XRD data at the laboratory scale in this study, the 1W hydration phases were considered to be saturated exclusively with monovalent cations, while the 2W hydration phases were saturated exclusively with divalent cations. It is important to emphasize that these models are approximate, where everything is relative.
Evolution of the Water Molecule Abundances versus Coupling Constraint Strength
The variation in the amount of nH2O affected directly the XRD profiles and influenced the higher-order 00l reflections (e.g. 002, 003, 004, 005, …) of the modeling approach (Reference Oueslati, Mejri and AmaraOueslati et al., 2022a). The positioning and amount of H2O depend on the hydration state (0W, 1W, 2W, 3W, and/or 4W), the type of CC (monovalent, divalent, trivalent, …) in the clay structure, as well as its position and charge (Reference Babel and KurniawanBabel & Kurniawan, 2003; Reference Bérend, Cases, François, Uriot, Michot, Masion and ThomasBérend et al., 1995; Reference Bergaya and LagalyBergaya & Lagaly, 2013; Reference Cases, Bérend, François, Uriot, Michot and ThomasCases et al., 1997; Reference FerrageFerrage, 2016; Reference Ferrage, Lanson, Michot and RobertFerrage et al., 2010; Reference Komadel, Bujdák, Madejová, Šucha and ElsassKomadel et al., 1996; Reference Kozaki, Sawaguchi, Fujishima and SatoKozaki et al., 2010; Reference Sato, Watanabe and OtsukaSato et al., 1992; Reference Sun, Hirvi, Schatz, Kasa and PakkanenSun et al., 2015).
In the present case study, the coupling of the external second-order constraints resulted in fluctuations in the nH2O value. The water affinity of the exchangeable cation (EC) was related directly to the ionic potential (IP), which was defined by the ratio between the cation valence and its ionic radius (Reference ShannonShannon, 1976). An increase in IP led to an increase in the water affinity of the cation. The compensating cations in this study (Ni2+, Mg2+, and Zn2+) had high affinities (IP—SWy-Ni = 2.90 eV > > IP—SWy-Mg = 2.78 eV > IP—SWy-Zn = 2.70 eV), resulting in an homogeneous 2W HS and two heterogeneous 1W/2W states, respectively (Reference Bérend, Cases, François, Uriot, Michot, Masion and ThomasBérend et al., 1995; Reference Cases, Bérend, François, Uriot, Michot and ThomasCases et al., 1997). In contrast, monovalent cations (i.e. Na+ and Cs+) have low water affinity, which was reflected by a 1W HS state. Quantitative analysis using XRD showed a slight increase in the amount of nH2O per half-unit cell (Fig. 9) as a function of the increase in the applied constraints (second-order coupling constraint) for the three series (SWy-Ni, SWy-Mg, and SWy-Zn). These results were predictable, following the increase in temperature, which was automatically affected by the CEC and the IS closure.
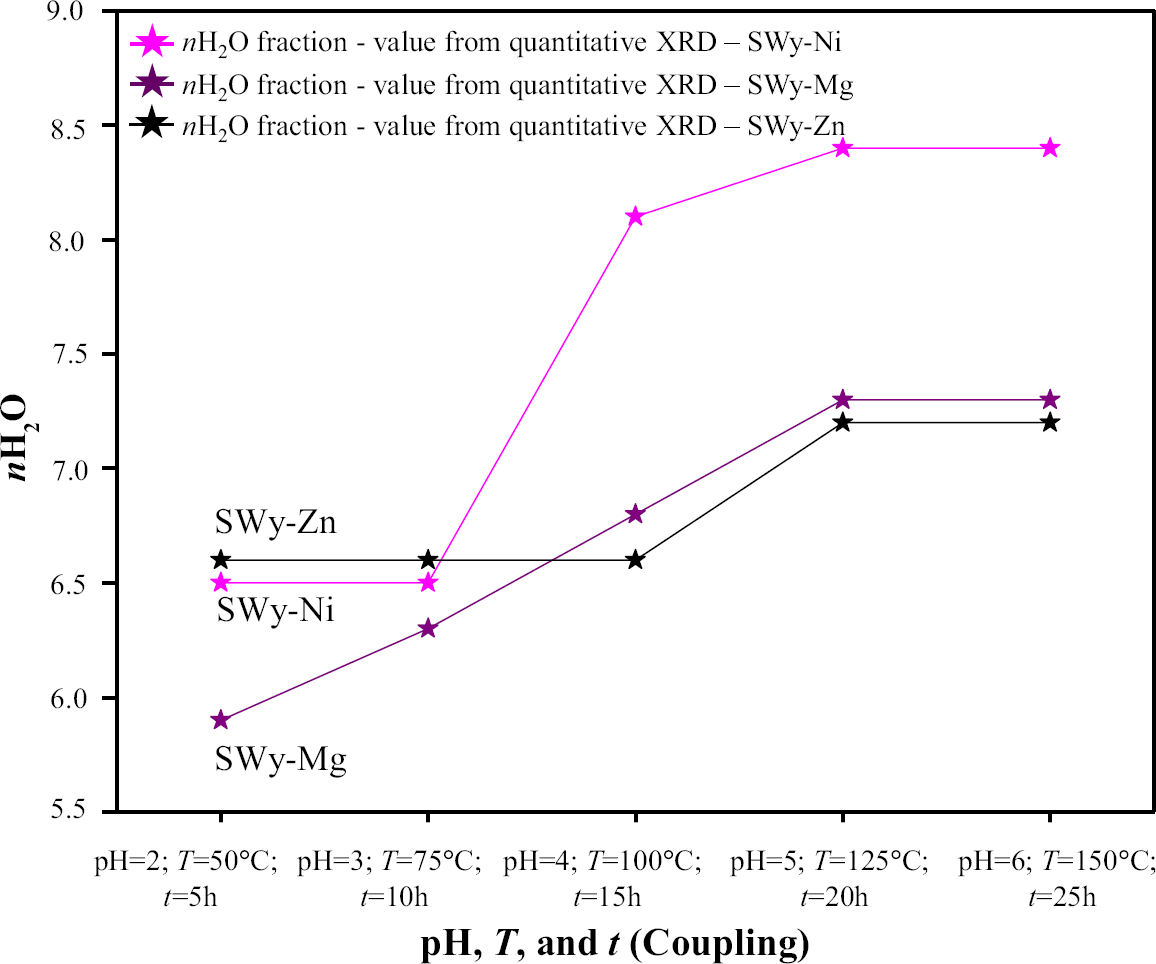
Fig. 9 The evolution of the abundance of the nH2O as a function of the intensity of the external constraints applied for the SWy-Ni, SWy-Mg, and SWy-Zn series
Evolution of the 1W and 2W Abundances versus Constraint Strength
The graph in Fig. 10 was labeled as the ‘water footprint’ (WF) for the three series, illustrating the combination of two + hydration states (1W and 2W) within the particle. The completeness or incompleteness of the CEP can be influenced by the change in the d 001 value (Reference Oueslati and MeftahOueslati & Meftah, 2018). The hydration behavior of the SWy-Ni series showed a decrease in the 1W monohydrate state (from 40 to 0%), and by an increase in the fluctuation for the 2W hydration state (from 60 to 100%). This was interpreted as easy intercalation of the CC (Ni2+) in the IS, gradually replacing the sodium cations (Na+) and causing their removal from the structure. This effect became more pronounced with an increase in the applied stress intensity, as seen in extreme cases such as pH = 5, T = 125°C, and t = 20 h and pH = 6, T = 150°C, and t = 25 h. This supports the completion of the CEP, despite the presence of the established stress coupling.

Fig. 10 Graphical representation of weighting of hydration states (1W and 2W) obtained via a modeling approach of the XRD patterns for the SWy-Ni, SWy-Mg, and SWy-Zn series (color code: 1W - light brown and 2W - dark brown)
The SWy-Mg and SWy-Zn series exhibited different water behavior from the SWy-Ni series. A slight increase in the 1W HS was followed by a gradual decrease in 2W HS, with a significant domination of 2W HS. This decrease in the IS reflected a partial cation exchange that occurred as applied stresses intensified, even though there was an equilibrium time provided for the exchange.
The analysis of the optimized theoretical mixed-layer systems (MLS) used to replicate the experimental X-ray models revealed that the 2W HS was the most abundant phase in the three complexes (SWy-Ni, SWy-Mg, and SWy-Zn), in contrast to the 1W HS. This observation indicates that the 2W phase was the dominant phase in these systems (Fig. 10).
Evolution of the Average Number of Layers
The manipulation of the average number of layers (
 ) was a critical factor in examining the clay's response and analyzing the crystal structure (Fig. 11) through XRD analysis for the three series (SWy-Ni, SWy-Mg, and SWy-Zn). The variation in
 directly influenced the characteristics of the primary 001 observed in both the experimental and calculated models. Specifically, larger values of
 (~ 10) resulted in narrow 001-peaks with smaller FMWH values, while smaller values of
 led to broader 001 peaks with larger FMWH values (Reference Oueslati, Mejri and AmaraOueslati et al., 2022a).

Fig. 11 Evolution of the
 value as a function of the intensity of the external constraint applied for the SWy-Ni, SWy-Mg, and SWy-Zn series
Evolution of the Layer Stacking Mode (LSM)
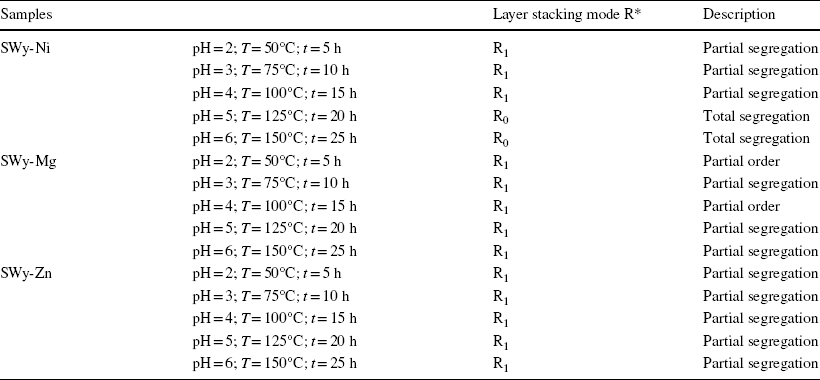
XRD modeling patterns were employed to characterize the hydration states associated with each optimal configuration derived from the best agreements achieved between the calculated and experimental XRD models of the three series SWy-Ni, SWy-Mg, and SWy-Zn (Table 7). The overall appearance of the LSM exhibited partial segregation. A more detailed analysis revealed specific stacking modes for each series. The SWy-Ni series exhibited a combination of two stacking modes – partial and total segregation. In the case of the SWy-Mg series, two stacking modes were observed – partial order and total segregation. Finally, for the SWy-Zn series, a single stacking mode (partial segregation) was observed.
Table 7 Stacking modes hydration layers for the SWy-Ni, SWy-Mg, and SWy-Zn series
Summary and Conclusions
The present study investigated the impact of coupled geochemical, thermal, and kinetic factors on the hydration behavior and structural response of W-Mnt. The research aimed to understand the effectiveness of CEC and the reversibility, hydration properties, and resistance of Na-rich montmorillonite exchanged with divalent metal cations M2+ (Ni2+, Mg2+, or Zn2+) under the application of second-order external constraints. The objectives of the study were achieved by subjecting the mineral to stress at the laboratory scale, which entailed coupling three constraints simultaneously: geochemical, thermal, and kinetics. This was possible by varying the pH of the depolluting solution under controlled temperatures for various durations. The mineral’s CEC and hydration behavior were the main areas of investigation, and the research relied on the quantitative analysis of the 00l reflections to quantify the structure of the mineral. The results showed that the external constraints applied to the samples had a significant impact on the mineral’s response. The study found that the electronegativity of the compensating cation was associated with a limit that governed the increase or decrease of the CEC. Each sample had a unique structural feature and responded differently to changes in the applied constraints over time. To ascertain the relationship between the applied external stresses and the structural evolution/alteration of the host materials, the XRD profile modeling approach was used, which uses numerous skills in simulating 00l reflections and improving agreement between calculated and experimental diffracted intensities to reveal clay surface reactivity and crystallography of lamellar structures.
In detail, the integration of theoretical findings obtained through XRD modeling with experimental patterns showed that, at room temperature, the initial SWy-Na sample exhibited an interstratified hydration state of the 0W and 1W phases. For the reference samples SWy-Ni, SWy-Mg, and SWy-Zn, which were analyzed without any applied constraint, the XRD analysis indicated the presence of three phases, namely 0W, 1W, and 2W. The semiquantitative XRD analyses of the results obtained under the impact of the second-order coupling were as outlined below.
Several observations were made in relation to the impact of second-order coupling in the SWy-Ni series, as follows. (1) A greater intensity of applied stress induced a transition from a heterogeneous hydration state (HS) characterized by the presence of 1W and 2W phases to a homogeneous HS where only a single type of 2W layer population existed. This transition coincided with the elimination of sodium residues. (2) Two distinct stacking modes for the layers were identified in the theoretical XRD patterns. (3) Throughout the entire series, the dominant stacking mode was referred to as ‘total segregation.’ (4) The CEC increased simultaneously with the increase in applied constraint intensity. (5) The number of water molecules (nH2O) increased non-linearly in response to the development of applied constraints. (6) Irrespective of the applied stresses, an independent increase in the average number of layers (
 ) occurred.
The SWy-Mg series yielded several noteworthy findings. (1) A heterogeneous hydration state was observed, with the appearance of both 1W and 2W phases regardless of the applied stress. (2) The intensification of external stress led to a decrease in the 2W phase and an augmentation of the 1W phase. (3) Diverse layer types coexisted within the crystallite and exhibited stacking patterns guided by specific junction probabilities, characterized by partial order and segregation. (4) The applied stress caused a reduction in the CEC, and the presence of two distinct compensating cations (Na+ and Mg2+) indicated partial cation exchange, independent of the applied stress. (5) A non-linear growth in the amount of H2O was observed as the external stresses increased.
In the SWy-Zn series, several notable observations were made. (1) The coexistence of multiple populations of layer types (1W and 2W) confirmed the presence of an interstratified hydration character, unaffected by the applied stress. (2) The dominance of the 2W HS was particularly pronounced. (3) The CEP remained incomplete, independent of the external constraints exerted. (4) The presence of two distinct compensating cations (Na+ and Zn2+) within the IS resulted in the formation of a physical mixture between populations of different layer types. (5) Throughout the entire series, a single stacking mode characterized by partial segregation was observed. (6) The amount of H2O exhibited a nonlinear increase in response to the applied external stresses. (7) The expansion of the IS led to an increase in the
 values for both SWy-Mg and SWy-Zn samples, irrespective of the magnitude of the applied stress. In fact, the electronegativity of the compensating cation (CC) was associated with a limit that governs the increase or decrease in the CEC. Samples saturated with EC and EN values > 1.88 show a rise in CEC, while samples saturated with cations with an EN value of ≤ 1.6 exhibit a drop in CEC. The hydration performance for EN values between 1.65 and 1.88 (the uncertainty zone) was considered unidentified. The optimization of the modeling approach enabled the mapping of interstratified hydration layers and the development of the WF concept. Each sample has a unique structural feature and responds differently to changes in the applied constraints over time.
In conclusion, our thorough investigation of smectites sheds important light on how they react to geochemical, thermal, and kinetic limitations. The findings demonstrate the importance of the ionic composition, particularly the electronegativity of exchangeable cations, in determining the characteristics of clays. The CEC fluctuates according to the constraints strength, and it appears that higher electronegativity compensatory cations are required to reach a greater CEC. Furthermore, the observed variations in crystalline configurations, ranging from complete segregation to the partial order, show how susceptible clay formations are to external stresses. An accurate depiction of the intricate hydration states of smectite is made possible by the unconventional approach involving the use of a clay hydration background data. These results highlight the critical role played by a combination of external environmental limits in the prediction and control of smectite specific features. These findings have important ramifications for materials and environmental contexts, and they offer useful direction for further study of clays and their intricate interactions.
Acknowledgements
CM acknowledges WO for the original idea for the study, the fruitful discussions about the XRD modeling approach, and the montmorillonite hydration behavior.
Authors’ Contributions
PhD student Chadha Mejri (CM) realized the experimental part, the XRD profile modeling approach and drafting of the manuscript. Dr. Walid Oueslati (WO) supervised the study, contributed to the drafting of the manuscript, and to proof reading/revision. A. Ben Haj Amara conceived and designed the experiments, and played a key role in planning and conceptualizing the research.
Funding
This research received no specific grant from any funding agency in the public, commercial, or not-for-profit sectors.
Data Availability
The generated and analyzed data during the current study are included within the article and can be obtained from the corresponding authors upon reasonable request.
Declarations
Disclosure
The results presented are a part of the PhD thesis of Chadha Mejri carried out at the Faculty of Sciences of Bizerte, University of Carthage, 7021 Zarzouna, Tunisia and supervised by Dr Walid Oueslati.
Consent for Publication
The authors agree to publication in Clays and Clay Minerals.
Conflicts of Interest
The authors declare no conflict of interest.


