


Background
A decrease in blood pressure after eating, a condition referred to as postprandial hypotension (PPH) is associated with an increased risk for falls, fractures (Aronow & Ahn, Reference Aronow and Ahn1997), and increased mortality (Aronow & Ahn, Reference Aronow and Ahn1997). PPH-related falls in older adults also result in dangerous and expensive outcomes such as hip fractures, institutionalization, and increased rates of hospitalization (Do, Chang, Kuran, & Thompson, Reference Do, Chang, Kuran and Thompson2015). The often vague symptomatology associated with this condition (Kohara et al., Reference Kohara, Jiang, Igase, Takata, Fukuoka and Okura1999) unfortunately makes PPH a diagnosis that is frequently overlooked, although some studies have suggested that it accounts for approximately 15 per cent of all fainting-related falls in older adults (Jansen & Lipsitz, Reference Jansen and Lipsitz1995).
The only definitive method to screen for PPH is with a meal test (Trahair, Horowitz, & Jones, Reference Trahair, Horowitz and Jones2014), a process that is both logistically difficult and time consuming. The large number of older adults who are currently injured by falls (Davis, Robertson, Comans, & Scuffham, Reference Davis, Robertson, Comans and Scuffham2011), and the ongoing demographic shift that is increasing the prevalence of falls (Chand & Tung, 2015) makes the strategy of screening all falls clinic patients not logistically practical. A better understanding of which patient characteristics are associated with higher PPH responses would help falls clinics better target patients for meal testing. Previous investigations have shown an association among PPH and increasing age and hypertension (Zou et al., Reference Zou, Cao, Li, Hu, Guo, Si and Fan2015), but this work was done on healthy, highly screened, non-falling volunteers. From a clinical perspective, PPH has also been anecdotally linked with several modifiable risk factors in older adults, such as polypharmacy, anti-hypertensive drugs, autonomic dysfunction, dehydration, and aortic stenosis (Jansen, Reference Jansen2005). The current study attempts, using meal tests in a falls clinic population, to see which subject characteristics are most associated with an increased PPH response.
Materials and Methods
Subjects
All subjects were recruited sequentially from January 2014 to July 2018 and had to be over 65 years of age. All subjects were referred to the Division of Geriatric Medicine falls clinic at Vancouver General Hospital. None of the subjects had a swallowing or oral issue preventing the ability to complete a meal test. All subjects gave written consent and received approval by the Human Subjects Committee of the University of British Columbia.
Meal Tests
Meal Testing
Each meal test lasted 90 minutes and all subjects were examined in the fasted state; all sessions took place between 0700 and 1200 to avoid bias caused by circadian rhythms. Each subject rested in the supine position for 30 minutes prior to the start of data collection in order to reach steady state. Subjects were told to refrain from consuming alcohol or caffeine and also to refrain from vigorous exercise for the 24 hours prior to each session. Anti-hypertensive medications were not administered the morning of the meal test. All tests occurred in a room that was quiet and held at a constant temperature (25° ± 1°C). The standardized meal consisted of a 1,050 kJ standardized meal substitute (containing 38 g carbohydrates, 7.8 g fat, 9.4 g protein, and 3.4 g fibre) and was presented at a standardized temperature (refrigerated, 3.0 ± 0.5°C).
Data Collection and Processing
With each subject resting comfortably in the seated position, continuous beat-to-beat measures of blood pressure were collected at baseline and for a total of 90 minutes after standardized meal ingestion. All blood pressure signals were sampled at 1,000 Hz (Powerlab, AD Instruments) and digitized for later analysis.
Blood pressure was monitored with a Finometer (Finapres Medical Systems BV, The Netherlands). Through a finger cuff, the Finometer uses infrared plethysmography to measure beat-to-beat blood pressure non-invasively. The infrared plethysmography technique has been well established as a non-invasive measure of beat-to-beat blood pressure (Imholz, Wieling, van Montfrans, & Wesseling, Reference Imholz, Wieling, van Montfrans and Wesseling1998) and has been validated against intra-arterial blood pressure monitoring in older adult subjects (Rongen et al., Reference Rongen, Bos, Lenders, van Montfrans, van Lier and van Goudoever1995). The Finometer also performs an additional return-to-flow calibration, as well as level correction and waveform filtering, allowing an accurate reconstruction of brachial artery pressures from infrared plethysmography data (Bos, van Goudoever, van Montfrans, van den Meiracker, & Wesseling, Reference Bos, van Goudoever, van Montfrans, van den Meiracker and Wesseling1996; Guelen et al., Reference Guelen, Westerhof, Van Der Sar, Van Montfrans, Kiemeneij and Wesseling2003). Beat-to-beat measures of systolic (SBP), mean (MBP), and diastolic (DBP) blood pressure were obtained using commercial software (Beatscope, Finapres Medical Systems BV, The Netherlands). Blood pressure measures were averaged for each 5 minute data window during the meal test.
The presence of a PPH event was defined as a decrease in SBP of 20 mm Hg during one of the data windows within 90 minutes of ingesting the standardized meal (Jansen & Hoefnagels, Reference Jansen and Hoefnagels1990). The number of “PPH events” (PPHnum) was defined as the number of times during a meal test that a subject met PPH criteria. The maximum SBP decrease (PPHmax) was calculated for each 5 minute data window and averaged. The data were all analyzed post-collection in a blinded fashion, and each segment of blood pressure data was manually examined to exclude artifacts. Immediately on arriving at the laboratory, subjects had their blood pressure measured (Welch Allyn, ABPM 7100) for orthostatic changes three times, and the results were averaged. Blood pressure was measured in the supine position and after 3 minutes standing upright (Ziegler et al., Reference Ziegler, Laux, Dannehl, Spuler, Muhlen and Mayer1992).
Statistical Methods
Our two response variables were PPHmax and PPHnum. Our predictor variables were age, sex, body mass index (BMI), the presence of diabetes, the presence of hypertension, baseline SBP, and orthostatic drop in SBP. Scatter plots were visually inspected for outlier data and density plots were examined to identify skewing of the data. Any predictors that demonstrated skewing were logarithmically transformed (base 10) prior to both the univariate and multivariate analyses. After our initial model, model simplification was accomplished through a tiered approach using a stepwise method. Each successive regression model was generated by removing the least significant predictor with a p value of > .10. After each predictor was removed, Akaike’s information criterion (AIC) was calculated until the smallest AIC was obtained (Crawley, Reference Crawley2011). Tolerance values and variance inflation factors were examined for multicollinearity, to ensure that the assumptions of the multivariate regression were met. Plots of residuals and a QQ plot were examined in our final minimum effective model. The R core software package version 3.4.2 was used for statistical analysis with a significance level of p < .05(R Core Team, 2017). All data analysis was done in a blinded fashion and the format mean ± standard error was used to express results.
Results
Subject Characteristics
Of the first 98 subjects approached, 52 agreed to participate in the study (29 women and 23 men). There were no withdrawals from the study. Mean age was 77.9 ± 0.9 years with an age range of 67–92 years. Twenty-five were diagnosed with diabetes, 33 had a diagnosis of hypertension, 3 had aortic stenosis, 4 had a diagnosis of systolic heart failure, and the mean BMI was 29.8 ± 1.1. None of the subjects had Parkinson’s disease or autonomic neuropathy. Subjects’ baseline blood pressure prior to the administration of the standardized meal was 145 ± 3/75 ± 1 mm Hg, with a mean blood pressure of 98 ± 1 mm Hg. The mean orthostatic decrease in SBP was 4 ± 3. Thirty-one subjects met the criteria for polypharmacy, if one defined polypharmacy as the use of five or more medications (Gnjidic et al., Reference Gnjidic, Hilmer, Blyth, Naganathan, Waite and Seibel2012).
Meal Test Results
The mean maximum decrease in SBP observed in each 5 minute data window was 12 ± 5 mm Hg. The mean postprandial response to the meal test was an average increase in SBP by 1 ± 3 mm Hg. There was an average of 4 ± 1 observed PPH events during the 90 minute meal test.
Postprandial Response and Subject Characteristics (Univariate Analysis, Table 1)
No skewing was detected on inspection of the predictor variable density plots and no transformation was required prior to the analysis. In our initial univariate analysis, the magnitude of the orthostatic drop showed a significant correlation with both PPHmax and PPHnum while preprandial SBP showed a significant correlation with PPHmax (see Table 1).
Table 1: Univariate regression analysis (n = 52)
Note. PPH = postprandial hypotension; PPHmax = average maximal change in blood pressure; PPHnum = number of PPH events observed; BMI = body mass index; SBP = systolic blood pressure; R = Pearson Correlation Coefficient; CI = confidence interval, *p < .05.
Maximal Postprandial SBP Response and Subject Characteristics (Multivariate Analysis, Table 2)
Similar to what was described previously, our predictor variables initially explained 52 per cent of the variance in PPHmax (PPH, Max, Model 1, Table 2). The highest variance inflation factor (VIF) for Model 1 was 1.67 (the presence of hypertension), indicating no multicollinearity issues. Our minimal effective model (Table 2) demonstrated a positive association with male sex. The maximal decrease in SBP showed a linear association with the magnitude of the orthostatic drop and an inverse association with the baseline pre-meal test BP. In fact, an orthostatic decrease of 10 mm Hg was associated with a 5 mm Hg increase in the magnitude of the postprandial decrease in SBP (Figure 1).
Table 2: Stepwise multivariate regression analysis (n = 52)
Note. MEM = minimal effective model; PPH = postprandial hypotension; PPHmax = average maximal change in blood pressure; PPH num = number of PPH events observed; BMI = body mass index; SBP = systolic blood pressure; R 2 = coefficient of determination; SE - standard error; β = beta coefficient, *p < .05
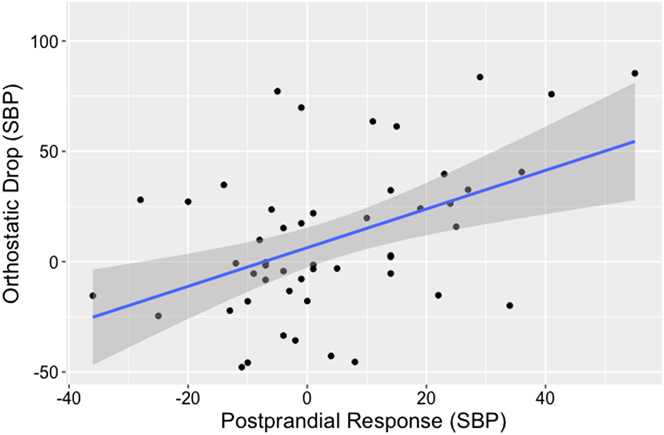
Figure 1: Orthostatic drop versus maximal postprandial hypotensive response (systolic blood pressure [SBP]). As shown by a plot of the maximal postprandial response versus orthostatic drop for each subject (black dots), an increase in orthostatic intolerance (SBP) is positively associated with a higher maximal postprandial decrease in SBP. The plotted linear regression (blue line) demonstrates that an orthostatic decrease of 10 mm Hg was associated with a 5 mm Hg increase in the magnitude of the postprandial decrease in SBP.
Number of PPH Events and Subject Characteristics (Multivariate Analysis, Table 2)
Fifty-two per cent of the variance in the number of PPH events observed was explained by our initial model containing age, baseline SBP, orthostatic drop in SBP, sex, the presence of diabetes, and the presence of hypertension (PPHnum, Model 1, Table 2). The highest VIF was 1.69 (the presence of hypertension), indicating a lack of multicollinearity issues. Our minimal effective model contained BMI, the presence of hypertension, and orthostatic drop; a higher BMI, the presence of hypertension, and a higher orthostatic drop were all positively associated with a larger number of PPH events during the meal test.
Discussion
Principal Findings
Larger postprandial responses (PPHmax) were associated with being of the male biological sex and having a larger orthostatic drop. There was more postprandial hemodynamic instability (higher number of PPH events) in subjects with higher BMIs, and in subjects with hypertension and with a higher orthostatic drop.
Previous Work
Despite the fact that PPH has a high prevalence (Yu, Song, & Kim, Reference Yu, Song and Kim2002) and associated morbidity (Aronow & Ahn, Reference Aronow and Ahn1997), the risk factors and overall epidemiology of this condition remains “undefined” (O’Mara & Lyons, 2002). Previous work has attempted to determine risk factors in inpatient populations (Puisieux et al., Reference Puisieux, Bulckaen, Fauchais, Drumez, Salomez-Granier and Dewailly2000), healthy community volunteers (Yu et al., Reference Yu, Song and Kim2002; Zou et al., Reference Zou, Cao, Li, Hu, Guo, Si and Fan2015), and older adults in residential care (Aronow & Ahn, Reference Aronow and Ahn1997; Jansen, Kelly-Gagnon, & Lipsitz, Reference Jansen, Kelly-Gagnon and Lipsitz1996; Le Couteur, Fisher, Davis, & McLean, Reference Le Couteur, Fisher, Davis and McLean2003). To our knowledge, despite the high clinical relevance, no previous work has examined a falls clinic population for characteristics associated with a higher PPH response (the focus of the current study).
Preprandial Blood Pressure and the Postprandial Response
Our study demonstrated that a lower preprandial SBP was associated with higher maximal decreases in postprandial SBP. This result is congruent with previous work in community dwelling volunteers (Yu et al., Reference Yu, Song and Kim2002) and inpatients (Puisieux et al., Reference Puisieux, Bulckaen, Fauchais, Drumez, Salomez-Granier and Dewailly2000) showing that lower preprandial SBPs are associated with a larger PPH response, providing a likely explanation for the association between PPH and BP lowering medications observed in long-term care patients (Aronow & Ahn, Reference Aronow and Ahn1997).
Risk Factors for Autonomic Dysfunction and the Postprandial Response
PPH has shown a strong association with autonomic dysfunction (Kooner et al., Reference Kooner, Raimbach, Watson, Bannister, Peart and Mathias1989), and is a well-documented etiology for PPH in both autonomic neuropathy (Sasaki, Kitaoka, & Ohsawa, Reference Sasaki, Kitaoka and Ohsawa1992) and spinal cord injuries (Catz, Mendelson, & Solzi, Reference Catz, Mendelson and Solzi1992). Chronic hypertension is a well-documented cause of autonomic dysfunction (Fagard, Pardaens, & Staessen, Reference Fagard, Pardaens and Staessen2001), and past studies of older community-dwelling adults have shown an association between having a diagnosis of hypertension and a larger PPH response (Zou et al., Reference Zou, Cao, Li, Hu, Guo, Si and Fan2015), similar to the results of the current study. Obesity has a well-documented association with autonomic dysfunction (Rossi et al., Reference Rossi, Marti, Ricordi, Fornasari, Finardi and Fratino1989) and increased BP variability (Piccirillo et al., Reference Piccirillo, Vetta, Viola, Santagada, Ronzoni and Cacciafesta1998). Our study is congruent with these results, demonstrating a strong association between a higher BMI and more observed PPH events. Previous work has suggested that the various neuroautonomic etiologies for syncope (such as orthostatic hypotension and PPH) have a tendency to cluster in the same patients (De Ruiter, Wold, Germans, Ruiter, & Jansen, Reference De Ruiter, Wold, Germans, Ruiter and Jansen2018). Our results support this, as we were able to demonstrate an association between a higher orthostatic drop and both larger observed maximal PPH responses and a larger number of observed PPH events.
Other Risk Factors
To our knowledge, our study was the first to examine the relationship between biological sex and PPH, showing that men have an increased average and maximal PPH response compared with women. Although previous work has shown that men have been shown to have more frequent episodes of syncope (Sun, Emond, & Camargo, Reference Sun, Emond and Camargo2004) and worse outcomes from syncope (Costantino et al., Reference Costantino, Perego, Dipaola, Borella, Galli and Cantoni2008), these results apply to all etiologies of syncope and were not specific for PPH. We were unable to demonstrate any association between increasing age and the PPH response, which is consistent with some previous studies of older adults (Yu et al., Reference Yu, Song and Kim2002) but not with other studies found in the literature (Zou et al., Reference Zou, Cao, Li, Hu, Guo, Si and Fan2015). Zou et al. (Reference Zou, Cao, Li, Hu, Guo, Si and Fan2015) had a much larger proportion of oldest-old subjects in their subject pool; perhaps this wider variability in age allowed them to detect an association that was not seen in our sample.
Clinical Implications
Because of the vagueness of the presenting symptoms, PPH is a poorly recognized condition (Trahair et al., Reference Trahair, Horowitz and Jones2014) that has a profound impact on the lives of older adults through an increase in both mortality and morbidity (Aronow & Ahn, Reference Aronow and Ahn1997). Screening with a meal test is logistically impractical for all patients who present to a falls clinic. The associations noted in our study suggest that further screening of unexplained fallers with a meal test or continuous ambulatory BP monitoring should be strongly considered in men, hypertensive patients, obese patients, those patients with orthostatic intolerance, and those patients with low resting BP.
Limitations and Future Research
Because of the observational methods used in this study, we can only determine associations among the different potential risk factors and the size of the PPH response. We are unable to make any conclusions about mechanisms underlying the observed increased PPH response in males, hypertensive patients, obese patients, and in those patients with low resting or orthostatic intolerance. Our study also did not measure syncope rates, so it is difficult to determine at what level the PPH response has a clinical significance. Further studies are needed to determine if any of these risk factors can be modified to prevent falls in the complex older adult patient with PPH.
Conclusions
Our study demonstrated an association between being male, having hypertension, higher BMIs, low resting BP, and higher orthostatic drops and a larger PPH response.


 Open access