The global growth in the number and proportion of older adults has a multitude of public health and social policy implications (Gill & Moore, Reference Gill and Moore2013; World Health Organization, 2015). For example, in Canada in 2015, for the first time, persons 65 years of age and older outnumbered children between 0 and 14 years of age, and the proportion of older persons is expected to continue to increase (Statistics Canada Demography Division, 2015). Critically, the prevalence of physical impairments and functional limitations increase with age, especially in later life (Arim, Reference Arim2015; Gill & Moore, Reference Gill and Moore2013). According to the 2012 Canadian Survey on Disability (Arim, Reference Arim2015), the mean age of onset of physical impairments is in the early 40s. The prevalence of impairment was found to be 16.1 per cent for persons between 45 and 64 years of age, and rose to 43 per cent for persons 75 years of age and older.
The international Classification of Functioning, Disability and Health (ICF) suggests that impairments are associated with activity limitations and, accordingly, participation limitations (World Health Organization, 2011). Types of impairments most frequently reported include limitations in mobility,Footnote 1 hearing, and vision, as well as flexibility, mental health, dexterity, learning (e.g., attention deficit), memory, and the presence of pain (Arim, Reference Arim2015). Mobility, hearing, and vision limitations especially are not only prevalent, but rise sharply in older ages (Arim, Reference Arim2015; Feder, Michaud, Ramage-Morin, McNamee, & Beauregard, Reference Feder, Michaud, Ramage-Morin, McNamee and Beauregard2015; Perruccio, Badley, & Trope, Reference Perruccio, Badley and Trope2010; Ramage-Morin, Reference Ramage-Morin2016).
There are several negative outcomes associated with these impairments. For example, an inability to walk has been shown to predict subsequent activity limitation defined by basic and instrumental activities of daily living (ADLs/IADLs)Footnote 2 (Fillenbaum & Smyer, Reference Fillenbaum and Smyer1981), higher health care cost, mortality (Hardy, Kang, Studenski, & Degenholtz, Reference Hardy, Kang, Studenski and Degenholtz2011) and an increased risk of depressive symptoms (Lampinen & Heikkinen, Reference Lampinen and Heikkinen2003). Low vision is associated with poorer levels of execution with respect to ADLs, symptoms of depression, and feelings of anxiety (Kempen, Ballemans, Ranchor, van Rens, & Zijlstra, Reference Kempen, Ballemans, Ranchor, van Rens and Zijlstra2012). Further, hearing impairment is associated with reduced execution in ADLs and IADLs, poorer health-related quality of life (Chia et al., Reference Chia, Wang, Rochtchina, Cumming, Newall and Mitchell2007; Dalton et al., Reference Dalton, Cruickshanks, Klein, Klein, Wiley and Nondahl2003), poorer cognitive functioning (Lin, Thorpe, Gordon-Salant, & Ferrucci, Reference Lin, Thorpe, Gordon-Salant and Ferrucci2011; Lin et al., Reference Lin, Yaffe, Xia, Xue, Harris and Purchase-Helzner2013), and negative impacts on relationships with others (Scarinci, Worrall, & Hickson, Reference Scarinci, Worrall and Hickson2008).
In fact, these physical impairments may lead to activity limitations and participation restrictions such as limited participation in work and social and community life. Turcotte et al. (Reference Turcotte, Larivière, Desrosiers, Voyer, Champoux and Carbonneau2015) reported, based on their multiple case study, that older adults with physical or cognitive impairments were not able to sufficiently participate in social activities outside the home. More specifically, Ramage-Morin (Reference Ramage-Morin2016) reported that older women, although not older men, with hearing difficulties experienced social isolation (i.e., feeling lonely, lacking a sense of social belonging) (See also Gopinath et al., Reference Gopinath, Hickson, Schneider, Mcmahon, Burlutsky and Leeder2012). Further, Rosso, Taylor, Tabb, and Michael (Reference Rosso, Taylor, Tabb and Michael2013) reported that for older adults, mobility limitations were also associated with reduced social participation. Social participation is particularly important because of the many benefits it provides to older adults. Studies have shown that social participation has a protective role for health and well-being (Adams, Leibbrandt, & Moon, Reference Adams, Leibbrandt and Moon2011; Gilmour, Reference Gilmour2012) and improved survival for older adults (Andrew & Keefe, Reference Andrew and Keefe2014). These findings suggest that decreased social participation, resulting from increased functional impairments, could be an important but modifiable problem associated with older adults’ well-being in an aging society.
Assistive devicesFootnote 3 are tools and/or technologies that can play a critical role in easing discomforts and minimizing limitations in daily activities caused by functional impairments. The benefits of using assistive devices, especially those for mobility, are well reported in the literature. Mobility devices are aids to help with these functions including walkers, canes, crutches, manual and electric wheelchairs, and motorized scooters. Using mobility devices has been associated with improved ADLs, independence, quality of life, social benefits, confidence, and self-esteem (Brandt, Iwarsson, & Stahle, Reference Brandt, Iwarsson and Stahle2004; Chien & Lin, Reference Chien and Lin2012; Edwards & McCluskey, Reference Edwards and McCluskey2010; Frank, Neophytou, Frank, & de Souza, Reference Frank, Neophytou, Frank and de Souza2010; Löfqvist, Pettersson, Iwarsson, & Brandt, Reference Löfqvist, Pettersson, Iwarsson and Brandt2012; Wilson, Mitchell, Kemp, Adkins, & Mann, Reference Wilson, Mitchell, Kemp, Adkins and Mann2009). In particular, Rousseau-Harrison et al. (Reference Rousseau-Harrison, Rochette, Routhier, Dessureault, Thibault and Côté2009, Reference Rousseau-Harrison, Rochette, Routhier, Dessureault, Thibault and Cote2012) reported that social participation among their study populations (mean ages of 64.2 and 64.3 years, respectively) increased after the use of wheelchairs began, based on the Reintegration to Normal Living Index (RNLI) and users’ perception. To a lesser extent, there is also evidence that using assistive devices for vision (Scadden, Reference Scadden1997) and hearing (Chisolm et al., Reference Chisolm, Johnson, Danhauer, Portz, Abrams and Lesner2007; Weinstein, Sirow, & Moser, Reference Weinstein, Sirow and Moser2016) enhance important aspects of life as well.
It is important to note that the prevalence of device use varies for different types of impairments (Arim, Reference Arim2015; Statistics Canada, 2008). According to Statistics Canada’s 2006 survey on assistive technologies, the most commonly used devices were a cane or walking stick for mobility impairments, magnifiers for vision impairments, and hearing aids for hearing impairments (Statistics Canada, 2008). The prevalence of device use is consistent with the prevalence of impairments; rates of mobility impairments were reported to be the highest followed by vision and/or hearing impairments (Arim, Reference Arim2015; Martin, Zimmer, & Hurng, Reference Martin, Zimmer and Hurng2011; Picavet & Hoeymans, Reference Picavet and Hoeymans2002).
In Canada, there is an increasing recognition that the use of assistive devices can support healthy aging (e.g., AGE-WELL, http://agewell-nce.ca/). The minimizing of discomfort and loss of activity/action resulting from impairment has a substantial physical and financial impact on persons with impairments as well as on their caregivers and communities. Although the use of assistive devices is known to increase with age (Arim, Reference Arim2015; Kaye, Yeager, & Reed, Reference Kaye, Yeager and Reed2008) and is known to vary across sexes (Arim, Reference Arim2015; Fisher et al., Reference Fisher, Li, Hoffman, Chiu, Themann and Petersen2015; Peterson, Meng, Dobbs, & Hyer, 2016), it remains unclear, especially in the Canadian context, who uses assistive devices and how social participation differs according to device use.
Assessing the characteristics of assistive device users is a critical first step for informing future policy decisions as well as design developments, so that provision of services and care can be efficient and appropriate as well as cost effective (Hollander, Chappell, Prince, & Shapiro, Reference Hollander, Chappell, Prince and Shapiro2007). Therefore, the objective of the current study is to describe the profile of assistive device users in Canada with regard to socio-demographic and health characteristics as well as social characteristics, including social participation.
Methods
Data Source and Study Population
The data for this study were obtained from the CLSA (https://www.clsa-elcv.ca) as approved by the CLSA Data and Sample Access Committee. The CLSA is a large, national, longitudinal study that is following more than 50,000 Canadians between the ages of 45 and 85 for 20 years or until death (Raina et al., Reference Raina, Wolfson, Kirkland, Griffith, Oremus and Patterson2009). All participants provide a core set of information on demographic and lifestyle/behaviour factors, social, physical/clinical, psychological, economic, and health status measures, and health services use.
Participants in the CLSA Tracking were randomly selected from age and sex strata within the 10 Canadian provinces and provided information via computer-assisted telephone interviews (n= 21,241). Participants in the CLSA Comprehensive were randomly selected from within 25–50 km of data collection sites in 11 cities across Canada (Victoria, Vancouver, Surrey, Calgary, Winnipeg, Hamilton, Ottawa, Montréal, Sherbrooke, Halifax, and St. John’s) and provided in-depth information obtained via face-to-face computer-assisted personal in-home interviews, as well as physical assessments and biospecimen collection at local data collection sites (n = 30,097). The current analysis used data collected at baseline (2010–2015) for a total sample of 51,338 older adults. Excluded from the CLSA were (1) residents in the three territories, in some remote regions, in federal First Nations reserves, and in other First Nations settlements in the provinces, (2) full-time members of the Canadian Armed Forces, (3) individuals living in institutions, (4) individuals who were temporary visa holders or had transitional health coverage, (5) individuals unable to respond in English or French, and (6) individuals with cognitive impairment at baseline.
Measures
Assistive device use
The measurements of assistive device use for hearing and vision were based on binary responses to a question for each type. For hearing, participants were asked: “Do you use any aids, specialized equipment, or services for persons who are deaf or hard of hearing, for example, a volume control telephone or TV decoder?” The response options were “yes”, “no”, “don’t know/no answer”, and “refused”. Participants who answered “yes” were further asked to indicate the types of hearing devices that they used. The response options included hearing aid, computer to communicate (e.g., e-mail or chat services), TTY or TTDFootnote 4, message relay service, other phone-related device, closed caption TV or decoder, amplifiers (e.g., FM, acoustic, infrared), visual or vibrating alarm, cochlear implant, or another aid. For vision, participants were asked: “Besides glasses or contact lenses, do you use any aids or specialized equipment for persons who are blind or visually impaired, for example, magnifiers or Braille reading materials?” The response options were “yes”, “no”, “don’t know/no answer”, and “refused”. Participants who answered “yes” were further asked to indicate the types of vision devices that they used. The response options include magnifiers, braille reading materials, larger reading print materials, talking books, recording equipment or portable note-takers, closed circuit devices (e.g., CCTVs), a computer with braille, large print or speech access, a white cane, a guide dog, or another aid. The measurement of assistive device use for mobility was based on the question: “During the past 12 months, have you used any of the following assistive devices?” Mobility-related devices listed included cane or walking stick, wheelchair, motorized scooter, walker, or leg braces or supportive devices. Participants were classified as assistive device users if they responded “yes” to any of the foregoing questions.
Socio-demographic characteristics
Ethnicity was categorized into two groupsFootnote 5: white and other. Marital status was categorized into four groups: single, married/common-law, widowed, and divorced/separated. Educational attainment was categorized into four groups; (1) less than secondary school graduation, (2) secondary school graduation, no post-secondary education, (3) some post-secondary education, and (4) post-secondary degree/diploma.Footnote 6 Total annual household income was categorized into six groups; less than $20,000, $20,000–$49,999, $50,000–$99,999, $100,000–$150,000, more than $150,000, and unknown.
Health characteristics
The presence of chronic conditions was categorized into six groups: 0, 1, 2, 3, 4, and 5 or more chronic conditions. This was based on responses to a series of questions asking about chronic health conditions diagnosed by a physician (osteoarthritis, arthritis, respiratory, cardiac, neurological, gastrointestinal, vision, cancer, mental health, infections, and other). Participants were classified as having a condition if they responded “yes” to any specific conditions (e.g., high blood pressure, diabetes, heart disease, angina, heart attack, peripheral vascular disease, stroke) within a given condition (e.g., cardiac) when asked, “Has a doctor ever told you that you have…?”. The total number of chronic conditions per respondent was tabulated using all 11 questions (min = 0, max = 11). The measurement of perceived health was based on responses to the question: “In general, would you say your health is excellent, very good, good, fair, or poor?” The response options were dichotomized to reflect positive (excellent/very good/good) versus poor (fair/poor) health. Home care was categorized into four groups: formal, informal, both, and none, based on responses to two questions asking about formal care at home provided by professionals and informal care at home provided by family, friends, or neighbours. For formal care, participants were asked: “During the past 12 months, did you receive short-term or long-term professional assistance at home, because of a health condition or limitation that affects your daily life, for any of the following activities?” The list of types of care included (1) personal care such as assistance with eating, dressing, bathing or toileting; (2) medical care such as help taking medicine or help with nursing care; (3) managing care such as making appointments; (4) help with activities such as housework; (5) home maintenance, or outdoor work; (6) transportation, including trips to health care providers or for shopping; and (7) meal preparation or delivery. For informal care, a similar question was asked: “During the past 12 months, did you receive short-term or long-term assistance from family, friends, or neighbours because of a health condition or limitation that affects your daily life, for any of the following activities?” The list of types of care was the same as the formal care question.
Social network characteristics
The measurement of living arrangements was based on the question “How many people, not including yourself, currently live in your household?” The responses were dichotomized to reflect living alone versus living with others. The measurement of social participation was based on responses to a series of eight questions asking how often in the past 12 months participants had participated in eight different community-related activities (at least once a day, at least once a week, at least once a month, at least once a year, never). The response options were dichotomized to reflect frequent and infrequent social participation (Gilmour, Reference Gilmour2012). Frequent participation was classified as “at least weekly” in the last 12 months for activities typically engaged in often: family or friendship activities outside the household; church or religious activities such as services, committees, or choirs; sports or physical activities with other people; and other recreational activities, including hobbies, bingo, and other games. Frequent participation was classified as “at least monthly” in the last 12 months for activities typically engaged in less often: educational and cultural activities involving other people such as attending courses, concerts or visiting museums; service club or fraternal organization activities; neighbourhood, community, or professional association activities; and volunteer or charity work. For the measurement of social isolation participants were asked to think about the past week when they answered the question: “How often did you feel lonely?” The response options were dichotomized to reflect lonely (all of the time, occasionally, some of the time) versus not lonely (rarely or never) (Ramage-Morin, Reference Ramage-Morin2016).
Analysis
Measures of socio-demographic, health, and social characteristics were analyzed by sexFootnote 7 and age groups (45–64 years of age and 65–85 years of age). Weighted cross-tabulations were used to assess differences between independent variables and assistive device use (hearing, vision, and mobility). Individuals with missing data (i.e., missing because participants did not know the answer, did not provide an answer, or refused to give an answer) were excluded from the analyses with the exception of total household income, for which we included an ‘unknown’ category.
Sample Weights
We used sampling weights with the aim of obtaining estimates that were representative of the eligible population in Canada (https://www.clsa-elcv.ca/). Each individual was assigned a weight that was based on that person’s inclusion probability. The Tracking cohort was recruited into strata based on province, sex, age group; the Comprehensive cohort was recruited based on sex, age group, and residence within data collection site catchment area. This resulted in 136 strata for the Tracking cohort and 56 strata for the Comprehensive cohort. The overall estimated baseline response rates of 9 per cent for Tracking and 10 per cent for Comprehensive were based on the product of pre-recruitment rates and enrollment rates, accounting for eligibility, and were similar to other large cohorts in Canada and internationally. Specifically, the pre-recruitment rate was based on return of “consent to contact forms” for those contacted via the Canadian Community Health Survey Cycle 4.2 on Healthy Aging or via provincial health card registry mailings, and “consent to hear more about the CLSA” for those contacted via random digit dialing. The enrollment rate was the percentage of pre-recruits who completed baseline data collection. The use of trimmed inflation weights allowed us to control for sampling misrepresentation, including unequal probabilities of sampling and non-response, and to infer findings to the eligible Canadian population.
Results
The study sample of 51,338 participants (Appendix Table 1) was weighted to represent 13.2 million Canadians between 45 and 85 years of age, with a mean age of 60.3. Males and females were approximately equally represented (48.5% versus 51.5% respectively). One fifth (20.0%) of community-dwelling Canadians 45–85 years of age reported using an assistive device for hearing, vision, and/or mobility.
Overall Patterns of Device Use
Between 2010 and 2015, an estimated 1,400,000 females and 1,300,000 males in Canada between the ages of 45 and 85 reported currently using at least one assistive device for hearing, vision, or mobility. Mobility devices were used most often, across all sex and age groups (Table 1). Rates of device use increased with age regardless of the type of device. Mobility and vision devices were used most often by females, whereas hearing devices were used most often by males. These sex differences were greater in the 65–85-year-old group than in the 45–64-year-old group.
Table 1: The weighted prevalence of assistive device use by sex and age, population 45–85 years of age, CLSA 2010–2015.

Note. a Number of Canadian population in thousands. Column total of % in brackets adds up to 100% (with occasional round up discrepancies). b Use of any one of devices (hearing, vision, and/or mobility), representing % associated row total given sex and age group. For example, 14.7% of females in the 45–64-year-old group reported using any device (shown), whereas 85.3% of females in the same group did not report using any device (not shown), adding up to 100% (not shown). c Use of hearing, vision, and mobility devices, representing % associated row total given sex and age group. For example, 1.4% of females in the 45–64-year-old group reported using a hearing device (shown) whereas 98.6 % of females in the same group did not report using a hearing device (not shown).
Device Use and Socio-Demographic Characteristics
Table 2 shows the prevalence of assistive device use by selected socio-demographic characteristics. With respect to marital status, those who were married had the lowest prevalence of any device use, and those who were widowed had the highest. The prevalence of any device use among widowed Canadians (37.5% for females and 37.3% for males) was more than twice as high as for married Canadians. When device use was separated out by specific device, the same pattern was observed with mobility devices in all age and sex groups. Those in the lower education and income categories had the highest prevalence of any device use. Generally, Canadians with no post-secondary education reported the highest use for all types of device. As for income, the rates of any device use in the lowest income groups (< $20,000 annually) (36.1% and 35.9% for females and males) were more than three times as high as the rates in the highest income group (> $150,000 annually). Particularly, the rates of hearing device use in the 45–64-year-old, lowest income groups (2.8% and 4.2% for females and males, respectively) were more than twice as high as in the highest income group in the same age and sex categories. In addition, the rates of vision and mobility device use in the 45–64-year-old, lowest income groups (11.5% and 12.3% for females and males, respectively, for vision, and 27.5% and 23.7% for females and males, respectively, for mobility) were more than four times as high as in the highest income group in the same age and sex categories. With regard to hearing devices, however, those whose income was unknown in the 65–85-year-old groups (8.3% for females and 12.9% for males) also reported high use.
Table 2: The weighted prevalence of socio-demographic characteristics and any assistive device use by socio-demographic characteristics (A) and the weighted prevalence of individual assistive device use by socio-demographic characteristics (B), population 45–85 years of age, 2010–2015.
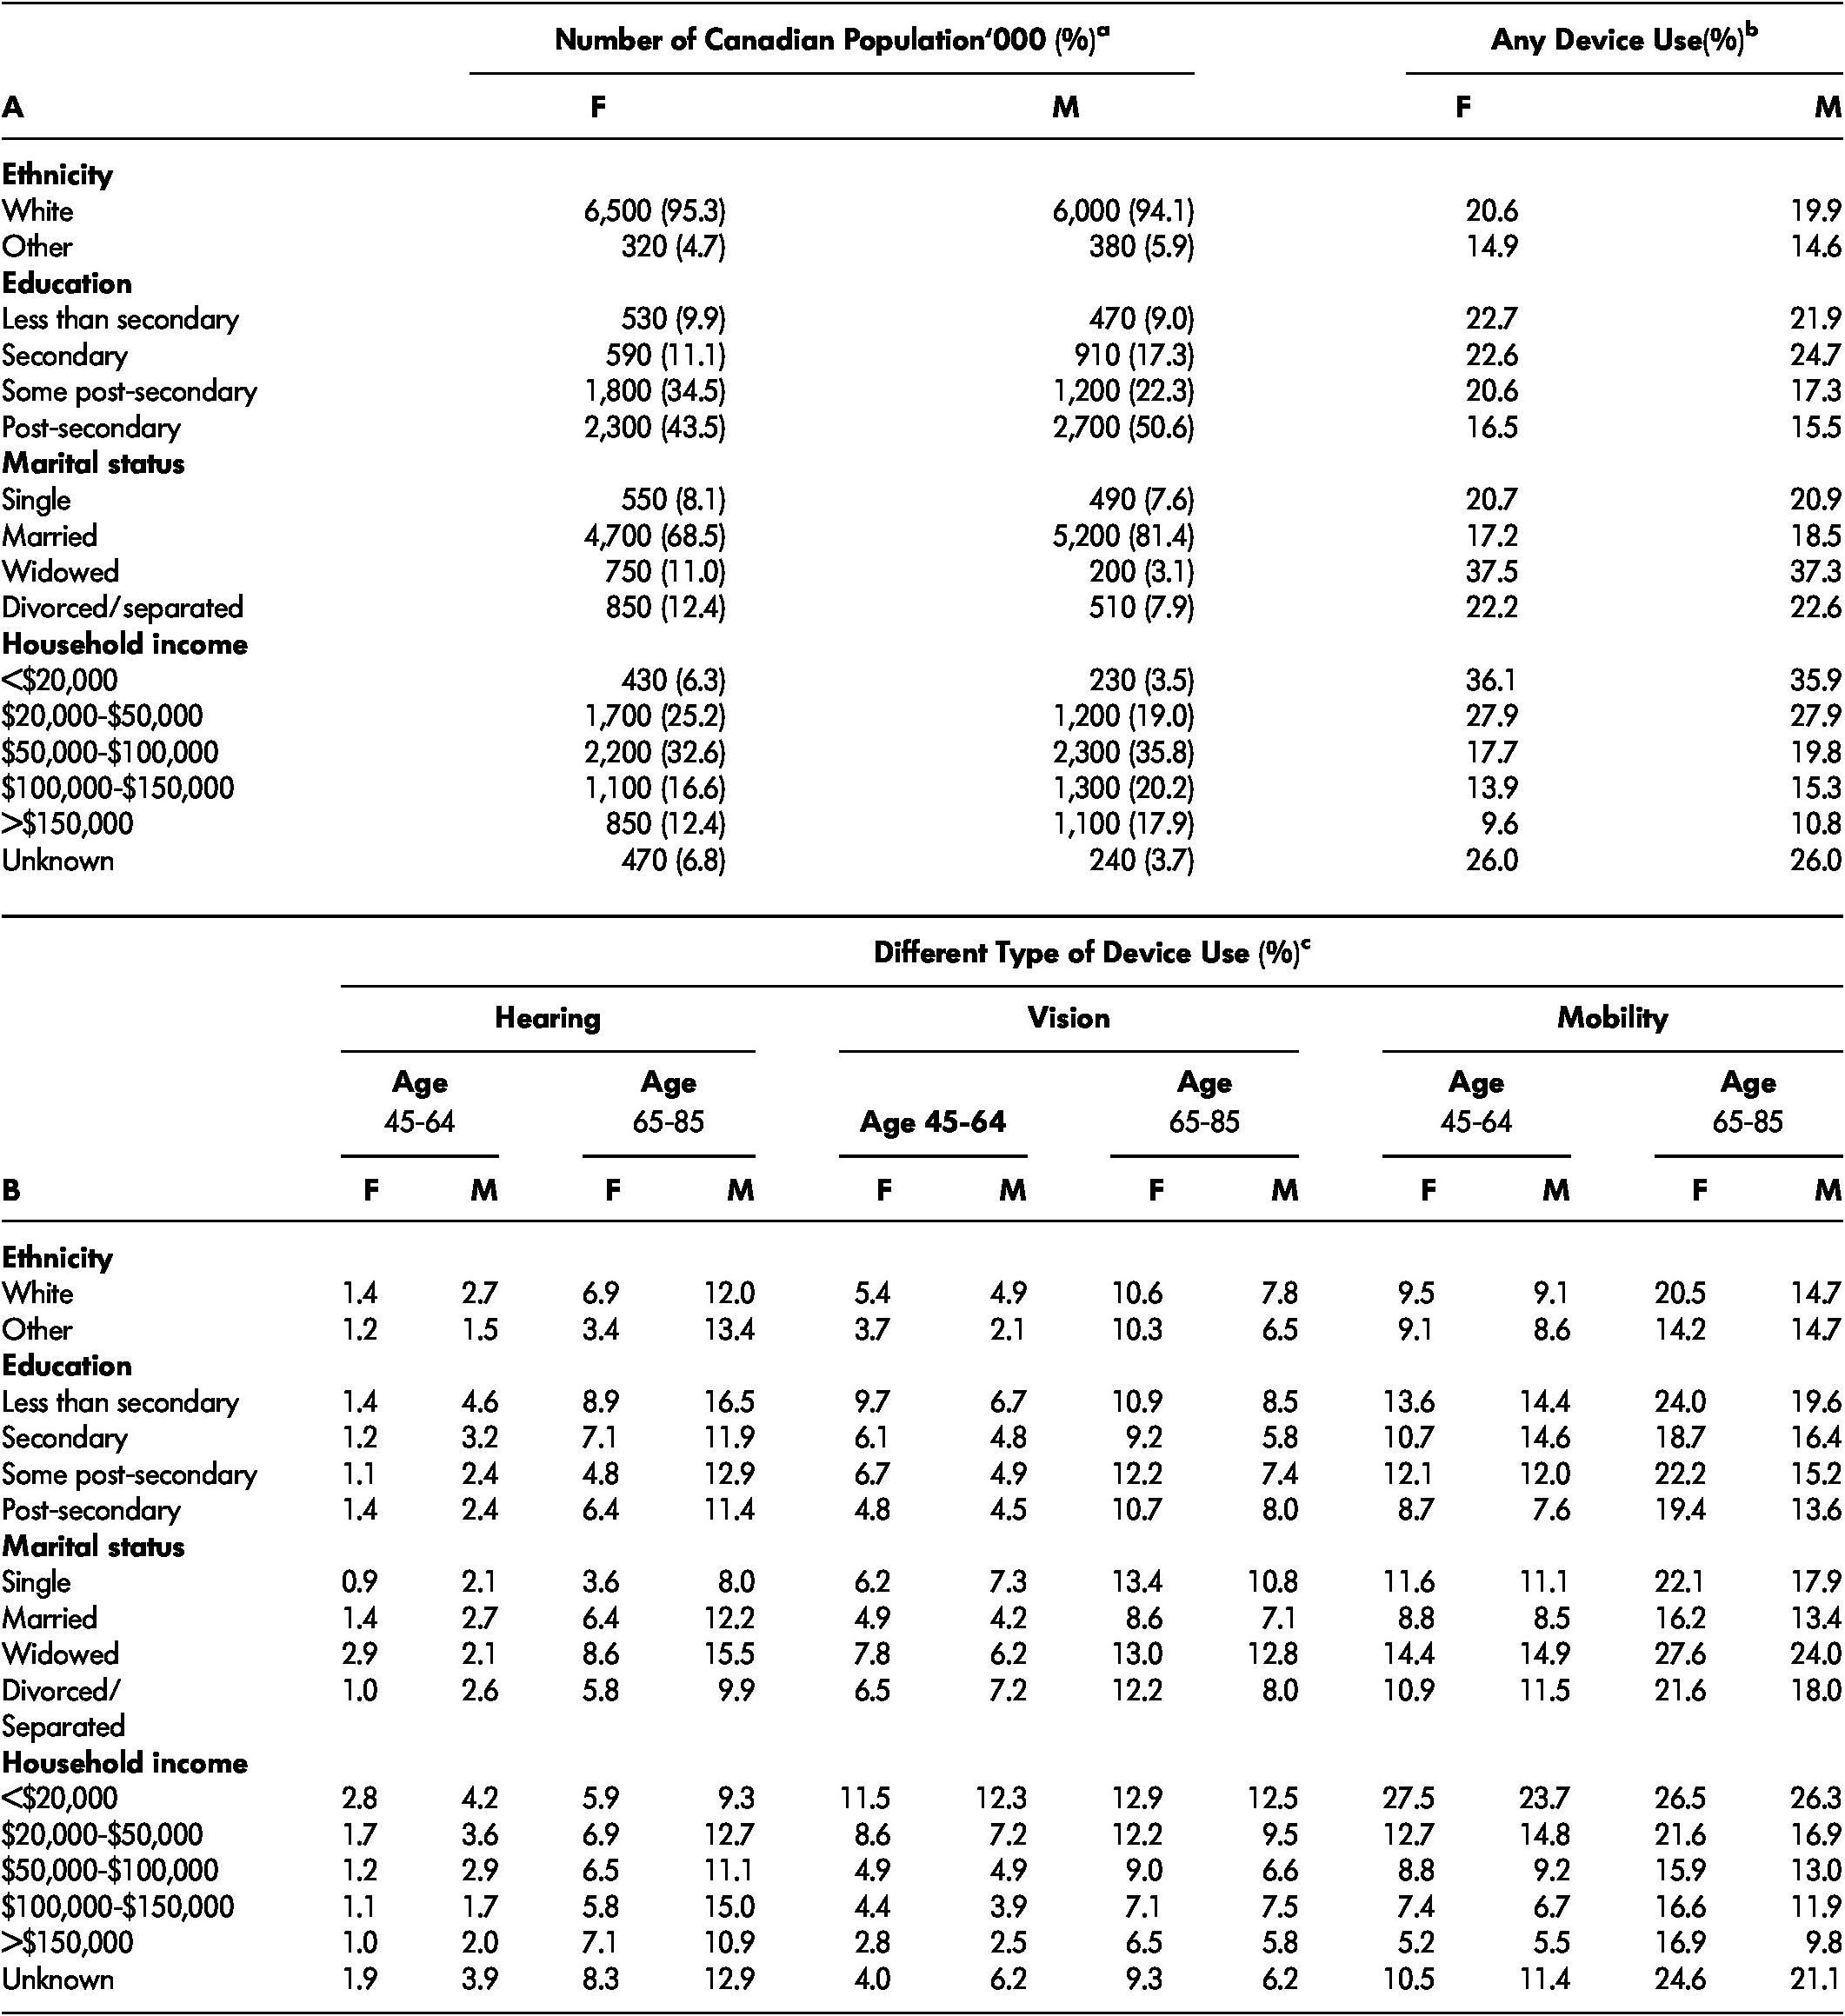
Note. a Number of Canadian population in thousands. Column total of % in brackets adds up to 100% (with occasional round up errors). b Use of any devices (hearing, vision, and/or mobility), representing % associated row total given sex and socio-demographic characteristics. For example, 20.6% of white women reported using any device (shown), whereas 79.4% of women in the same group did not report use of any device (not shown), adding up to 100% (not shown). c Use of hearing, vision, and mobility devices, representing % associated row total given sex, age group, and socio-demographic characteristics. For example, 1.4% of while females in the 45–64-year-old group reported using hearing devices (shown), whereas 98.6 % of white females in the same group did not report use of hearing devices (not shown).
Device Use and Health Characteristics
Table 3 shows the prevalence of assistive device use by selected health characteristics. When examined by number of chronic conditions, those who reported more than five chronic conditions had the highest prevalence of any device use (37.4% for females and 41.8% for males). The prevalence of device use increased as the number of chronic conditions increased, regardless of the device type in all age and sex groups. With respect to home care, those who reported not receiving either formal or informal care had the lowest prevalence of any device use, and those who received both formal and informal home care had the highest. The rates of any device use for Canadians receiving both types of home care (70.0% for females and 73.7% for males) were more than four times as high as for Canadians receiving neither type of home care. When device use was separated out by specific device, the same pattern was observed with mobility devices in all age and sex groups. With regard to hearing and vision devices, however, Canadians receiving only formal home care reported highest use. For example, the rates of hearing device use in 65–85-year-old Canadians receiving only formal care (10.9% for females and 20.8% for males) were highest in the same age and sex categories. When examining subjective perception of health, those who perceived their health as poor had the highest prevalence of any device use. Moreover, the rates of any device use in Canadians perceiving their health as poor (54.3% for females and 56.2% for males) were almost five times as high as for Canadians perceiving their health as excellent. Further, the rates of device use increased as perceived health became worse, regardless of the device type. This pattern was most clearly seen for mobility devices.
Table 3: The weighted prevalence of health characteristics and any assistive device use by health characteristics (A) and the weighted prevalence of individual assistive device use by health characteristics (B), population 45–85 years of age, 2010–2015.
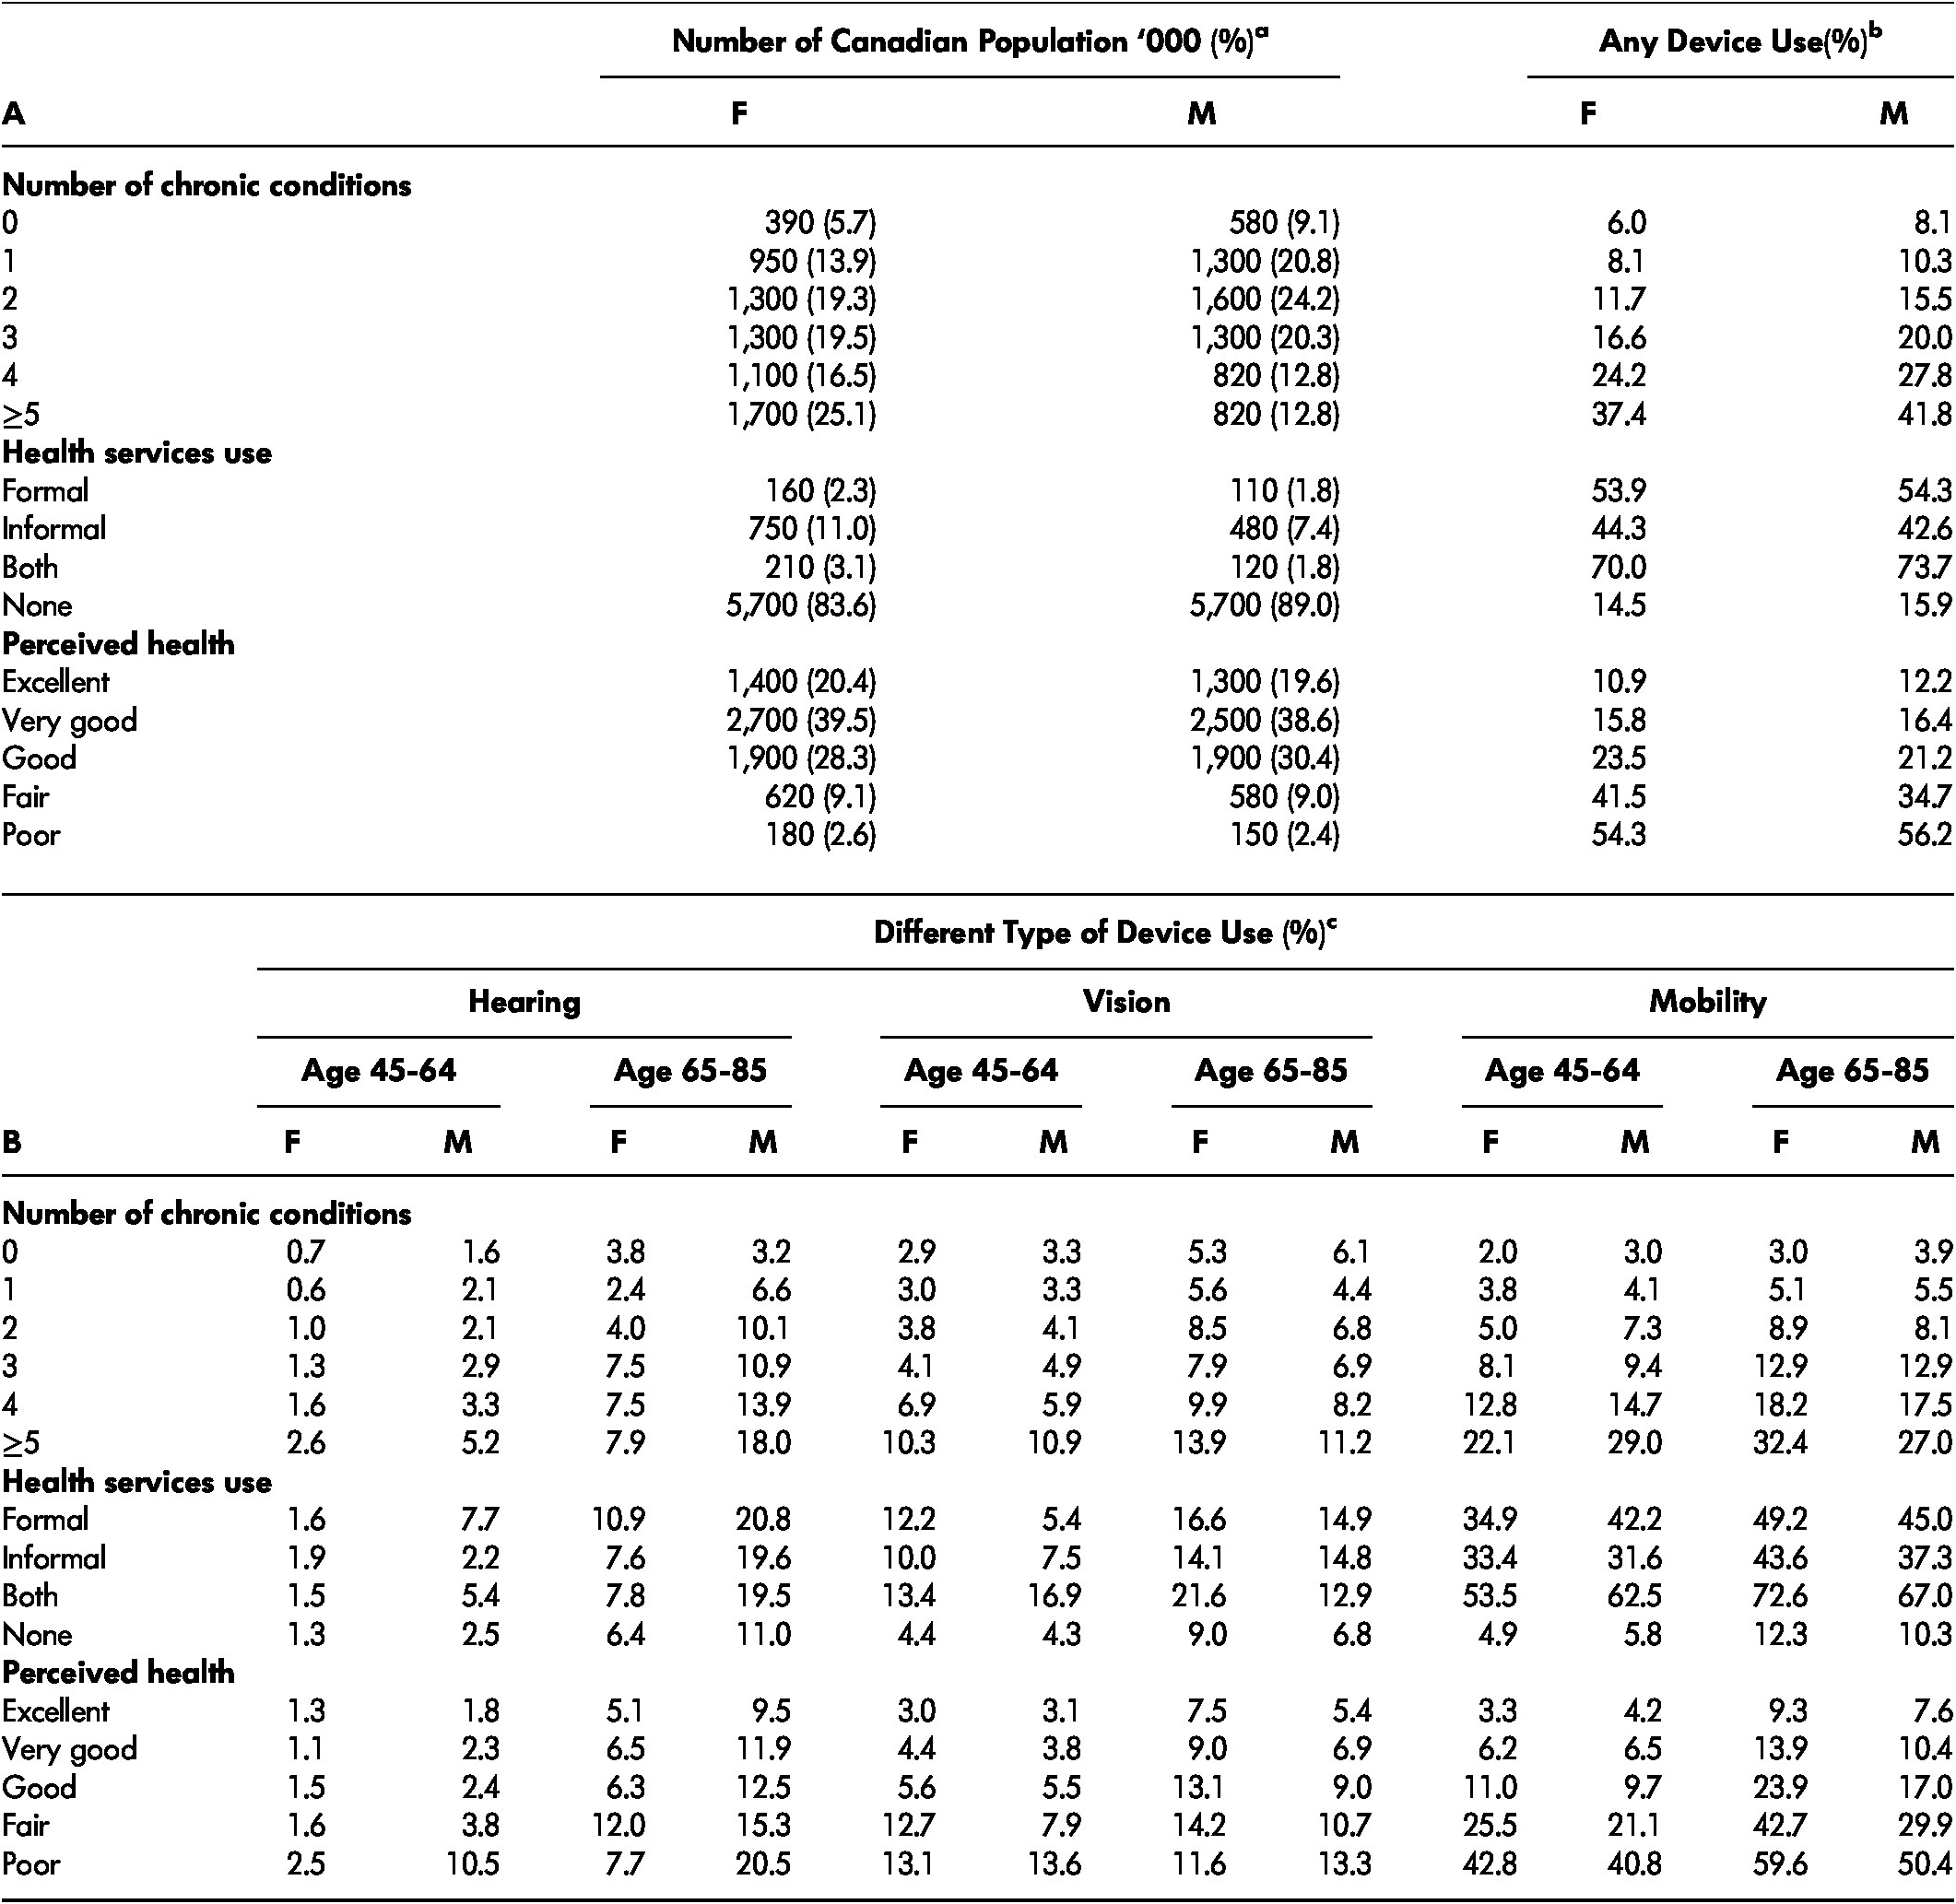
Note. a Number of Canadian population in thousands. Column total of % in brackets adds up to 100% (with occasional round up errors). b Use of any devices (hearing, vision, and/or mobility), representing % associated row total given sex and health characteristics. For example, 6.0% of women without a chronic condition (i.e., number of chronic conditions = 0) reported using any device (shown), whereas 94.0% of women in the same group did not report using any device (not shown), adding up to 100% (not shown). c Use of hearing, vision, and mobility devices, representing % associated row total given sex, age group, and health characteristics. For example, 1.6% of females receiving formal care at home in the 45–64-year-old group reported using hearing devices (shown), whereas 98.4 % of females receiving formal care in the same group did not report using hearing devices (not shown). d We suppressed cells where there were fewer than 10 participants in cells in raw data.
Device Use and Social Characteristics
Table 4 shows the prevalence of assistive device use by selected social characteristics. Those living alone, reporting infrequent social participation, and feeling lonely had higher prevalence of any device use. With respect to living arrangements, Canadians living alone reported the highest use of all devices compared with Canadians living with others, in all age and sex groups except one: male Canadians 65–85 years old living with others (12.2%) reported the highest use of hearing devices. With respect to social participation, Canadians with infrequent social participation reported the highest use of vision and mobility devices in all age and sex groups. As for hearing devices, 45–64-year-old females (1.4%) and 65–85-year-old females (7.0%) and males (12.4%) with frequent social participation reported higher use of hearing devices than those with infrequent social participation. In all age, sex, and device groups, those who reported being lonely had higher use of devices.
Table 4: The weighted prevalence of social characteristics and any assistive device use by social characteristics (A) and the weighted prevalence of individual assistive device use by social characteristics (B), population 45–85 years of age, 2010–2015.
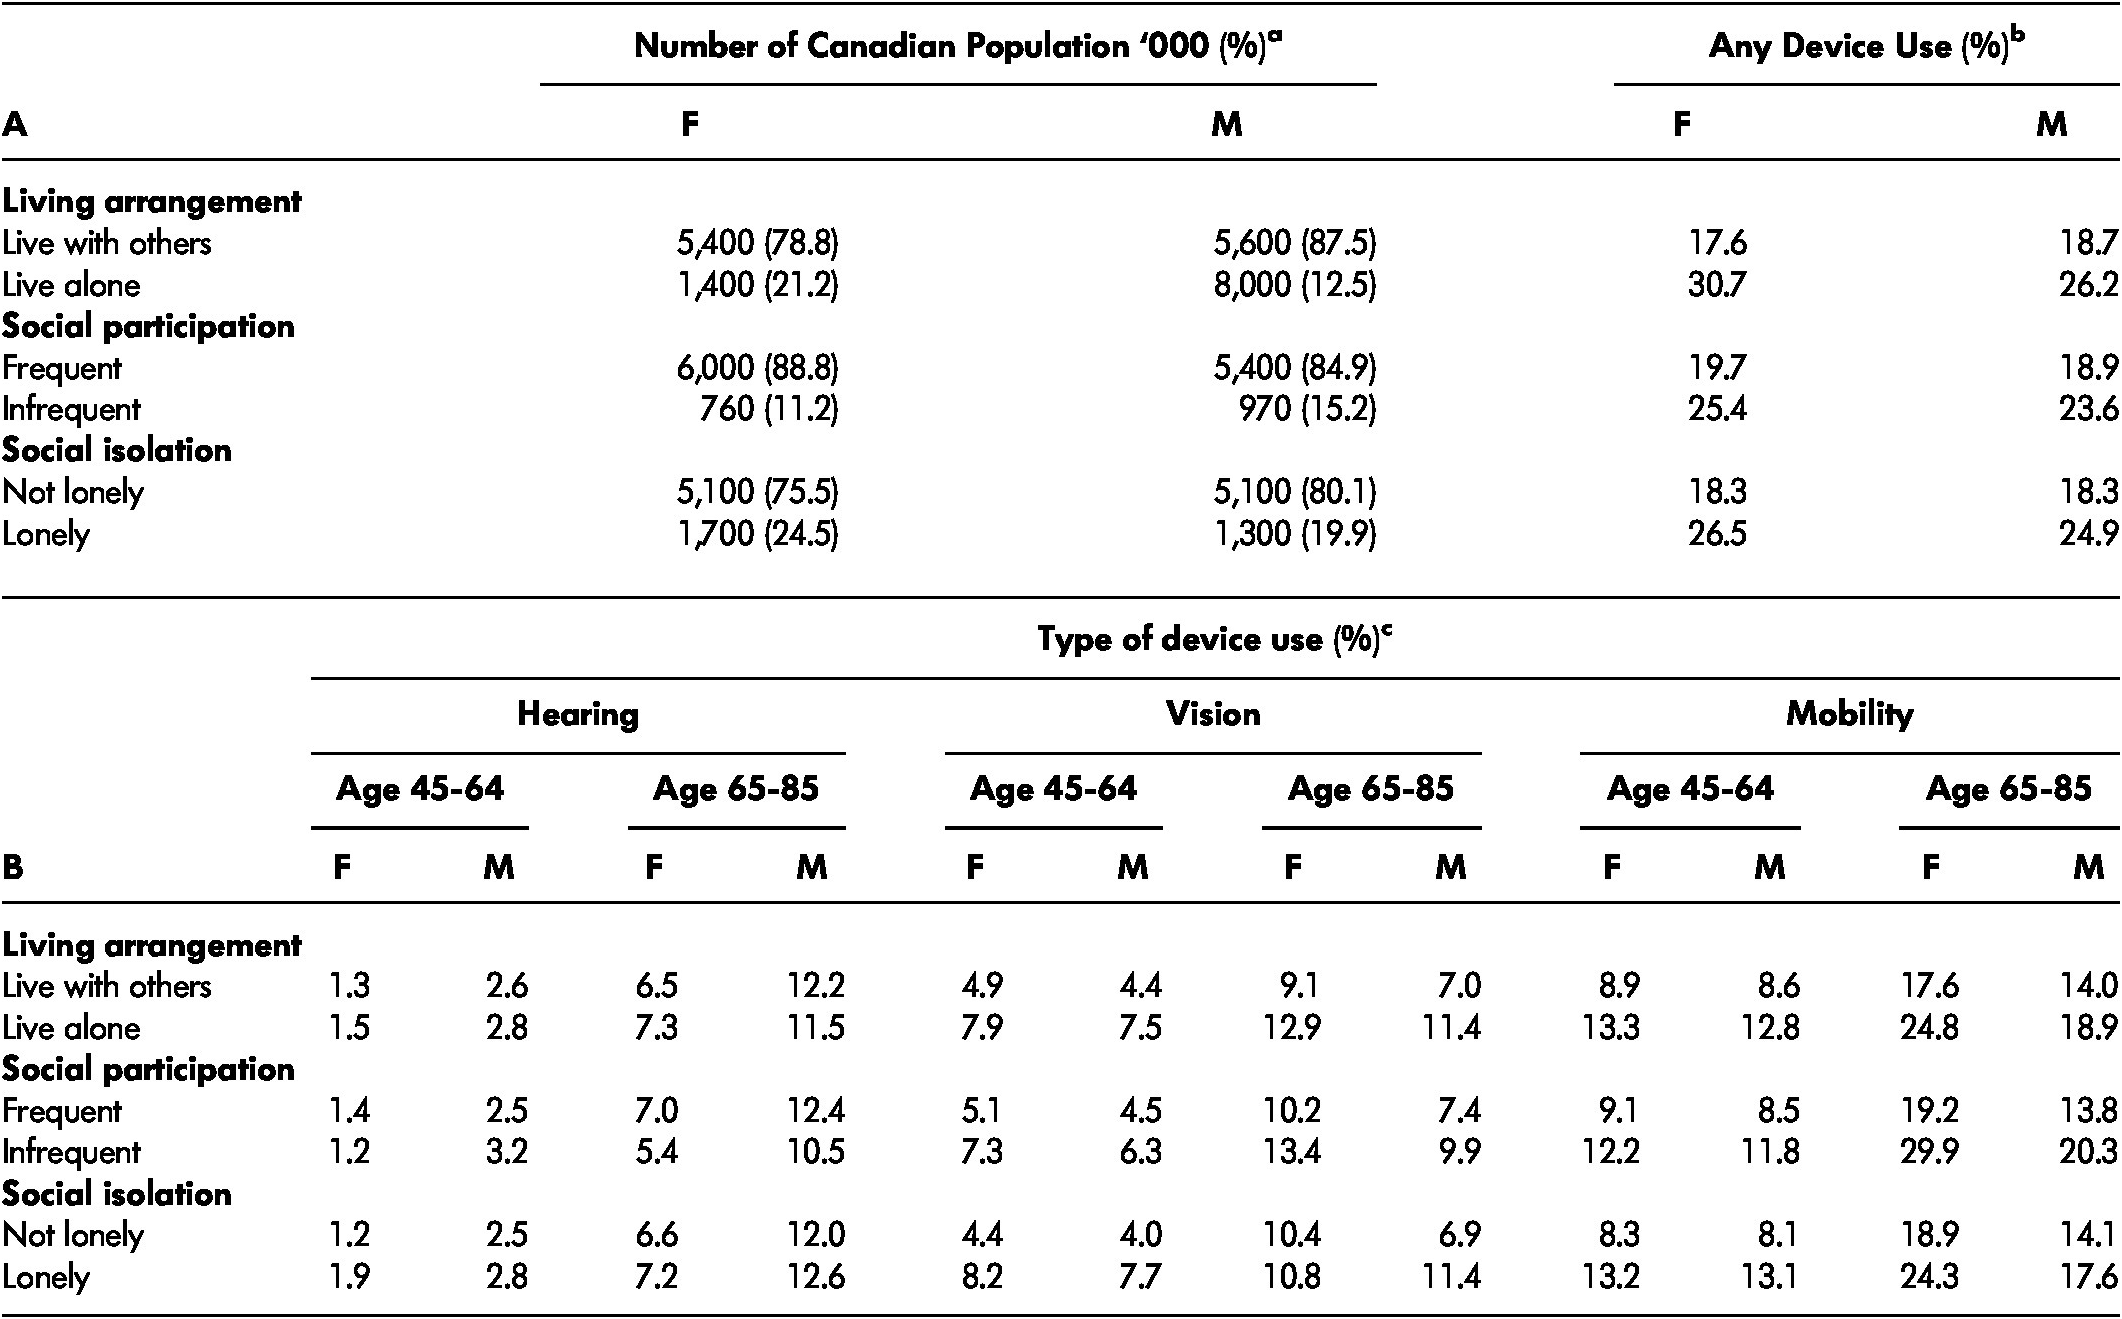
Note. a Number of Canadian population in thousands. Column total of % in brackets adds up to 100% (with occasional round up errors). b Use of any devices (hearing, vision, and/or mobility), representing % associated row total given sex and social characteristics. For example, 17.6% of women living with others reported use of any device (shown), whereas 82.4% of women in the same group did not report using any device (not shown), adding up to 100% (not shown). c Use of hearing, vision, and mobility devises, representing % associated row total given sex, age group, and social characteristics. For example, 1.3% of females living with others in the 45–64-year-old group reported using hearing devices (shown), whereas 98.7 % of female living with others in the same group did not report using hearing devices (not shown).
Discussion
In the current study, as the first step to investigating assistive device use among older adults in Canada, we have identified those who use hearing devices, vision devices, and mobility devices, and described the frequencies with which they use these devices according to socio-demographic, health, and social network factors. Many of the characteristics of device users are supported by the existing literature, and were also common across devices.
The observation that older Canadians (i.e., those in the 65–85-year-old group) were more likely to use assistive devices was consistent with the literature (Arim, Reference Arim2015; LaPlante & Kaye, Reference LaPlante and Kaye2010) as well as being a common perception in society. A point of note is that our findings reflect those who receive assistive devices, but may not be indicative of those who need assistive devices (Gordon, Kerzner, Sheldon, & Hansen, Reference Gordon, Kerzner, Sheldon and Hansen2007).
The observation that Canadians with lower income and educational attainment used assistive devices at higher rates than those with higher income and education was consistent with the literature as well (LaPlante & Kaye, Reference LaPlante and Kaye2010; Shields, Reference Shields2004). Shields (Reference Shields2004) in a Canadian study of 155,000 individuals 15 years of age and older and LaPlante and Kaye (Reference LaPlante and Kaye2010) in a United States study of 217,565 individuals 18 years of age and older also showed that those with lower income and educational attainment had higher rates of mobility device use. It has been suggested that education is a protective factor such that onset of activity restrictions would be delayed for people with high education (Lin & Wu, Reference Lin and Wu2014). It is also possible that once activity restrictions develop, people with higher education may not take up the use of assistive devices as much as people with lower education. It could be hypothesized that this is because they have the resources to compensate in other ways, such as by hiring help. It may also be because of stigma, or device use not fitting their ideal self-image.
The observation that the prevalence of assistive device use was highest among those with low income was somewhat surprising, as it has been reported that cost is one of the major barriers for not using assistive devices (Gopinath et al., Reference Gopinath, Schneider, Hartley, Teber, McMahon and Leeder2011; Gordon et al., Reference Gordon, Kerzner, Sheldon and Hansen2007; McGrath & Astell, Reference McGrath and Astell2017; Statistics Canada, 2008). It may be that the greater proportion of individuals in the lower income group used assistive devices that were inexpensive. The most commonly used vision devices other than glasses or contact lenses in the current study were magnifiers (87%). The most commonly used mobility devices were a cane or walking stick (46%) followed by a walker (25%) and a leg braces or supportive devices (20%), which are relatively inexpensive devices.
There are provincial health insurance programs in Canada; however, these may be viewed as a barrier or inconvenience rather than a support, because most programs cover only some devices, and only part of the entire cost. In addition, there are certain criteria for eligibility to apply for these programs, possibly excluding individuals in need from obtaining necessary devices. Further, some vendors ask for up-front payment, and the cost for repair is not included in the programs (Gordon et al., Reference Gordon, Kerzner, Sheldon and Hansen2007). Lack of full support especially affects those who need assistive devices but have lower income. In addition, there is lack of uniformity across Canada in government funding programs pertaining to assistive devices (Wang, Schreiber, Durocher, & Wilson, Reference Wang, Schreiber, Durocher and Wilson2017), making it difficult to evaluate the role of income.
Consistent with the literature, our analysis also identified that Canadians with poor health have the highest prevalence of assistive device use. It is possible that having poor health, reflected by having a greater number of chronic conditions and/or receiving home care, especially formal care, may inevitably lead to greater contact with health services. In this way, individuals may learn about their impairments, as well as available supports, including assistive devices. Larsen, Mortensen, Kristensen, and Hounsgaard (Reference Larsen, Mortensen, Kristensen and Hounsgaard2018) reported in their review study that health care professionals play an important role when an individual is becoming an assistive device user. Critically, associations between lower income and chronic conditions were reported in the literature; poorer people are most likely to be at risk of developing chronic diseases (Canadian Institute for Health Information, 2016; World Health Organization n.d.). Therefore, the number of chronic health conditions rather than income, per se, may be responsible for the increased rates of assistive device use.
Marital status can be a predictor of assistive device use too. Widowed Canadians reported higher rates of assistive device use, regardless of sex. However, marital status is difficult to interpret because it can reflect income, physical and psychological health, or availability of support, all of which could in turn affect assistive device use.
Some of the characteristics of the device users were unique to specific devices. The prevalence of device use was not uniform among those using hearing, vision, and mobility devices. Rates of Canadians using mobility devices were higher than rates of Canadians using hearing and vision devices. This pattern was also found in studies examining the entire Canadian population 15 years of age and older (Arim, Reference Arim2015; Statistics Canada, 2008). It is possible that the greater prevalence of mobility devices may simply reflect the greater prevalence of mobility impairments (Arim, Reference Arim2015). It is also possible that the greater prevalence is reflecting the availability, awareness of, and affordability of assistive devices. In fact, devices or services for mobility issues are more commonly funded than hearing and vision devices (Wang et al., Reference Wang, Schreiber, Durocher and Wilson2017). Lack of awareness/knowledge, for example, of vision devices was reported as a critical barrier to technology acquisition (Gold, Zuvela, & Hodge, Reference Gold, Zuvela and Hodge2006; McGrath & Astell, Reference McGrath and Astell2017). According to McGrath and Astell (Reference McGrath and Astell2017), their participants misunderstood what services were available to them, believing that they had to be legally blind to access low vision services from the Canadian National Institute for the Blind (CNIB).
The sex difference seen in device use, especially hearing and mobility devices, was consistent with existing literature. In the current study, hearing device use was higher among Canadian males than females. Relatedly, Corna, Wade, Streiner, and Cairney (Reference Corna, Wade, Streiner and Cairney2009) reported in a Canadian study of adults 50 years of age and older that men had higher rates of corrected and uncorrected hearing impairment than women. Conversely, we found that mobility device use was higher among Canadian females than males. This is consistent with another Canadian study; Smith, Ciesbrecht, Mortenson, and Miller (Reference Smith, Ciesbrecht, Mortenson and Miller2016) reported that among older adult manual wheelchair, power wheelchair and scooter users combined a greater proportion were women (54.5 % aged 45-64; 70.8% aged 65-74 and 62.1% aged 75+). (See Kaye, Kang, & LaPlante, Reference Kaye, Kang and LaPlante2000; LaPlante & Kaye, Reference LaPlante and Kaye2010 for similar patterns in United States studies.) We also found that the sex difference was amplified at later life such that greater difference between males and females was observed in Canadians 65–85 years of age than in Canadians 45–65 years of age, regardless of the types of device use (see also Smith et al., Reference Smith, Ciesbrecht, Mortenson and Miller2016).
Regarding social connectedness, there is a difference between hearing device use and vision and mobility device use. Those with hearing devices had a higher prevalence of social participation; hearing assistive device users tended to participate in social activities more frequently. Hearing devices are important for improving basic communication function. This could explain why married Canadians had higher rates of using hearing devices, reflecting other persons’ needs as well as their own needs. Relatedly, the sociocultural context, including family, friends, and society, plays an important role when individuals are evaluating and acknowledging need, and incorporating the devices into their lives (Larsen et al., Reference Larsen, Mortensen, Kristensen and Hounsgaard2018). On the other hand, Canadians with vision and mobility devices had a lower prevalence of social participation than those without such devices. This cannot be interpreted as causal, but it highlights the need to further study and understand the impact of sensory losses on social participation. Vision and mobility devices are important for improving basic transportation functions and instrumental activities of daily living; this could explain why Canadians living alone had higher rates of use of these devices. Despite the obvious positive impact of these devices on social life, there is still a negative impact associated with device use, such as stigma, for example. Vision and especially mobility devices are “visible” and may affect personal desired self-image (Larsen et al., Reference Larsen, Mortensen, Kristensen and Hounsgaard2018). For some individuals, the benefits of using assistive devices may not outweigh the potential stigma. Therefore, there is more room for devices to be improved in order to have positive impacts on social connectedness.
The current study is a cross-sectional descriptive study, and thus limited in investigating the dynamic nature of aging and the use of assistive devices across time. Also, we are limited in studying differences in assistive device use according to gender and gender roles. Further, an exploration of the differences in assistive device use by ethnicity was limited. Participants other than white comprised approximately 5 per cent of the total population in the current study whereas they comprise closer to 20 per cent of the total Canadian population (Chui, Reference Chui2013). This is, in part, due to the criterion that CLSA participants had to be able to respond in English or French (i.e., selection bias). Similarly, males typically have a shorter lifespan; with death, the characteristic of interest is no longer observable, resulting in survival bias. It should also be noted that the application of sampling weights, at best, allows findings to be generalizable to the Canadian population. Yet, the current study shows that sociocultural context is an important factor impacting differences in assistive device use, supporting a current view in the literature (e.g., Larsen et al., Reference Larsen, Mortensen, Kristensen and Hounsgaard2018). At the same time, the current study shows various factors that can affect processes of acquiring and using assistive devices. Despite the limitations, these results give insight into the current status of assistive device use among older adults in Canada. They provide a snapshot of the patterns of use for assistive devices related to hearing, vision, and mobility, and the health and social characteristics of assistive device users in Canada.
Conclusion
Assistive devices for mobility, hearing, and vision are used by one in five community-dwelling older adult Canadians. Consistent with the literature, we found that assistive device use increased by age category, and that mobility devices were used most often. Assistive device use was highest for Canadians who have less education, are widowed, have lower income, or have poorer health. Males were more frequent users of hearing devices whereas females were more frequent users of vision and mobility devices. Hearing device users reported higher levels of social participation than non-users in the current study. However, we found that device users generally rated their overall health lower than non-users. These findings contribute to the body of knowledge regarding assistive device use among older adults in Canada.
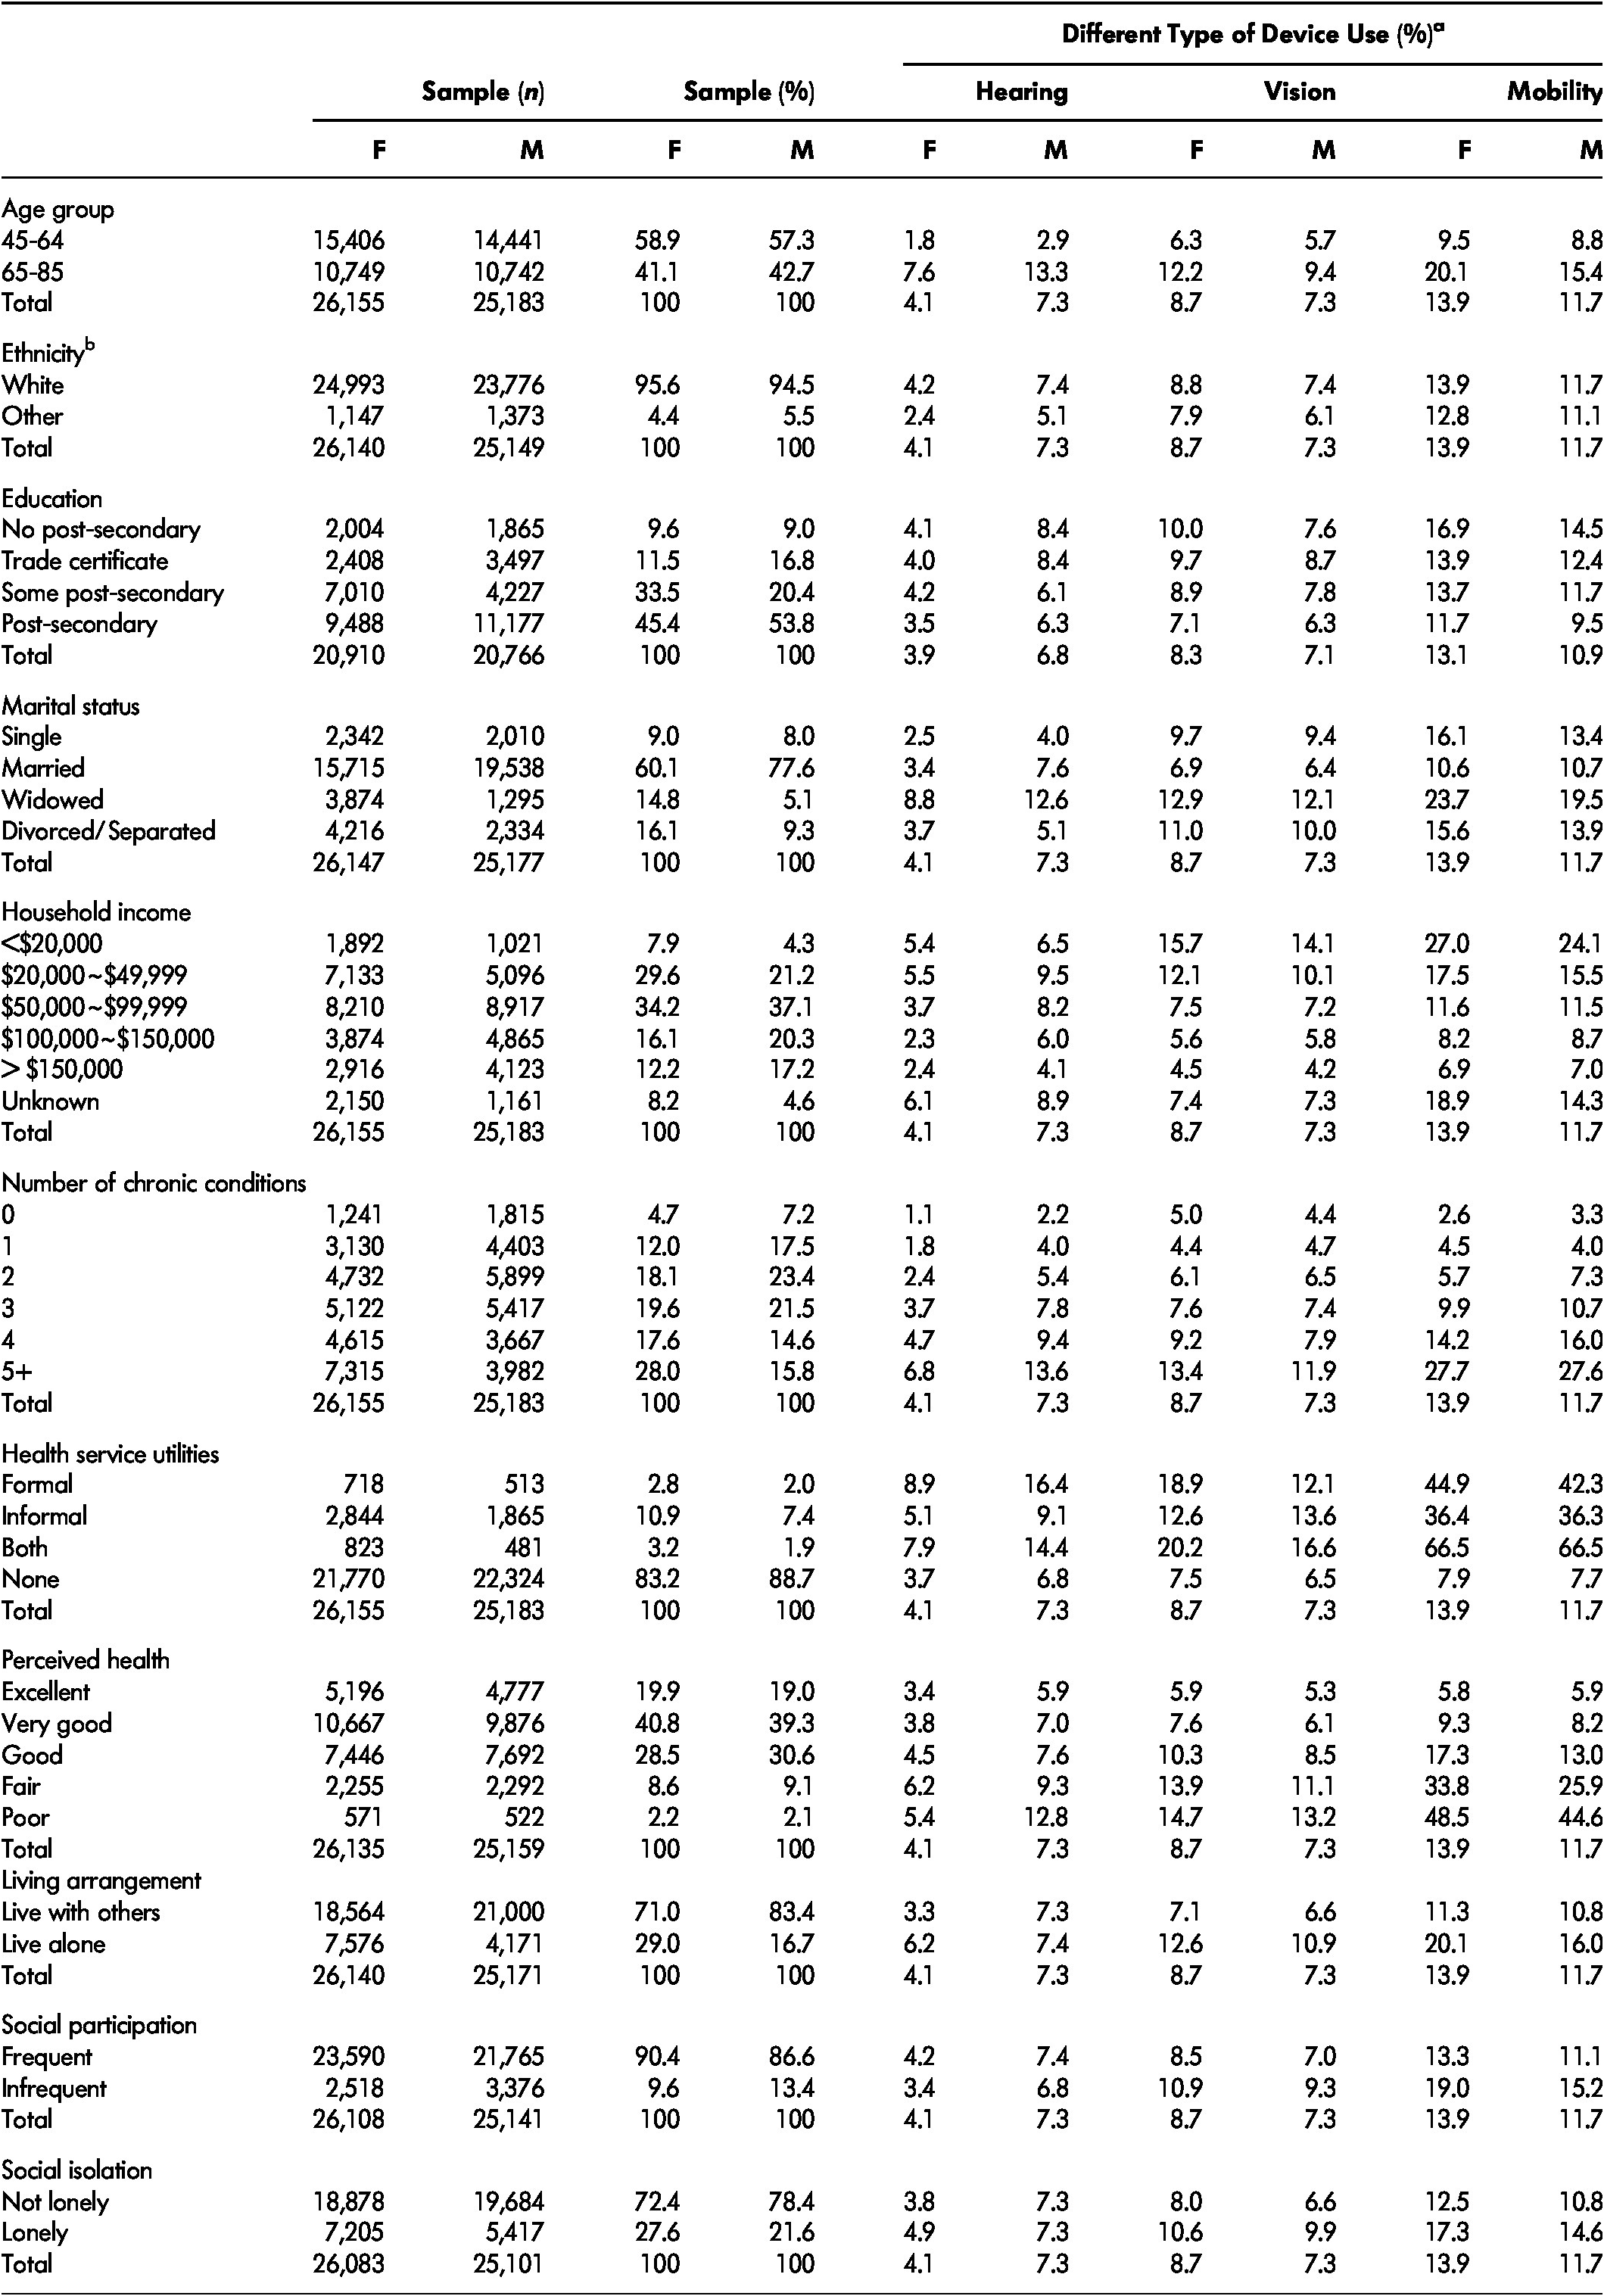
Appendix
Table 1: The unweighted prevalence of assistive device use by social characteristics, population 45–85 years of age 2010/2015.