Introduction
Identification of the central sulcus (CS) on MR imaging is important for accurate anatomic localization of motor and sensory cortices, especially in patients undergoing surgical treatment. Several topographic features can be utilized on CT and MR imaging to localize the CS.Reference Naidich, Tang, Ng and Delman 1 - Reference Wagner, Jurcoane and Hattingen 4 A less commonly known feature is the thin cortex sign (TCS).Reference Naidich, Tang, Ng and Delman 1 , Reference Meyer, Roychowdhury, Russell, Callahan, Gitelman and Mesulam 5 The cortical thickness of the posterior bank of the CS is among the thinnest in the brain, and the cortical thickness of the anterior bank is 1.5 to 2 times greater on T1-weighted images. TCS has been described in other studies using measurements of cortical thickness from T2-weighted MR images in patients with vasogenic edema from metastases.Reference Biega, Lonser and Butman 6 , Reference Togao, Yoshiura and Mihara 7 Low signal intensity on FLAIR images has been shown to landmark the perirolandic cortex as well.Reference Karaarslan and Arslan 8
Diffuse cortical injury (DCI) often results from hypoxic-ischemic encephalopathy (HIE), most commonly from cardiac or respiratory arrest.Reference McKinney, Teksam and Felice 9 , Reference Hossmann and Joehn-Berlage 10 The clinical diagnosis of HIE is primarily made by history and physical examination (including pupillary light response, corneal reflex, motor response to pain, and myoclonus status epilepticus), with imaging, EEG, and somatosensory-evoked potentials as supporting evidence.Reference Commichau 11 Previous studiesReference Hossmann and Joehn-Berlage 10 , Reference Siskas, Lefkopoulos, Ioannidis, Charitandi and Dimitriadis 12 have described the MRI findings in HIE, which include cortical hyperintensity on diffusion-weighted imaging (DWI), T2-weighted images, and FLAIR images.
On occasion, we have noted loss of the TCS in patients with HIE presenting to our institution, a sign we have termed the “uniform cortex sign” (UCS). Even though these patients have severe neurological compromise, these MRI findings can be difficult to detect. As the UCS has not been described previously, its effectiveness to detect DCI is unknown.
The purpose of this study is to introduce the UCS and evaluate its performance as a test for the presence of DCI.
Methods
Institutional review board approval was obtained for this retrospective study, and informed consent was waived by the IRB.
Control Patients
Some 9 control patients (CPs) were identified from the population at our institution who underwent outpatient MR screening for intracranial aneurysms because of significant family history of cerebral aneurysm between July and November of 2014 (mean age=41 years, age range=13-59 years). There were 4 males (mean age=45 years, age range=13-59 years) and 5 females (mean age=37 years, age range=26-55 years). Their MR studies were unremarkable. No patients were excluded.
Diffuse Cortical Injury Patients with UCS
A total of 8 patients had a decreased level of consciousness or were comatose at presentation and had the UCS on MR imaging at our institution between May and November of 2014 (mean age=36 years, age range=12-75 years). There were 4 males (mean age=39 years, age range=16-75 years) and 4 females (mean age=32 years, age range=12-55 years) (see Table 1). All patients had diffuse cortical injury on clinical exam (as determined by either a neurologist or a critical care physician) and MRI, and 6 patients also had confirmatory EEG abnormalities (the other 2 did not have an EEG). Some 7 patients suffered from hypoxic-ischemic encephalopathy (HIE). Of these patients, 3 had cardiopulmonary arrest, 2 had cerebral hypoperfusion from hanging, 1 had a pulseless electrical activity arrest from tricyclic antidepressant overdose, and 1 had hypoxia from drowning. Some 6 HIE patients underwent the hypothermia protocol. All 7 patients with HIE died in hospital after life support was withdrawn. No brain autopsies were performed. One patient was admitted with viral meningoencephalitis and made a full recovery.
Table 1 Uniform cortex sign (UCS) in patients with diffuse cortical injury
MR Imaging, Processing, and Review
MR imaging was performed on 1.5T scanners (Signa HDx or Optima MR450w; GE Healthcare, Milwaukee, Wisconsin). Our MRI protocol included axial DWI (10000/114 [TR/TE]; 5-mm section thickness; b=1000 s/mm2; matrix 128×192); axial T2 FSE (3500/85 [TR/TE]; 2-mm section thickness; matrix 256×256); sagittal FLAIR CUBE with axial and coronal reformats (TR/TE=6000/130; auto TI; section thickness=1.8 mm; matrix=224×224). The FOV was 24×24 cm for all sequences.
Using selected MR images from two CPs (TCS 8 and 9) and one DCI patient (UCS 8), three fellowship-trained neuroradiologists with 30, 25, and 8 years experience (DP, DL, MS) were given a tutorial to identify the TCS and UCS by the principal investigator (AL) and study coordinators (AP, BB). The selected images consisted of two images from axial DWI, axial T2, and axial FLAIR sequences in addition to a single paramedian sagittal FLAIR image and seven contiguous coronal FLAIR images. The DCI tutorial patient did not have an axial T2 sequence performed. Effort was made to exclude slices that included other signs associated with the central sulcus or other abnormalities in the DCI patients. On axial and sagittal images of the CPs, the readers were shown that the cortical thickness of the posterior bank of the CS was thinner than the anterior bank of the CS and the posterior banks of adjacent sulci (Figure 1). Either criterion could be used to identify the CS. On coronal images of the CPs, the CS could be identified by comparing the thickness of the paramedian cortex to that of the temporal cortex. Conversely, these differences in cortical thickness are not apparent with DCI, as the cortical thickness is relatively uniform (Figure 2). The tutorial patients were not used in the subsequent testing.

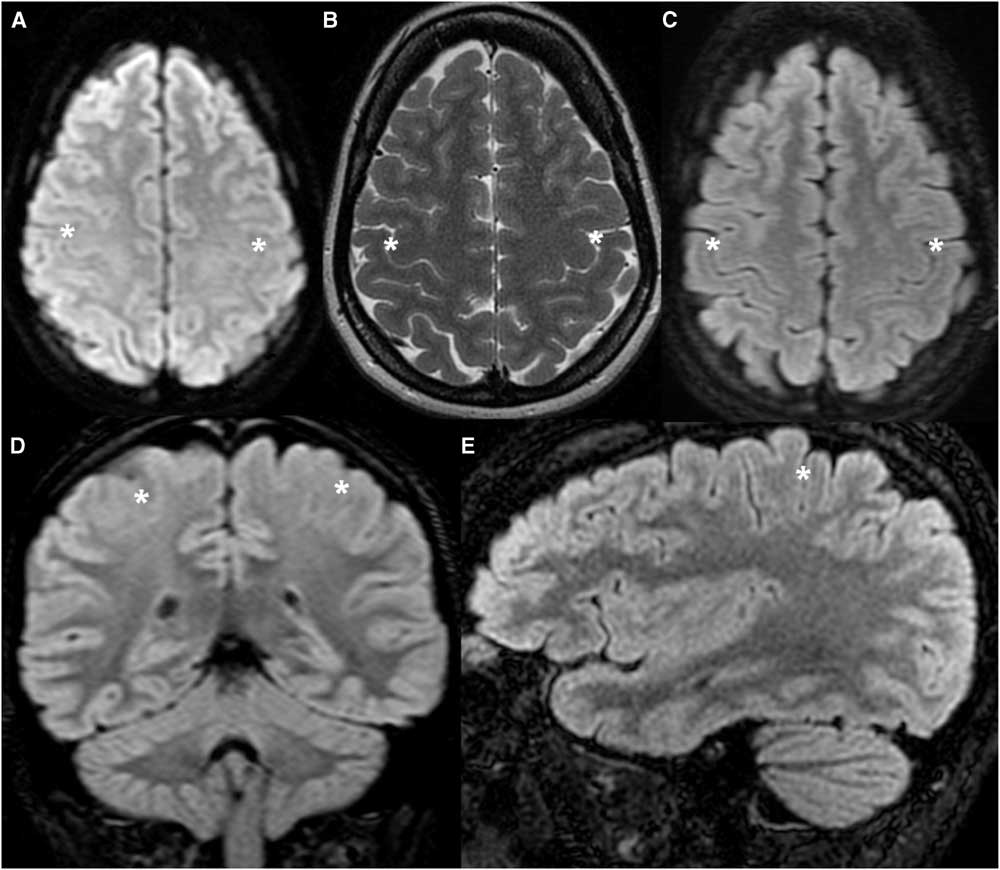
Figure 1 Healthy tutorial control patient (TCS 9) demonstrating the normal appearance of the cortex along the posterior bank of the CS. (A) Axial DWI. (B) Axial T2-weighted image. (C,D,E) Axial, coronal and sagittal FLAIR images. The cortex along the posterior bank of the CS (asterisk) is thinner than the anterior bank of the CS and the posterior banks of adjacent sulci in the axial and sagittal planes, and thinner than the temporal cortex in the coronal plane.
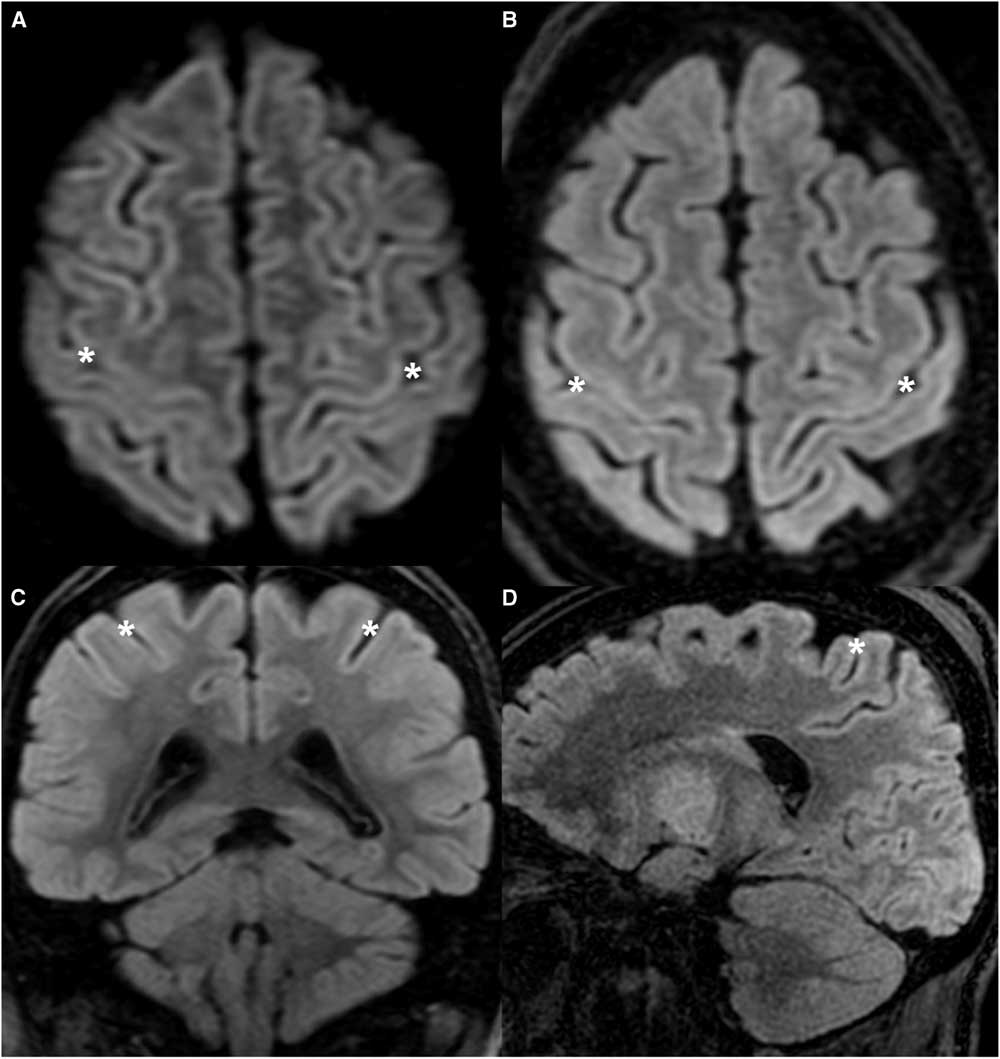
Figure 2 Tutorial patient with DCI (UCS 8) demonstrating the classic appearance of the UCS. (A) Axial DWI. (B,C,D) Axial, coronal, and sagittal FLAIR images. Cortical thickness is fairly uniform throughout, including the anterior and posterior banks of the CS (asterisk). The abnormality is subtle and could be easily overlooked.
The remaining seven DCI (UCS) and seven control (TCS) cases were used to determine the utility of the UCS in identifying patients with diffuse cortical swelling. The cases were presented in random order. Each radiologist was independently shown cases of selected images (similar slices as tutorial images) on a PACS workstation (GE Centricity, Milwaukee, Wisconsin). The reader was allowed to window the images according to their preference. No patient information was visible on these images. No measurements were made. In one control patient, no axial FLAIR images were available.
The presence of the TCS or UCS was determined in binary fashion. The data for the three readers were grouped for each patient, and a consensus response was derived based on unanimity or majority rule.
An online kappa calculator was used to measure κ statistics for interrater reliability.Reference Randolph 13
Results
The results of the study are tabulated in Table 1. In all CPs, the cortex of the posterior bank of the CS was thinner than the anterior bank of the CS or the posterior banks of other adjacent sulci (Figure 3). Conversely, in 6 of the 7 patients with DCI, the cortex of the posterior bank was thicker than normal and relatively uniform compared to the anterior bank as well as adjacent gyri (Figure 4).
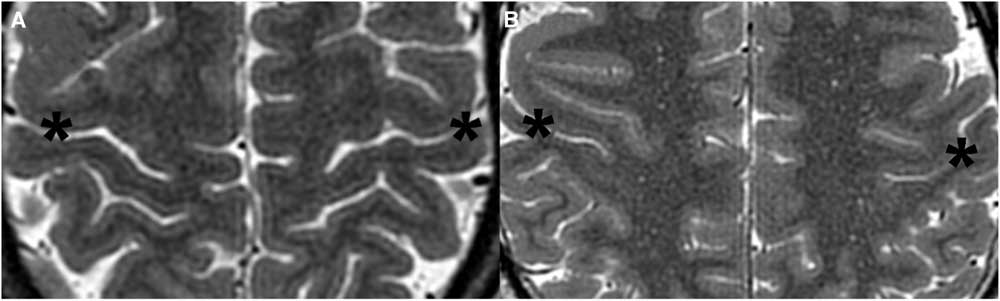
Figure 3 Cropped axial T2-weighted images demonstrating the TCS in representative control patients. (A) 54-year-old male (TCS 5). (B) 33-year-old male (TCS 7). Note the thin cortex along the posterior bank of the CS (asterisk) compared with the anterior bank of the CS and posterior banks of other adjacent sulci.
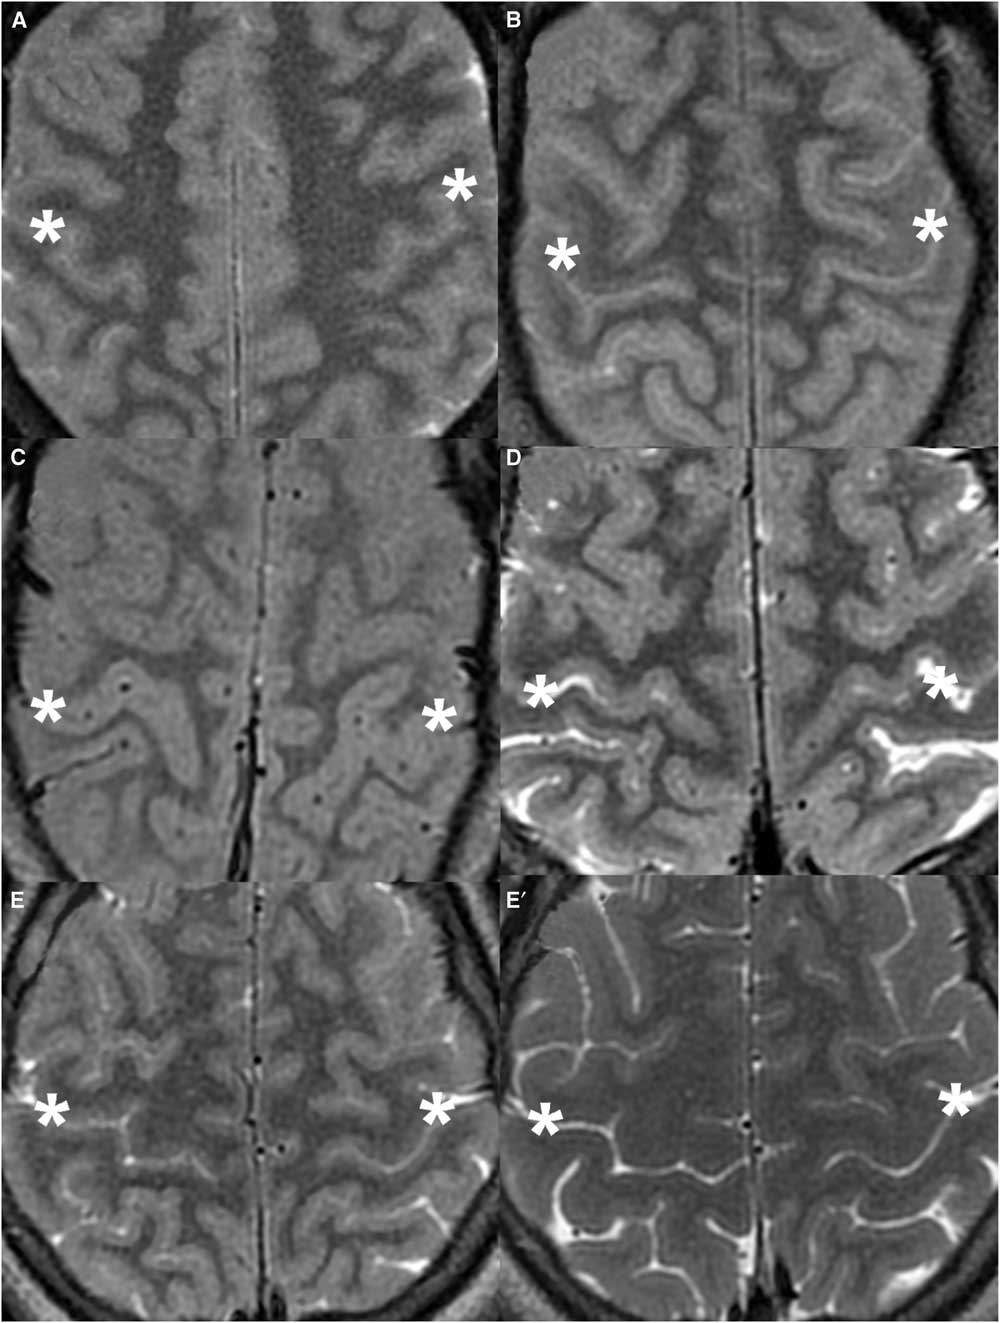
Figure 4 Cropped axial T2-weighted images demonstrating the UCS in representative DCI patients. (A) 55-year-old female (UCS 3). (B) 49-year-old female (UCS 6). (C) 18-year-old male (UCS 7). The cortical thickness of the posterior bank of the CS (asterisk) is uniform compared with the posterior banks of other sulci. All three readers detected the UCS in these patients. (D) 75-year-old male (UCS 4). The UCS is less apparent, where the medial cortex of the posterior bank of the CS is thicker than usual but the lateral cortex is fairly normal. Two of the three readers felt that the UCS was present in this patient. (E) 16-year-old male (UCS 2) during admission. (E’) Patient UCS 2 after full recovery 3 months after admission. The UCS is difficult to appreciate on the initial exam. None of the readers felt that the UCS was present. When compared to the normal appearance on the follow-up exam, subtle diffuse cortical swelling and sulcal effacement are evident on the initial exam.
Performance of the UCS as a Test
The accuracy of the presence of a UCS as a test for DCI was 86%. There was a high rate of agreement between the readers (multirater κ=0.81). Figure 4 shows representative axial T2 images from study patients with DCI. The UCS was correctly identified in six of the seven patients with diffuse cortical injury (unanimously in five patients and by a majority [two of three] in one). None of the readers identified the UCS in UCS 2 (who presented with viral meningoencephalitis and subsequently made a full recovery). Reader 2 also thought that UCS 4 (who had suffered from cardiac arrest) was normal.
Discussion
It has been known for over 100 years that the cerebral cortex is not uniform. The cortex of the posterior bank of the central sulcus is among the thinnest in the brain.Reference Naidich, Tang, Ng and Delman 1 , Reference Meyer, Roychowdhury, Russell, Callahan, Gitelman and Mesulam 5 In 1908, BrodmanReference Brodman 14 reported mean cortical thickness measurements of 3.94 and 1.86 mm for motor and sensory cortices, respectively, based on autopsy specimens. Similar results were published in 1925 by von Economo and Koskinas.Reference von Economo and Koskinas 15 The central sulcus is the only sulcus in the brain with a difference in cortical thickness between the anterior and posterior banks this large. In 1996, MeyerReference Meyer, Roychowdhury, Russell, Callahan, Gitelman and Mesulam 5 found that cortical thickness measurements from T1-weighted images provided a method for locating the primary motor and primary somatosensory cortices. This study concluded that the difference in cortical thickness across the banks of the central sulcus is so pronounced that it can be readily localized by direct visual inspection. Another studyReference Karaarslan and Arslan 8 showed that the signal intensity of the perirolandic cortex on FLAIR images is significantly lower than the cortex of the superior frontal cortex.
DCI often results from HIE.Reference McKinney, Teksam and Felice 9 This is most commonly from cardiac or respiratory arrest.Reference Karaarslan and Arslan 8 Other causes include hypoglycemia, overdose, toxins, strangulation, near drowning, status epilepticus, and electrocution.Reference Commichau 11 The clinical diagnosis of HIE is primarily made by history and physical examination, with imaging, EEG, and somatosensory-evoked potentials as supporting evidence.Reference Commichau 11 Previous studiesReference McKinney, Teksam and Felice 9 , Reference Siskas, Lefkopoulos, Ioannidis, Charitandi and Dimitriadis 12 describe cortical hyperintensity on DWI, T2-weighted, and FLAIR images in patients with HIE. However, if the patient is imaged in the early subacute phase, the T2-weighted images may reveal only subtle abnormality.Reference Arbalaez, Castillo, Mukherji and Diffusion-weighted 16 , Reference Kawahara, Takeda and Tanaka 17 Conversely, a “supernormal” appearance can occur where T2 signal intensity in the cortex is increased and there is effacement of subarachnoid spaces presumably from cortical edema.Reference Lee, Nathanson, Fox, Pelz and Lownie 18 In the second week, parenchymal T2 signal intensity can decrease.Reference Lansberg, Thijs and O'Brien 19 Diffuse cortical hyperintensity on FLAIR can also be seen with viral encephalitis, presumably from cortical injury.Reference Lee, Na and Choi 20
Our cases demonstrated this spectrum of MRI findings. While all readers identified the UCS in five patients, reader 2 felt that TCS was present in a cardiac arrest patient imaged at day 6 (UCS 4), and all readers regarded the day 7 MRI of the patient with viral meningoencephalitis as normal (UCS 2). We postulate that the extent of cortical swelling is dependent on the degree of injury and timing of the exam. We suspect that UCS 2 and UCS 4 had relatively mild cortical swelling at the time of imaging, and hence only mild cortical thickening and signal change. While the UCS is particularly difficult to appreciate in UCS 2, some cortical swelling is appreciable when compared with the normal follow-up MRI acquired 3 months later (Figure 4G,G'). This case also shows that the UCS is potentially reversible.
Limitations
We acknowledge several limitations to this study. First, our study was small, comprising only seven DCI patients and seven CPs. We identified the DCI group based on MR findings. Patients with diffuse cortical injury but only subtle cortical thickening across the central sulcus may have been missed. Others with diffuse cortical injury were not included if UCS was absent. Our study group represents only a few of the causes of DCI. Future studies will be necessary to determine if the UCS is present in patients with such other causes as hypoglycemia, status epilepticus, and electrocution. For our normal population, we felt that the aneurysm-screening population would be least likely to have a brain abnormality to compromise TCS. That said, in our experience, the TCS is apparent in essentially all “normal” outpatient studies in our everyday work. Second, our results are not quantitative but based on subjective interpretation of the three neuroradiologists. This was purposeful, as qualitative evaluation is more readily employed in routine practice. Third, the presence of other topographic features to identify the central sulcus and other findings of brain injury were difficult to entirely conceal despite using selected images. However, given that the TCS and UCS are qualitative comparisons of cortical thickness across several adjacent gyri, small cutouts of just two or three gyri could not be used for testing.
Conclusions
In conclusion, our small study shows that the UCS can accurately identify DCI, especially in patients with HIE. The UCS can be subtle and easily overlooked, hence the reader must be vigilant for this finding. The accuracy of the UCS may depend on the extent of cortical injury and time from onset of injury. Also, the UCS may be reversible, as seen in our case of viral meningoencephalitis.
Disclosures
Andrew Leung, Apurva Patel, Basem Bahakeem, David Pelz, Donald Lee, and Manas Sharma declare that they have nothing to disclose.