


Introduction
Long waits for care in crowded emergency departments (ED) occur in the United States, Canada, Australia, the UK, and many other developed countries. Numerous studies have demonstrated adverse effects of ED crowding, both on processes of careReference Pines, Localio and Hollander 1 – Reference Pines and Hollander 4 and on important patient outcomes, including mortality.Reference Guttmann, Schull, Vermeulen and Stukel 5 – Reference Chalfin, Trzeciak and Likourezos 9 One policy approach, which has been undertaken in several countries and several Canadian provinces, is to establish benchmarks for maximum ED length of stay (LOS), commonly known as ED LOS benchmarks.Reference Pines, Hilton and Weber 10 , 11 Recently, the Canadian Association of Emergency Physicians released a position statement recommending national benchmarks for ED performance with respect to ED LOS.Reference Affleck, Parks and Drummond 12
ED LOS benchmarks encourage hospitals to focus on improving patient flow but are controversial. Several jurisdictions that have adopted them have seen substantial improvements in ED patients meeting targets.Reference Jones, Chalmers and Wells 13 – Reference Rudd 16 However, such initiatives may result in unintended adverse consequences by encouraging rushing of patient care or gaming of data.Reference Jones, Chalmers and Wells 13 , 17 The selection of ED LOS benchmark thresholds has been arbitrary rather than evidence-based, 18 and empiric data linking performance on benchmarks with patient outcomes has been lacking.
In April 2008, Ontario established and began publicly reporting provincial benchmarks for all EDs, specifically the maximum time that patients should spend in the ED from arrival to physical departure and the target percentage for compliance with the benchmark. Hospitals worked to achieve these targets,Reference Ovens 14 aided by Ministry-of-Health-funded initiatives, including a hospital pay-for-performance program, clinical observation units, and external quality improvement coaching advice.Reference Ovens 14 , Reference Salkeld, Leaver and Guttmann 19 The objective was to determine whether better performance with respect to Ontario’s ED LOS benchmarks was associated with improved patient outcomes. It was hypothesized that patients seen on shifts during which a lower proportion of patients meet Ontario ED LOS benchmarks are at higher risk of death or hospitalization within 7 days of ED discharge.
Methods
Setting and participants
A retrospective cohort study of ED visits was conducted over 4 years from April 1, 2008, to February 28, 2012, in Ontario (population, 12 million). All Ontario EDs use a validated five-level triage tool, the Canadian Triage and Acuity Scale (CTAS), with common training programs for triage nurses.Reference Bullard, Unger, Spence and Grafstein 20 Ontario’s ED LOS benchmarks are <4 hours for all non-admitted low-acuity patients (CTAS 4 or 5), and <8 hours for all high-acuity (CTAS 1, 2, or 3) or admitted patients. We excluded EDs with a mean annual patient volume below the 25th percentile (<13,647) because wait times are usually not prolonged at such sites, and they tend to have a different case mix and lower admission rates and acuity levels.Reference Guttmann, Schull, Vermeulen and Stukel 5 , Reference Bell, Willett and Oliver 21 The study population comprised patients who were seen by a physician and discharged from the ED. Patients who left without seeing a physician or left after seeing a physician either without treatment or against medical advice were excluded. When patients had more than one visit during the study period, the earliest visit was selected.
Study exposures
For each ED visit, the main exposure was calculated as the percentage of all similar patients registered in the same ED during the same shift who met their respective Ontario ED wait time benchmark. Similar patients were defined as those with the same triage score, grouped as high acuity (CTAS 1–3 [resuscitation, emergent, and urgent]) or low acuity (CTAS 4–5 [less urgent and nonurgent]). Patients for whom the ED LOS benchmark could not be calculated were excluded. The percentage of patients meeting the benchmarks on a given shift was calculated based on ED LOS and measured from the time of triage or registration (whichever came first) to the time that the patient left the ED or, if the latter was missing, to final patient disposition. Although the study population comprised discharged patients only, admitted patients were included in the calculation of the main exposure because they are known to substantially contribute to ED crowding. Those who left without being seen were excluded because their departure times are usually unknown. Shifts were defined in 8-hour increments starting at 0800, 1600, and 2400. The percentage of patients meeting ED LOS benchmarks was grouped as <80%, 80% to <90%, 90% to <95%, and 95%–100% (the reference group). These groups were chosen because they encompassed common thresholds set for ED LOS benchmarks of 80%,Reference Affleck, Parks and Drummond 12 90%,Reference Affleck, Parks and Drummond 12 , 22 and 95%Reference Woodcock, Poots and Bell 23 in several jurisdictions and allowed comparison effects at lower thresholds.
Main outcome measures
ED visit records were linked to outpatient and subsequent ED visits, hospital admissions, and death in the 7 days following the index ED visit. Adverse events were defined as death or a hospital admission within 7 days after leaving the ED. This time frame was chosen to ensure that subsequent events were related to the index ED visit. Unplanned returns within 7 days represent an important quality-of-care measure.Reference Plewes 24 More than 80% of adverse events following ED discharge occur within the first 10 days.Reference Forster, Rose, van Walraven and Stiell 25 As a sensitivity analysis, outcomes at 30 days following the index ED visit were also examined.
Data sources
Patient records were linked using unique, anonymized, encrypted identifiers across multiple Ontario population-based health administrative databases containing information on all publicly insured hospital and physician services. ED visits were identified through the National Ambulatory Care Reporting System. 26 – 28 Hospitalizations were identified through the Discharge Abstract Database. 29 Deaths were determined from an enhanced population-based registry of all legal residents in Ontario.Reference Iron, Zagorski, Sykora and Manuel 30 The Ontario Ministry of Health mandates submission of data on all ED visits and hospital separations in the province. 31 , 32 The anonymous and unique identifier can link across databases to identify all patient admissions and deaths, including those that occurred in settings outside of the index visit institution. Neighborhood income and community type were obtained from Statistics Canada 2006 census estimates. These datasets were linked using unique, encoded identifiers and analyzed at the Institute for Clinical Evaluative Sciences (ICES).
Statistical analyses
Conditional logistic regression models were used, conditioning on ED as a fixed effect, to analyse the association between the percentage of patients meeting the benchmark and adverse events.Reference Guttmann, Schull, Vermeulen and Stukel 5 This allowed for assessing the effects of increases or decreases in the percentage meeting benchmark during shifts within the same ED, while controlling for other factors.Reference Berlin, Kimmel, Ten Have and Sammel 33 All models included the percentage of patients meeting ED LOS benchmarks and used a patient visit as the unit of analysis, permitting the ability to control for individual risk factors and inferences to individual patient outcomes, even for exposures measured at the ED level. Models were controlled for patient age group (0–1, 1–9, 10–17, 18–39, 40–64, 65–74, 75+ years), sex, acuity, calendar month, fiscal year, weekend/holiday versus weekday, time of day (0801–1600, 1601–2400, 2401–0800), patient neighbourhood income quintile (including missing), patient neighbourhood community type (rural, urban, missing), hospital type (small, community, teaching), number of ED visits in the past year, and chief complaint. All analyses were stratified by CTAS category (1–3 [high acuity] and 4–5 [low acuity]). Patients with missing data on CTAS were excluded. A p-value less than or equal to 0.05 was deemed statistically significant, and all statistical tests were two sided. The patient’s own LOS was not included as a separate variable in the models as shift characteristics were investigated. It was included in the shift-level calculation of the percentage of patients meeting ED LOS benchmarks. All analyses were performed using SAS for UNIX, Version 9.2.1 (SAS Institute, Cary, NC). Conditional logistic models used the procedure PROC LOGISTIC with a STRATA statement and included fixed effects for each ED.
The Research Ethics Board of Sunnybrook Health Sciences Centre approved this study.
Results
There were 4,792,669 visits during the study period, of which 4,092,399 were among patients who were discharged; 157,403 visits were excluded to low volume EDs, including 10,951 visits where the ED LOS benchmark could not be calculated, leaving 3,924,045 visits at 122 EDs. Of these, 3,921,885 had a valid CTAS value; 58.5% were high acuity (CTAS 1, 2, or 3), and 41.5% were low acuity (CTAS 4 or 5).
In terms of ED level performance with respect to ED LOS benchmarks at the time that the patients were seen in the ED, 37.1% of patients were seen during shifts where fewer than 80% of patients met the benchmark, 28.0% during shifts where 80% to <90% met the benchmark, 13.4% during shifts where 90% to <95% met the benchmark, and 21.5% during shifts where 95% or more met the benchmark (Table 1). There was substantial variation among EDs in the overall proportion of patients who met the Ontario ED LOS benchmark during the study period (range of 7.9% to 87.5%). ED visits that occurred during shifts characterized by poor performance (i.e., where less than 80% of ED patients met the benchmark) were more likely to have been made by patients who were urban residents, older, had a higher acuity and lower income, and visits were more likely to have occurred at night and on weekdays, and more likely to have been at teaching or high-volume EDs.
Table 1 Patient and emergency department characteristics of study population. All data are presented in the form of number (and percent)

* Includes patients discharged after being seen by a physician
† Ontario’s benchmarks are <8 hours for all high-acuity (Canadian Triage and Acuity Scale 1, 2 or 3) or admitted patients, and <4 for all non-admitted low-acuity (Canadian Triage and Acuity Scale 4 or 5) patients.
Among high- and low-acuity patients, respectively, there were 1,429 (0.062%) and 220 (0.014%) deaths and 49,771 (2.2%) and 9,005 (0.55%) admissions within 7 days of ED discharge. Crude rates of death and admission were highest among patients attending the ED during shifts where fewer than 80% of patients met the ED LOS benchmark, regardless of acuity, and rates generally decreased as the percentage of patients meeting the benchmark increased (Table 2).
Table 2 Outcomes among study patientsFootnote * by patient acuity and shift level ED length-of-stay (ED-LOS) performance

* Includes patients discharged after being seen by a physician
† Ontario’s benchmarks are <4 hours for all non-admitted low acuity patients (Canadian Triage and Acuity Scale 4 or 5), and <8 hours for all high acuity (Canadian Triage and Acuity Scale 1, 2 or 3) or admitted patients.
In adjusted analyses, patients seen during a shift characterized by a worse ED LOS benchmark performance were at significantly increased odds of both death and hospital admission (Figure 1a and Figure 1b). The odds of admission increased steadily as the shift-level performance with respect to ED LOS benchmarks worsened. A similar trend was seen for deaths with the exception of high-acuity patients, where a nonsignificant increase was observed in mortality associated with shifts where 80% to <90% of patients met the benchmarks. Among high-acuity ED patients, the adjusted odds of death and hospitalization following discharge when seen during a poor performance shift (i.e., where <80% of patients meet benchmarks) were 1.32 (95% confidence interval [CI]: 1.05–1.67) and 1.13 (95% CI: 1.08–1.17), respectively, compared with being seen during a high performance shift (i.e., where 95%–100% of patients meet benchmarks). For low-acuity patients, being seen during a poor performance shift had an adjusted odds ratio of death and hospitalization of 1.84 (95% CI: 1.21–2.81) and 1.40 (95% CI: 1.31–1.49), respectively, compared with being seen during a high performance shift. In the sensitivity analysis examining 30-day outcomes, the adjusted odds ratios were very similar to those for the 7-day outcomes.

Figure 1a High acuity* patients’ emergency department patients’ adjusted odds ratios (95% confidence intervals) for death and hospitalization within 7 days of a visit among all non-admitted patients (seen-and-discharged and left-without-being-seen). *Canadian Triage and Acuity Scale levels 1 to 3. †adjusted for age group, sex, triage level, calendar month, time of day, day of week, income quintile, urban/rural community, number of ED visits in the previous year, main problem.
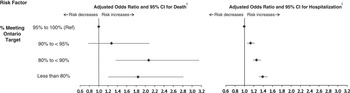
Figure 1b Low acuity* emergency department patients’ adjusted odds ratios (95% confidence intervals) for death and hospitalization within 7 days of a visit among all non-admitted patients (seen-and-discharged and left-without-being-seen). * Canadian Triage and Acuity Scale levels 4 to 5. †adjusted for age group, sex, triage level, calendar month, time of day, day of week, income quintile, urban/rural community, number of ED visits in the previous year, main problem.
Discussion
Prior studies have found adverse consequences associated with ED crowding, including treatment delays,Reference Pines, Localio and Hollander 1 – Reference Pines and Hollander 4 hospitalization,Reference Guttmann, Schull, Vermeulen and Stukel 5 and mortality.Reference Guttmann, Schull, Vermeulen and Stukel 5 – Reference Chalfin, Trzeciak and Likourezos 9 The recent relaxation of ED LOS benchmarks from 98% to 95% in the UK has resulted in substantially more patients waiting longer than 4 hours, and it has been suggested that this is likely to result in poorer patient outcomes.Reference Woodcock, Poots and Bell 23 The implementation of ED LOS benchmarks and targets is based on the theory that reducing ED LOS enough to achieve a given benchmark for a sufficient proportion of patients will result in meaningful reductions in risk to patients, yet to date there has been no empiric evidence supporting any specific benchmarks. The results of this study suggest that not only are Ontario’s ED LOS benchmarks an appropriate metric for quality improvement, but also that performance on a given shift is important. The results also demonstrate substantial additional room for improvement in performance, considering approximately 56% of patient visits occurred during shifts where <90% of similar patients were meeting Ontario’s benchmarks. In addition, the data suggest that achieving higher performance targets confers additional benefit. Ontario’s target for compliance with its benchmarks is ≥90%, yet even greater benefits were observed for patients when ≥95% compliance with benchmarks was achieved.
Poor performance on ED LOS benchmarks may result in adverse consequences for patients through a number of potential mechanisms. Prolonged ED LOS can lead to delays in diagnosis and/or treatment for specific conditions, such as timely administration of antibiotics for pneumoniaReference Pines, Localio and Hollander 1 , Reference Pines, Hollander, Localio and Metlay 34 and febrile neonates,Reference Kennebeck, Timm and Kurowski 35 reperfusion for acute myocardial infarction patients,Reference Schull, Vermeulen and Slaughter 2 , Reference Pines, Hollander, Localio and Metlay 34 orders and completion of computed tomography scans for stroke,Reference Chatterjee, Cucchiara and Lazarciuc 36 medication orders for asthma,Reference Pines, Prabhu and Hilton 37 and administration of analgesics for hip fracture and other painful conditions.Reference Hwang, Richardson, Sonuyi and Morrison 3 , Reference Pines and Hollander 4 , Reference Hwang, Richardson and Livote 38 , Reference Mills, Shofer and Chen 39 Crowding in the ED may also affect disposition decisions and has been associated with a lower likelihood of hospital admission in a study of pediatric ED patients with asthma or gastroenteritis.Reference Michelson, Monuteaux, Stack and Bachur 40 The current study adds to this prior work by demonstrating an association with serious adverse events when ED crowding is expressed as shift-level performance on Ontario’s ED LOS benchmarks. Furthermore, this study’s sensitivity analysis demonstrates persistence of the increased risk to 30 days post-ED discharge.
The selection of benchmarks and performance targets has been driven by a combination of expert opinion, local clinical practice, and political acceptability, all in the absence of evidence to guide decisions. Internationally, several jurisdictions, such as England,Reference Alberti 15 Australia,Reference Rudd 16 Ireland, 41 New Zealand,Reference Jones, Chalmers and Wells 13 and several Canadian provinces, 22 , Reference Cryderman 42 have enacted ED LOS benchmarks and targets, implemented with varying combinations of incentives and/or sanctions. Benchmarks vary widely, for example, in England (up until 2011)Reference Alberti 15 and Australia,Reference Rudd 16 the wait time benchmark has been <4 hours for ED patients, whereas Canadian provinces generally have different benchmarks for high-acuity patients (ranging from 4–12 hours) and low-acuity patients (ranging from 2–4 hours). 43 Jurisdictions also vary in the performance target that they set for achieving their time benchmarks, varying from 75%–98%.Reference Alberti 15 , Reference Rudd 16 , 43 In the United States, some observers have suggested a similar approach,Reference Rabin, Kocher and McClelland 44 but the Centers for Medicare and Medicaid Services asks only hospitals to report ED LOS, whereas the Joint Commission has issued a hospital-wide patient flow standard without any benchmarks. 45
Limitations
There are several limitations to this study. Administrative databases are subject to inaccuracies, but this work is focused on highly reliable data elements. 26 Although there are some inaccuracies in the numbers of deaths among very young children, deaths are generally well captured among adults in Ontario in the linked databases used.Reference Iron, Zagorski, Sykora and Manuel 30 Crowding in 8-hour shifts was measured, which may have created bias if a patient arrived at the beginning or end of a shift. It was not feasible to examine crowding at more specific times due to ED-shift level sample size considerations. Performance ranges chosen reflected commonly used thresholds for ED LOS targets; however, these groupings may have missed important relationships at more specific performance levels. Although important clinical predictors were controlled, such as age, sex, triage acuity level, and chief complaint, residual confounding may exist. It is believed that it is unlikely that patient level confounders would be associated with wait time performance for other patients present in the ED on the same shift. An additional protection against residual confounding was that the analysis conditioned on the ED, thus reducing the likelihood of unmeasured confounding caused by social determinants of health. The population of ED patients is unlikely to vary substantially between crowded and less crowded shifts within the same ED. This analytic approach helped control for potential hospital confounders, such as availability of hospital resources and physician skill. Although it is possible that the physicians most likely to make optimum patient care decisions are also the ones most able to speed patient flow and hence better achieve ED LOS benchmarks, this is an unlikely alternative explanation for the results in this study, given the frequent clinician concern that excess attention to achieving wait time benchmarks might compromise patient care. 17 , Reference Gubb 46 The results of this work may not be generalizable to other health care systems; however, the problem of ED crowding and the organization of care within Ontario EDs are similar to many developed countries.
Conclusion
The aphorism “you can’t manage what you don’t measure” is often applied to quality improvement efforts in health care. Better management of EDs likely requires the routine measurement of ED LOS and wait times, but the experience of jurisdictions that have improved performance suggests that setting benchmarks and performance targets for ED wait times is also important to help galvanize improvement efforts.Reference Rabin, Kocher and McClelland 44 Results here suggest that better performance on ED wait time benchmarks is associated with substantial improvements in patient outcomes and supports current recommendations from the Canadian Association of Emergency Physicians.Reference Affleck, Parks and Drummond 12 This is an important consideration for policymakers in other jurisdictions and health systems who are aiming to reduce ED crowding and improve patient outcomes.
Acknowledgments: The study was funded by the Canadian Institutes for Health Research. This study was supported by the Institute for Clinical Evaluative Sciences, a non-profit research institute funded by the Ontario Ministry of Health and Long-Term Care. The opinions, results and conclusions reported in this paper are those of the authors and are independent from the funding sources. No endorsement by Institute for Clinical Evaluative Sciences or the Ontario Ministry of Health and Long-Term Care is intended or should be inferred.
Competing interests: None declared.


