


Introduction
Vertical stratification in the forest is evident in local distributions of a variety of organisms, including lichens and bryophytes (McCune et al. Reference McCune, Rosentreter, Ponzetti and Shaw2000), birds (Pearson Reference Pearson1971; Walther Reference Walther2002), bats (Bernard Reference Bernard2001), and arthropods (Basset et al. Reference Basset, Hammond, Barrios, Holloway and Miller2003) such as butterflies (DeVries et al. Reference DeVries, Murray and Lande1997), moths (Schulze and Fiedler Reference Schulze and Fiedler2003), and spiders (Enders Reference Enders1974; Sørensen Reference Sørensen2003). Changes in resource availability and in structural and environmental features and along the vertical gradient seem to explain why some species are found mainly in different forest layers (Smith Reference Smith1973; Koop and Sterck Reference Koop and Sterck1994; Shanahan and Compton Reference Shanahan and Compton2001; Schaefer et al. Reference Schaefer, Schmidt and Wesenberg2002; Madigosky Reference Madigosky2004; Shaw Reference Shaw2004).
Conifer-dominated stands are the last sere in boreal forest succession (Chen and Popadiouk Reference Chen and Popadiouk2002) and are key landscape features for so-called “old-growth specialist” species (Schoonmaker and McKee Reference Schoonmaker and McKee1988; Esseen et al. Reference Esseen, Ehnstrom, Ericson and Sjoberg1997; Farjon and Page Reference Farjon and Page1999; Juutinen Reference Juutinen2008). Given the large changes in forest structure from the ground level to the upper overstorey, these forests are structurally diverse and complex; therefore, it is reasonable to expect variation in arthropod species composition along the vertical gradient. However, most boreal arthropod biodiversity studies have focused on ground-dwelling assemblages, and there is a deficiency of information about diversity, species composition, and distribution in the higher strata of this dominant Canadian forest type.
This study focuses on spiders (Araneae), a common and diverse group of invertebrates in the boreal forest (Buddle and Draney Reference Buddle and Draney2004; Work et al. Reference Work, Shorthouse, Spence, Volney and Langor2004). Most species are generalist predators, and assemblage composition in the forest is believed to be linked more strongly to habitat structure and overall prey availability than to specific microhabitat features that may affect distribution of specific prey items (Turnbull Reference Turnbull1973; Greenstone Reference Greenstone1984; Gunnarsson Reference Gunnarsson1990; Uetz Reference Uetz1991; Halaj et al. Reference Halaj, Ross and Moldenke2000). Spiders living in different forest strata are important sources of food for other organisms such as birds (Gunnarsson Reference Gunnarsson2007). In addition, spiders are easily sampled and taxonomically well known in Canada (Paquin et al. Reference Paquin, Buckle, Dupérré and Dondale2010). All of these characteristics make spiders an ideal group for studying patterns of vertical stratification in forests.
There is evidence of vertical stratification of spider assemblages at smaller scales in the forest litter (Huhta Reference Huhta1971; Wagner et al. Reference Wagner, Toft and Wise2003) or in other relatively homogeneous systems (Enders Reference Enders1974; Castilho et al. Reference Castilho, Marques, Adis and Brescovit2005; Pekár Reference Pekár2005), and at larger scales in tropical forests (Sørensen Reference Sørensen2003), temperate deciduous forests (Elliott Reference Elliott1930; Turnbull Reference Turnbull1960; Larrivée and Buddle Reference Larrivée and Buddle2009; Aikens and Buddle Reference Aikens and Buddle2012), conifer forests (Simon Reference Simon1993; Docherty and Leather Reference Docherty and Leather1997), and in mixedwood boreal forests (Pinzon et al. Reference Pinzon, Spence and Langor2011). However, most of these studies describe vertical stratification at a gross level, that is, ground versus understorey and/or overstorey and the authors did not document the extent of vertical variation within overstorey assemblages (but see Aikens and Buddle Reference Aikens and Buddle2012).
Studies of arboreal spider assemblages (and other arthropods) in North America and northern Europe have provided initial assessments of species composition in coniferous overstoreys, and have shown that these assemblages are mostly dominated by weaving species (Jennings and Dimond Reference Jennings and Dimond1988; Halaj et al. Reference Halaj, Ross, Mason, Torgersen and Moldenke1996). Other studies have documented large seasonal dynamics in assemblages due to the variability in reproductive cycles, sex ratios, and life-history patterns (Jennings and Collins Reference Jennings and Collins1987b; Jennings and Dimond Reference Jennings and Dimond1988; Schowalter et al. Reference Schowalter, Stafford and Slagle1988; Schowalter and Ganio Reference Schowalter and Ganio1998). Most studies have concluded that arboreal spider composition is largely influenced by tree species, stand composition and age, tree density, and prey availability, suggesting positive relationships between habitat structure and spider abundance, richness, and diversity (Stratton et al. Reference Stratton, Uetz and Dillery1979; Jennings and Collins Reference Jennings and Collins1987a; Gunnarsson Reference Gunnarsson1988; Mason Reference Mason1992; Schowalter Reference Schowalter1995; Pettersson Reference Pettersson1996; Halaj et al. Reference Halaj, Ross and Moldenke1998; Gunnarsson et al. Reference Gunnarsson, Hake and Hultengren2004; Horvath et al. Reference Horvath, Lengyel, Szinetar and Jakab2005; Schowalter and Zhang Reference Schowalter and Zhang2005). In addition to demonstrating that conifer overstorey is a three-dimensional complex system, these studies also stress that higher strata are part of an even larger realm and that other layers of the forest also influence overstorey faunal characteristics. Given the central role of conifer stands for maintaining old-growth species, full understanding of diversity patterns in these systems provides essential support for sustainable forest management decisions that effectively meet the criteria for biodiversity conservation.
The main objective of this study is to describe how spider composition and diversity change across a vertical gradient from the forest floor to the mid-overstorey of white spruce trees (Picea glauca (Moench) Voss (Pinaceae)) in conifer-dominated stands in the boreal forest of Alberta, Canada. Species richness, diversity, and species turnover among different heights are evaluated in this study, and the expected richness and abundance according to structural features within the mid-overstorey are modelled.
Material and methods
Study area and data collection
Spiders assemblages were studied on the EMEND (Ecological Management by Emulating Natural Disturbances) project landbase, located in the boreal mixedwood forest of northwestern Alberta, Canada (56°46′N, 118°22′W). Trembling aspen (Populus tremuloides Michaux (Salicaceae)), balsam poplar (Populus balsamifera Linnaeus (Salicaceae)), and white spruce are the dominant tree species in the area. This study focused on three unharvested white spruce dominated patches, each ∼10 ha in area (minimum distance between patches: 2 km). Samples were collected from the mid-overstorey, understorey (shrub), and ground layers within each patch as described below. Collections were carried out from 4 to 23 June 2008. Several studies have shown that spider activity tends to increase during the early season (Huhta Reference Huhta1965; Huhta Reference Huhta1971; Jennings et al. Reference Jennings, Houseweart, Dondale and Redner1988; Niemelä et al. Reference Niemelä, Pajunen, Haila, Punttila and Halme1994) supporting the choice to limit focal time to this period.
Mid-overstorey sampling
Three white spruce trees were selected in two patches and two trees were selected in the third patch. Thus we sampled a total of eight trees with similar gross characteristics such as, diameter at breast height (DBH: 30.9 ± 2.05 cm), height (20.7 ± 0.83 m), crown height (17.6 ± 0.92 m), and average canopy cover (from four measures using a convex densiometer) in the vicinity of the sampled tree (87.5% ± 1.23). Trees within each patch were at least 40 m from the forest edge and no less than 15 m between each other. Aluminum sectional ladders were used to gain access to higher portions of each selected tree. Samples from the mid-overstorey (OS) were collected from tree branches up to 12 m above ground level, which corresponded to approximately the bottom half of the overstorey layer.
A cordless circular saw was used to cut branches that were then dropped, one by one, to the ground onto a 6 m × 4.5 m plastic tarp. Spiders were collected by thoroughly searching each individual branch. Height above ground, branch base diameter, length, width, and number of dead and living sub-branches were recorded for each branch.
Shrub sampling
The shrub layer beneath white spruce trees in the study area is dominated by prickly rose (Rosa acicularis Lindley (Rosaceae)), low-bush cranberry (Viburnum edule (Michaux) Rafinesque (Caprifoliaceae)), buffaloberry (Shepherdia canadensis (Linnaeus) Nuttall (Elaeagnaceae)), labrador tea (Ledum groenlandicum Oeder (Ericaceae)), alder (Alnus Hill spp. (Betulaceae)), and aspen/white spruce saplings. Shrub (SH) samples were collected with a 5.0 m radius of each sampled white spruce tree by beating vegetation up to 1.5 m above the ground over a 1 × 1 m canvas sheet. Mid-overstorey samples were collected after SH samples to minimise disturbance to the plots that might affect the results. SH samples were pooled by shrub species and number of individual shrubs of each species, including aspen and white spruce saplings, was recorded for each plot.
Ground sampling
To avoid ground disturbance caused by sampling shrubs and the overstorey, ground (GR) samples were collected near the bases of trees >5 m distant from sample trees using three pitfall traps deployed continuously during the sampling period. Traps were plastic containers (11 cm diameter) positioned in the ground so that the rim was leveled with the surface (Spence and Niemelä Reference Spence and Niemelä1994); traps were separated from each other by ∼3 m. Low-toxicity silicate-free ethylene glycol was used as preservative, and a square plastic roof (15 × 15 cm) was suspended above the trap on metal spikes to prevent rain and debris falling into the trap.
Spiders were sorted in the field to family level, and all adults were identified to species in the laboratory using relevant literature. Nomenclature followed the World Spider Catalog (Platnick Reference Platnick2012). Voucher specimens were deposited in the spider reference collection of the Invertebrate Ecology Laboratory and the E. H. Strickland Entomology Museum (Departments of Renewable Resources and Biological Sciences, respectively) at the University of Alberta, Edmonton, Alberta, Canada.
Data analyses
Samples were assigned to 12 forest strata (H0–H11) based on the height from the ground up to 12 m high. Spiders were pooled by stratum for analyses. Thus, H0 corresponds to the ground level (samples collected using pitfall traps), H1 to the shrub layer (0.50–1.49 m; samples collected by beating), and H2–H11 to the mid-overstorey layer (samples collected from tree branches; H2: 1.50–2.99 m; H3: 3.00–3.99 m; H4: 4.0–4.99 m; H5: 5.00–5.99 m; H6: 6.00–6.99 m; H7: 7.00–7.99 m; H8: 8.00–8.99 m; H9: 9.00–9.99 m; H10: 10.00–10.99 m; H11: 11.00–12.00 m). As information regarding vertical stratification is scarce, especially for spider assemblages, the above strata designation was arbitrary (i.e., 1 m intervals) in order to capture any fine scale patterns.
Given the disparity among techniques used to sample the major forest layers (ground, shrub, and mid-overstorey), a Permutational Analysis of Variance (Anderson Reference Anderson2001) was performed in PERMANOVA (Anderson Reference Anderson2005) using Bray–Curtis distance measure and 4999 permutations on presence/absence data to test the null hypothesis of no difference in species composition (α = 0.05) among the three main strata. This analysis provides evidence that observations among strata are not a result of a sampling effect but in fact result from habitat effects. In addition, to reveal changes in species composition within the 12 height classes described above, a presence/absence dissimilarity dendrogram based on the Jaccard distance measure was constructed using the average-linkage method. This analysis was performed in R (R Development Core Team 2012) using the Cluster package (Maechler et al. Reference Maechler, Rousseeuw, Struyf, Hubert and Hornik2012).
Diversity quantification
Species richness among strata was compared by (i) means of individual-based rarefaction (to deal with sampling disparities) by drawing random sub-samples from the larger sample and then estimating the number of species that would have been collected given the smaller sample (Magurran Reference Magurran2004), and (ii) using the α parameter of Fisher's logarithmic series model (Fisher et al. Reference Fisher, Corbet and Williams1943). This parameter can be used to measure species richness, even if the log-series model is not a good fit to the data (for discussion see Hayek and Buzas [Reference Hayek and Buzas1997] and Kempton and Taylor [Reference Kempton and Taylor1974, Reference Kempton and Taylor1976]). Rarefied species richness and Fisher's α were calculated for each stratum by tree and averaged over all trees (n = 8). In addition, estimated species richness for each height class was calculated using Chao's incidence-based measure (Chao Reference Chao1987). Levin's standardised measure of niche breadth (BA) was calculated across strata for species with more than 10 individuals. BA measures the uniformity of distribution of individuals among strata; values range from 0 (all individuals occur in one stratum) to 1.0 (individuals are distributed evenly across the vertical gradient) (Krebs Reference Krebs1999).
Species turnover was quantified by computing pair-wise comparisons of Whitaker's beta-diversity (βw) measure (Whittaker Reference Whittaker1960; Magurran Reference Magurran2004) both between (vertical turnover) and within (horizontal turnover) strata. In addition, to establish sources of variation in species composition that reflect observed values of βw, pair-wise comparisons among strata of a, b, and c association coefficients (Krebs Reference Krebs1999) were calculated; with a representing the number of shared species between focal and compared strata, b representing the number of unique species in the compared height class (i.e., “gains”), and c representing the number of unique species in the focal strata (i.e., “losses”). As suggested by Koleff et al. (Reference Koleff, Gaston and Lennon2003) these computations were carried out in terms of relative number of species where a′, b′, and c′ must sum to one for each pair-wise comparison and illustrated as ternary (i.e., simplex) plots. The above analyses were carried out in R (R Development Core Team 2012) using the Vegan package (Oksanen et al. Reference Oksanen, Blanchet, Kindt, Legendre, Minchin and O'Hara2012).
Abundance and richness patterns in the mid-overstorey
Overall spider abundance and richness (response variables) in OS samples were modelled in terms of branch height, width, length, basal area, and total number of dead and/or living sub-branches (explanatory variables). A linear model is inappropriate for the data available (species and individual counts), thus a Poisson (log-link) generalised linear mixed model (GLMM), with Tree as a random variable was used. However, Poisson regression assumes no overdispersion (mean equals variance) and our data were highly overdispersed. Although use of a Negative Binomial accounts for overdispersion, it is difficult to implement in a generalised mixed model (Bolker et al. Reference Bolker, Brooks, Clark, Geange, Poulsen and Stevens2009). Because we assumed that repeated measures from the same tree are correlated, the assumption of independence is probably not valid and applying any of the previous models would increase the chance of Type I error, especially if within-tree correlation is strong, as we believe it is. As a consequence, to model spider richness and abundance, we used a generalised estimating equation (Liang and Zeger Reference Liang and Zeger1986) approach based on the autoregressive correlation structure AR-1. This type of correlation considers a gradient between observations within trees, implying that two branches close together are more correlated than are branches farther apart. Analyses were carried out in R (R Development Core Team 2012) with the Geepack package (Højsgaard et al. Reference Højsgaard, Halekoh and Yan2012).
Results
In total, 3070 adult spiders in 15 families and 76 species were collected from the various forest strata considered (Table 1, Supplementary Appendix A). On average (±SD), 25.2 ± 6.12 species were collected per forest stratum, with the largest species richness (40) observed in the ground layer (H0), followed by the mid-overstorey (H3–H12; 36 species) and the shrub layer (H1; 33 species). A significant difference in species composition was detected among the three major layers (F2,21 = 15.99, P < 0.001) with all pair-wise comparisons also highly significant (t GR−SH = 4.07, P < 0.001; t GR−OS = 4.01, P < 0.001; t SH−OS = 3.44, P < 0.001).
Table 1 Observed and estimated species richness and abundance of spiders collected from various forest strata (H0–H11) in white spruce mid-overstorey in a conifer-dominated boreal forest of Canada.
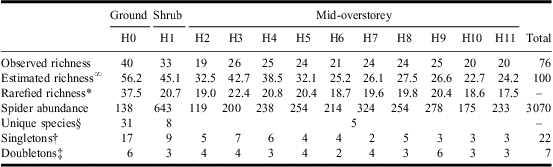
∞Chao's (Reference Chao1987) incidence-based species richness estimation.
*Individual-based rarefied species richness on a sample size of 119 individuals (minimum spider abundance).
§Species collected uniquely from a forest layer. Unique number of species provided for the overall mid-overstorey layer.
†Number of species represented by one individual.
‡Number of species represented by two individuals.
Ground layer
Only three species, Xysticus canadensis Gertsch (Araneae: Thomisidae), Zornella armata (Banks) (Araneae: Linyphiidae), and Walckenaeria communis (Emerton) (Araneae: Linyphiidae) were represented by more than 10 individuals in the ground layer (H0) and these accounted for >35% of the total spider abundance in this stratum. The remaining 37 species were mainly singletons and doubletons, with most grouped in the Sheet/Tangle (Linyphiidae) and ground-dwelling (Lycosidae, Gnaphosidae, Liocranidae) functional guilds (Table 1, Supplementary Appendix A).
Shrub layer
The highest abundance of spiders was observed from prickly rose (R. acicularis), low-bush cranberry (V. edule), buffaloberry (S. canadensis), and aspen saplings (P. tremuloides) (Table 2). Within the shrub layer, 13 spider species accounted for 90% of the overall abundance (fewer than 10 individuals each were collected for the remaining 20 species; Supplementary Appendix A). The shrub layer was dominated by space weavers (Theridiidae, Dictynidae), sheet/tangle weavers (Linyphiidae), and orb weavers (Araneidae, Tetragnathidae, Uloboridae), together accounting for 27 species and more than 80% of the total abundance (Table 1, Supplementary Appendix A).
Table 2 Number of individual SH and S and S:SH from eight 5-m-radius plots in a white spruce-dominated boreal forest.

SH, shrubs; S, spiders; S:SH, spider–shrub ratio.
Mid-overstorey layer
A total of 137 branches were sampled from the eight trees (mean number of branches/tree ± SD: 17.1 ± 5.49; mean number of branches/stratum/tree ± SD: 1.7 ± 0.74). Branch height varied from 1.97 to 12.00 m from the ground level, branch length varied from 1.15 to 3.78 m, and branch width varied from 0.70 to 3.01 m. Within the mid-overstorey layer, 21 spider species were represented by >10 individuals with seven species accounting for >75% of the individuals and including a wide range of feeding guilds and families (Supplementary Appendix A).
Spiders were abundant on branches (16.7 ± 11.20 per branch) but their abundance varied markedly among branches. Higher branches (Spearman's ρ = −0.44, n = 137, P < 0.0001) and smaller branches (based on branch area calculated as a triangle using width and length; Spearman's ρ = 0.36, n = 137, P < 0.0001) contained fewer spiders. Only Cyclosa conica (Pallas) (Araneae: Araneidae) and a few less abundant species, including Emblyna annulipes (Blackwall) and Emblyna phylax (Gertsch and Ivie) (Araneae: Dictynidae), showed obvious patterns of abundance, with all species peaking in lower overstorey classes.
Species composition in the mid-overstorey was significantly explained by branch height and branch size (based on branch base diameter, branch length, and branch width) after constrained ordination using redundancy analysis (RDA) (P = 0.005, 78.8% of variance explained; Fig. 1A). Other branch structural variables (dead and living sub-branches) were removed from the full model as these were nonsignificant. The first two axes (RDA1 and RDA2) explained 35.6% and 22.1% of the total variance, respectively. An inverse relationship between height and branch size is explained mostly by the first axis, whereas branch base diameter and a portion of branch size explain the variation in the second axis. Overall, species composition consistently groups together within height classes in three main groups (H2–H6, H7–H9, and H10–H11) based on the 95% confidence intervals (CIs) of the height class centroids (Fig. 1B).

Fig. 1 Redundancy Analysis (RDA) of spider assemblages in the mid-overstorey (up to 12 m from the ground) in white spruce (RDA1: λ = 0.365; RDA2: λ = 0.226; using Hellinger transformed abundances [Legendre and Gallagher Reference Legendre and Gallagher2001]). (A) Relationship of spider species composition to height from the ground and branch structural features (Base: branch base diameter; Length: branch length), excluding form the model nonsignificant variables (number of dead and living sub-branches). (B) Depicts the same ordination showing 95% confidence intervals (CIs) for height class centroids (H2–H11). Stratum designation is explained in the “Methods” section.
Abundance and richness patterns within the mid-overstorey
During model selection, all explanatory variables (branch height, length, width, base diameter, and number of dead and live sub-branches) were tested first for co-linearity by calculating a generalised variance-inflation factor (GVIF). As a rule of thumb, a GVIF larger than 4.0 indicates that coefficient CIs for co-linear variables are twice as wide as for uncorrelated explanatory variables (Fox Reference Fox2002). GVIF values for all variables above were below 1.7, suggesting little or no co-linearity. Next, a model including all variables and the two-way interactions of “height × length”, “height × width”, and “height × base” was tested for significant terms. These interaction terms were included in the model based on the weak but significant correlation especially between height and the two former variables (Spearman's ρ [n = 137] for length: −0.27, P = 0.0014; for width: −0.23, P = 0.0070).
Only the coefficient for branch width was significantly different from zero (α = 0.05) in the full model (Table 3). Most of the other variables were not significant (results not shown) after a Wald statistic analysis (similar to a deviance analysis); however, some variables that were not significant in analysis of the full model were significant or marginally significant according to the Wald statistic. Thus, to select the best model, the least significant parameter in the full model was dropped and the model was refit. This procedure was repeated until all terms in the final model were significant, resulting in the selection of branch height and branch width as the best explanatory variables for both richness and abundance, thus the final model is:
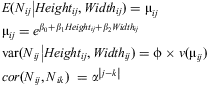 $$\matrix{<!l}> E({{N}_{ij}}\left| {Heigh{{t}_{ij}},Widt{{h}_{ij}}} \right.)\: = \:{{{\rm{\rmu }}}_{ij}}\hfill \\ {{{\rm{\rmu }}}_{ij}}\: = \:{{e}^{{{{\rm{\beta }}}_0}\: + \:{{{\rm{\beta }}}_1}Heigh{{t}_{ij}}\: + \:{{{\rm{\beta }}}_2}Widt{{h}_{ij}}}}\hfill<! \\ > \cr{\rm var}({{N}_{ij}}\left| {Heigh{{t}_{ij}},Widt{{h}_{ij}}} \right.) =\rvarphi \times v({{{\rm{\rmu }}}_{ij}})\hfill \\ cor({{N}_{ij}},{{N}_{ik}})\:\ = \:{{{\rm{\alpha }}}^{\left| {j{\rm{ - }}k} \right|}}\hfill \\ <!\end{array}>}$$
where Nij is either the number of species or the number of individuals for branch j at tree i with mean μij and variance with a scale parameter (overdispersion) φ. Association between Nij and Nik, where j and k are two different branches in the same tree i, is given by the correlation structure α|j−k|; hence, the correlation between branch 1 and branch 2 in the same tree is α, between branch 1 and branch 3 is α2, between branch 1 and branch 4 is α3, etc. Table 4 summarises the parameters of the two reduced models.
Table 3 Full model from GEE for spider species richness (A) and abundance (B) in white spruce mid-overstorey in a conifer-dominated boreal forest of Canada.

GEE, Generalised Estimating Equations.
Table 4 Reduced model from GEE for species richness and spider abundance in white spruce mid-overstorey in a conifer-dominated boreal forest of Canada.

GEE, Generalised Estimating Equations.
Both species richness and abundance decreased significantly with increased branch height, and increased in wider branches (Table 4). As expected, the correlation between the observations of two contiguous branches in the same tree was relatively high for species richness and spider abundance (0.450 and 0.646, respectively) supporting the choice of the autoregressive correlation structure in the model building. The effect of branch width was stronger than the effect of branch height, as revealed by the magnitude of the coefficients in the model, suggesting that branch width, a measure of amount of local habitat, is relatively more important than branch height for modelling either species richness or abundance.
Vertical stratification
Mean species richness per tree declined from lower to higher forest strata, peaking in the shrub layer (H1; Fig. 2). For statistical analysis of diversity, however, rarefaction and Fisher's α values are more appropriate. Because no differences among forest strata are observed after inspecting the CIs for both rarefaction and Fisher's α, a similar mean number of species per unit of sampling effort is expected in each stratum (Fig. 2). However, the estimated number of species based on Chao's measure clearly suggests a decreasing pattern as height increases, especially in the lower layers (Table 1).

Fig. 2 Observed and estimated (individual-based rarefaction, Fisher's α) spider species richness at different strata in a white spruce-dominated boreal forest. Stratum designation is explained in the “Methods” section.
Most spider species were characterised by a wide habitat niche breadth across the vertical gradient (H0–H11) with no specialisation observed in relation to a specific forest stratum (Table 5 and as above); however, three species were concentrated in the ground layer (H0: W. communis, Z. armata, X. canadensis), six species were mainly in the shrub layer (H1: Araniella displicata (Hentz) (Araneae: Araneidae), E. annulipes, Estrandia grandaeva (Keyserling) (Araneae: Linyphiidae), Neriene radiata (Walckenaer) (Araneae: Linyphiidae), Philodromus cespitum (Walckenaer) (Araneae: Philodromidae), Canalidion montanum (Emerton) (Araneae: Theridiidae)), and one was disproportionately abundant in lower branches of the mid-overstorey (H4–H5: E. phylax).
Table 5 Species niche breadth (BA: Levin's measure) for common spider species within a vertical gradient in white spruce forests.

H0, ground stratum; H1, shrub stratum; H4–H5, 2nd and 3rd overstorey strata.
Notes: Species on the left column are those with narrow niche breadth (BA<0.5) and superscript corresponds to forest stratum specialisation (strata designation is explained in the “Methods” section); species on the right column are those with wide niche breadth (BA >0.5).
The dissimilarity dendrogram (Fig. 3) shows a marked vertical pattern in composition of the spider assemblage across height classes from the ground up to 12 m in the canopy. As expected, there was high similarity in species presence/absence between neighbouring height classes. However, the ground layer (H0) was most dissimilar to all higher layers suggesting a highly distinctive species composition. The shrub layer (H1) also appears to be quite distinct. All other height classes (H2–H11) are grouped together in a single large cluster, but smaller clusters are evident (similar to those in Fig. 1B), suggesting some minor vertical stratification of assemblages within the mid-overstorey.

Fig. 3 Dissimilarity dendrogram (average-linkage cluster, Jaccard distance, based on presence/absence data) showing relationships among spider assemblages in various strata of white spruce-dominated boreal stands. Stratum designation is explained in the “Methods” section.
The ground and shrub layers shared a low proportion of species (a′) with the mid-overstorey (Fig. 4A), and high proportion of species (c′) was exclusive to these layers, especially for H0. In contrast, all mid-overstorey strata (H3–H11) shared a high proportion of species. A similar pattern is observed for each tree within the three stands (Figs. 4B–4D). The relation between “gains” (b′) and “losses” (c′) in the ground layer was more variable, differences between the shrub and mid-overstorey layers were less marked and the proportion of shared species within the mid-overstorey was lower. Mean species turnover between the three main strata (i.e., ground, shrub, and mid-overstorey), measured by all pair-wise βw measures between trees, showed a clear difference in species composition among layers (βw GR−SH = 0.91 ± 0.020 SE; βw GR−OS = 0.87 ± 0.024 SE; βw SH−OS = 0.39 ± 0.033 SE). Consequently, beta-diversity is considerably higher as one passes from the ground and shrub layers to higher levels of the forest, whereas it is more consistent across strata within the mid-overstorey (Fig. 5A). Interestingly, a scale effect on beta-diversity is observed as βw is constantly larger within trees and stands compared to all stands combined (overall) (Fig. 5A). Species turnover among strata between trees and stands is consistently low for both shrub and mid-overstorey layers and relatively high for the ground layer (Fig. 5B), suggesting high variability and patchiness in species composition in ground-dwelling assemblages in contrast to the relatively more homogeneous species assemblages in higher layers.

Fig. 4 Ternary plots in a′, b′, and c′ space for spiders collected at different heights in white spruce stands. These plots show the difference in species composition, and thus are a measure of species turnover, among all pair-wise comparisons between forest layers (H0–H12), as the proportion of species (i) shared between focal and compared strata (a′), (ii) unique to focal strata (c′), and (iii) unique to compared strata (b′). (A) Overall assemblage by pooling individuals collected in all trees within all stands. Panels (B), (C), and (D) are each of the stands. Grey and black points correspond to ground layer (H0) and shrub layer (H1) compared with all higher strata, respectively. Empty points correspond to comparisons between each of the mid-overstorey strata (H2–H11). In panels (B), (C), and (D) triangles, squares, and circles correspond to individual trees within each stand.

Fig. 5 Mean Whittaker's Beta-diversity (βw) of spiders collected from different forest strata in white spruce. (A) Vertical βw between strata within trees (black circles), stands (empty circles), and overall (grey triangles); points correspond to the mean value of all pair-wise comparisons between focal stratum and all strata. (B) Horizontal βw among strata between trees (black circles) and stands (empty circles).
Discussion
To our knowledge, this is the first study focused specifically on understanding spider diversity across a vertical gradient in conifer stands of the North American boreal forest. A strong pattern of assemblage change was observed among the three main layers of the forest (ground, shrub, and mid-overstorey strata), but there was also a subtle pattern of change across strata (H2–H11) in the mid-overstorey layer, explained mainly by the inverse relationship of species richness and abundance with height and branch size. A pattern also observed in the canopy of sugar maple (Acer saccharum Marshall (Sapindaceae)) forests in eastern Canada, where the density and richness of spiders decreased with height (Aikens and Buddle Reference Aikens and Buddle2012). Even though local diversity was considerably higher in the ground layer and lower but relatively similar among higher strata, species turnover is clearly observed along the vertical gradient. Thus, each major layer of the forest harbours a somewhat unique spider assemblage.
Comparative studies of diversity may be clearly affected by collection methods and consequently we acknowledge that comparing species composition in the three major layers (i.e., ground, shrub, and overstorey) considered in the present study is a real challenge. However, given inherent structural differences in each layer, there is no single collection technique that permits effective and standard sampling across the vertical gradient. For each forest layer we used well-accepted techniques that effectively sample the fauna and therefore, even if abundances are not comparable, it is fair and reasonable to compare the species richness among the three layers. In this study, mid-overstorey and shrub layers were exhaustively sampled ensuring to the extent possible that most, if not all, individuals from branches and shrubs at each sampling site were collected. However, use of pitfall traps for ecological studies is controversial (Topping and Sunderland Reference Topping and Sunderland1992; Lang Reference Lang2000) since they sample selectively, resulting in less mobile species being underrepresented (Greenslade Reference Greenslade1964; Spence and Niemelä Reference Spence and Niemelä1994; Luff Reference Luff1996). However, data from any passive sampling method will present a similar tradeoff and active sampling for ground-dwelling spiders in complex litter environments is an unviable proposition, likely resulting in an even more biased sample. Having collected few mobile species common to the ground and both the shrub and mid-overstorey layers is an indication that in fact there is a real difference in species composition among layers beyond the sampling effect. This conclusion is further supported by the significant results from the presence/absence-based PERMANOVA and the contrasting beta-diversity values. As a consequence, although our results should be interpreted with some caution, we are confident that the observations presented above adequately describe the system we have studied for the early summer time-frame and that the resulting characterisations of the fauna in various forest layers are robust.
The mixedwood boreal forest of Alberta, Canada maintains a relatively diverse spider assemblage as revealed by a number of recent studies (Buddle et al. Reference Buddle, Spence and Langor2000; Work et al. Reference Work, Shorthouse, Spence, Volney and Langor2004; Buddle and Shorthouse Reference Buddle and Shorthouse2008; Pinzon and Spence Reference Pinzon and Spence2010). However, most studies have focused on ground-dwelling assemblages and relatively little is known about the species composition in higher forest strata. In previous research, Pinzon et al. (Reference Pinzon, Spence and Langor2011) reported 88 spider species in three major layers (i.e., litter, understorey, and overstorey) of unharvested conifer forests; yet, it is likely that 100–120 species use conifer forests at the EMEND study area. Furthermore, specific microhabitats that uniquely harbour unobserved species may be consistently overlooked; habitats with such potential include dead branches, open tree cones, and loose bark at higher layers and standing and fallen dead trees in lower layers.
This new understanding of habitat partitioning by forest spiders underscores the importance of conifer stands for biodiversity and raises further questions about the nature of the potential resource partitioning. Other studies have shown that spider species richness and abundance in any given forest stratum varies according to the forest type (Elliott Reference Elliott1930; Turnbull Reference Turnbull1960; Basset et al. Reference Basset, Aberlenc and Delvare1992, Reference Basset, Aberlenc, Barrios, Curletti, Berenger and Vesco2001; Sørensen Reference Sørensen2003). This, in turn, suggests that habitat characteristics and environmental features vary in concert and that a meta-analysis of these patterns could be interesting and fruitful as data accumulate about a range of forest systems.
Given the significant relationship of species richness and abundance with height and branch size, we expected to see a more evident difference in species composition among strata within the mid-overstorey, reflecting changes in both habitat structure and environmental features (e.g., light, temperature, moisture, wind, etc.) along the height gradient. Although less apparent than expected, a weak pattern was suggested by the cluster analysis and ordination. Thus, on the fine scale within the mid-overstorey, species composition shows small differences, partitioning the mid-overstorey in three gross layers (H2–H6, H7–H9, and H10–H11). It would be worth looking at the fauna in these layers in more detail to better understand how environmental variables change in the canopy of white spruce and how these are correlated with those subtle, yet visible, changes in spider composition.
Spider abundance and consequently species richness were affected by both branch height and branch size, but not by their interaction (contrary to our expectation, given that white spruce branches tend to be smaller from the base to the crown top). Due to the logistic constraints of climbing, it was not possible to collect in upper portions of the tree crown in this study and perhaps stronger differences could have been observed. However, in a previous study in the same study area where white spruce trees were cut and felled onto plastic tarps (Pinzon et al. Reference Pinzon, Spence and Langor2011), 20 species sampled from the top half of those trees were not collected in the present study, suggesting that in fact differences in species composition are expected as height increases in the unsampled portion of the trees, perhaps following the observed layering from the bottom half.
In conclusion, results from this study clearly demonstrate the importance of including higher canopy layers in biodiversity considerations for the mixedwood boreal forest. Previously, a total of 63 species was recorded together from the understorey (56 species) and overstorey (35 species) layers of white spruce unharvested stands at EMEND (Pinzon et al. Reference Pinzon, Spence and Langor2011). Together with the present results, the known species richness in these two layers has increased to 77 (63 and 45 species, respectively). Thus, a relatively large number of spider species is maintained in the shrub and overstorey strata, habitats unrepresented in most previous studies of the epigaeic spiders found in the Canadian boreal forest. Studies of a full range of potential habitats for each taxon are essential for full understanding of forest biodiversity required to understand the fauna and as support for more sustainable forest management.
Acknowledgements
We thank David Wise, Anne Oxbrough, Esther Kamunya, and two anonymous referees for discussions and comments on earlier versions of the manuscript. We thank Erin Elliot, Esther Kamunya, Xiao Dong Yu, Jason Edwards, Charlene Hahn, and EMEND core crew for their invaluable help during field work, and Don Buckle for his help with spider identifications. Stephane Bourassa and Guillaume Blanchet helped with the French translation of the abstract. The Killam Trust Scholarship, the Natural Sciences and Engineering Research Council of Canada (NSERC), the Foothills Research Institute, and many of the EMEND partners (especially Daishowa-Marubeni International, Canadian Forest Products, and Manning Diversified Forest Products) provided funds for this project.
Supplementary materials
For supplementary material referred to in this article, please visit http://dx.doi.org/doi:10.4039/tce.2012.93 and http://www.journals.cambridge.org/tce2013002


