Long-chain PUFA (LCPUFA) accumulate in the fetus during pregnancy and during early childhood( Reference Carlson, Fallon and Kalish 1 ). These PUFA are concentrated in the central nervous system( Reference Uauy and Dangour 2 ). Essential fatty acids (EFA) of both n-6 and n-3 fatty acid (FA) families and their LCPUFA metabolites play a significant role in neuronal growth and differentiation of cells and have been associated with cognitive abilities of children( Reference Uauy and Dangour 2 – Reference Briend, Dewey and Reinhart 4 ). Poor PUFA status may affect brain development as well as the cognitive abilities of children( Reference Briend, Dewey and Reinhart 4 ). Brain development continues through childhood and early adolescence, with cerebral volume reaching 95 % of its peak by 6 years of age and reaching its maximum between 10 and 15 years of age( Reference Lenroot, Gogtay and Greenstein 5 ). Thus, LCPUFA should be included in the diets of infants and children to ensure optimal brain development( Reference Helland, Smith and Saarem 6 – Reference Clandinin and Van Aerde 8 ).
In most developing countries, a large proportion of the population cannot afford diets rich in animal foods( Reference Briend, Dewey and Reinhart 4 , Reference Huffman, Harika and Eilander 9 ), and lack of foods from animal sources may lead to PUFA deficiency( Reference Briend, Dewey and Reinhart 4 ). Several PUFA supplementation studies conducted in young children (<2 years) have demonstrated that children fed foods/milk fortified with α-linolenic acid (ALA) or its metabolites EPA and DHA alone or together with other micronutrients enhanced cognitive development( Reference Huffman, Harika and Eilander 9 ). These studies suggest that high intake of LCPUFA may improve cognitive abilities later in life (i.e. after 2 years of age)( Reference Huffman, Harika and Eilander 9 , Reference Sheppard and Cheatham 10 ). Sheppard & Cheatham( Reference Sheppard and Cheatham 10 ) concluded that LCPUFA influence the cognitive development of children, especially with regard to planning and memory processing. Previous studies have utilised food intake data or supplementation programmes to estimate FA status of children( Reference Cheatham, Colombo and Carlson 11 ). To our knowledge, a few of these studies have directly measured whole-blood FA status as it relates to cognitive development in children between 4 and 6 years of age.
Executive function, the conscious control of thoughts and actions, develops between the ages of 2 and 10 years( Reference Zelazo 12 ). Executive function involves inhibition, working memory and task switching( Reference Zelazo 12 ) and is controlled by the frontal and temporal lobes of the brain( Reference Sheppard and Cheatham 10 ). These two regions of the brain continue to develop after the 2nd year of life and contain high amounts of arachidonic acid (AA) and DHA( Reference Hughes and Bryan 13 ). A method commonly used to assess executive function in young children is the dimensional change card sorting (DCCS) task( Reference Zelazo 12 ). Therefore, we used the DCCS task to assess cognitive function in this population of young children.
In addition, although FA are widely understood to affect growth and cognition, the associations between blood levels of specific FA and these health outcomes are infrequently reported. In this study, we assess the association between FA status and executive function in Tanzanian children using a DCCS test with culturally modified colours and images( Reference Zelazo 12 ). We hypothesised that whole-blood levels of EPA, DHA and both EFA (ALA and linoleic acid) would be positively associated with performance on the DCCS tasks.
Methods
Study site
The present study was conducted in Rudewa Mbuyuni village in Kilosa District, Morogoro, Tanzania. Conditions prevailing in the village have previously been described( Reference Ntwenya, Kinabo and Msuya 14 ). Children in the village begin attending primary school by about 7 years of age. At present, there are no preschool programmes in the village. The Ministry of Health in Tanzania requires that all children <5 years of age visit a growth-monitoring clinic every month, receive vaccinations according to a published schedule as well as receive vitamin A drops twice a year (June, December).
Subjects and ethics approval
All children in the village were invited to participate in this study. From December 2013 to August 2014, 335 apparently healthy children between 2 and 6 years of age were enrolled in this cross-sectional study. All participants and their mothers/caregivers verbally consented to participate in the study. The National Medical Research Board (NIMR) of Tanzania (NIMR/HQ/R.8a/Vol. IX/1189) and the Michigan State University (USA) Human Research Protection Program (IRB no. 13-700) approved the study. These children were also enrolled in an International Development Research Center (Ottawa, ON, Canada)-funded research study entitled Food Security, Adequate Care and Environment: Eco-Nutrition Guidelines for Community Action on Climate Change. Some results from that study have been previously published( Reference Ntwenya, Kinabo and Msuya 14 , Reference Ntwenya, Kinabo and Msuya 15 ). A total of ten children refused to take the test at initial contact and withdrew from the study. Swahili was used as the language of communication throughout the study.
Anthropometric measurements
Height was measured to the nearest 0·1 cm with a stadiometer (Shorr Productions; Perspective Enterprises), and weight was measured using a digital bathroom scale to the nearest 0·1 kg (SECA; Vogel & Haike). The average of two measurements was used. Date of birth was recorded from the reproductive and child health clinic (RCH) card, and mother’s recall was used for those without a RCH card. Sex of the child was recorded. Data on weight, height, date of birth and sex were entered into World Health Organization Anthro( 16 ) and World Health Organization AnthroPlus( 17 ) to calculate z-scores.
Whole-blood assessments
A capillary blood sample was obtained from the middle finger for malaria rapid test (Premier Medical Co. Ltd) and measurement of Hb concentrations using a HemoCue photometer (HemoCue AB); samples were dropped onto dried blood spot (DBS) cards pre-treated with an antioxidant cocktail( Reference Jumbe, Comstock and Hahn 18 ). DBS cards were stored in a dry, dark, cool environment and shipped to OmegaQuant in USA for FA analysis within 14 d of sample collection. DBS cards were punched and combined with a derivatising reagent (boron trifluoride in methanol (14 %), toluene and methanol (35:30:35 parts)), shaken and heated at 100°C for 45 min. After cooling, forty parts of both hexane and distilled water were added and briefly vortexed. FA methyl esters were analysed using a GC as previously described( Reference Harris, Varvel and Pottala 19 ). The stability of FA from blood samples collected, stored and transported in this manner has been documented in previous studies from our laboratory( Reference Johnston, Deuster and Harris 20 , Reference Sarter, Kelsey and Schwartz 21 ) and by others( Reference Marangoni, Colombo and Galli 22 , Reference Bailey-Hall, Nelson and Ryan 23 ). Whole-blood FA proportions are expressed as a percentage of total identified FA. The following FA were assessed: myristic, palmitic, palmitelaidic, palmitoleic, stearic, elaidic, oleic, linoelaidic, linoleic, arachidic, γ-linolenic, eicosanoic, ALA, eicosadienoic, behenic, mead, dihomo-γ-linolenic, AA, lignoceric, EPA, nervonic, docosatetraenoic, DHA, docosapentaenoic n-6 and docosapentaenoic n-3. The triene:tetraene (T:T) ratio is the ratio of mead acid:AA. Historically, a T:T ratio>0·02 in plasma samples defines essential FA deficiency( Reference Siguel 24 , Reference Siguel, Chee and Gong 25 ). Therefore, a T:T ratio>0·02 was used to define insufficient levels of EFA( Reference Sauberlich 26 , Reference Siguel 24 ).
Cognitive assessment: dimensional change card sort
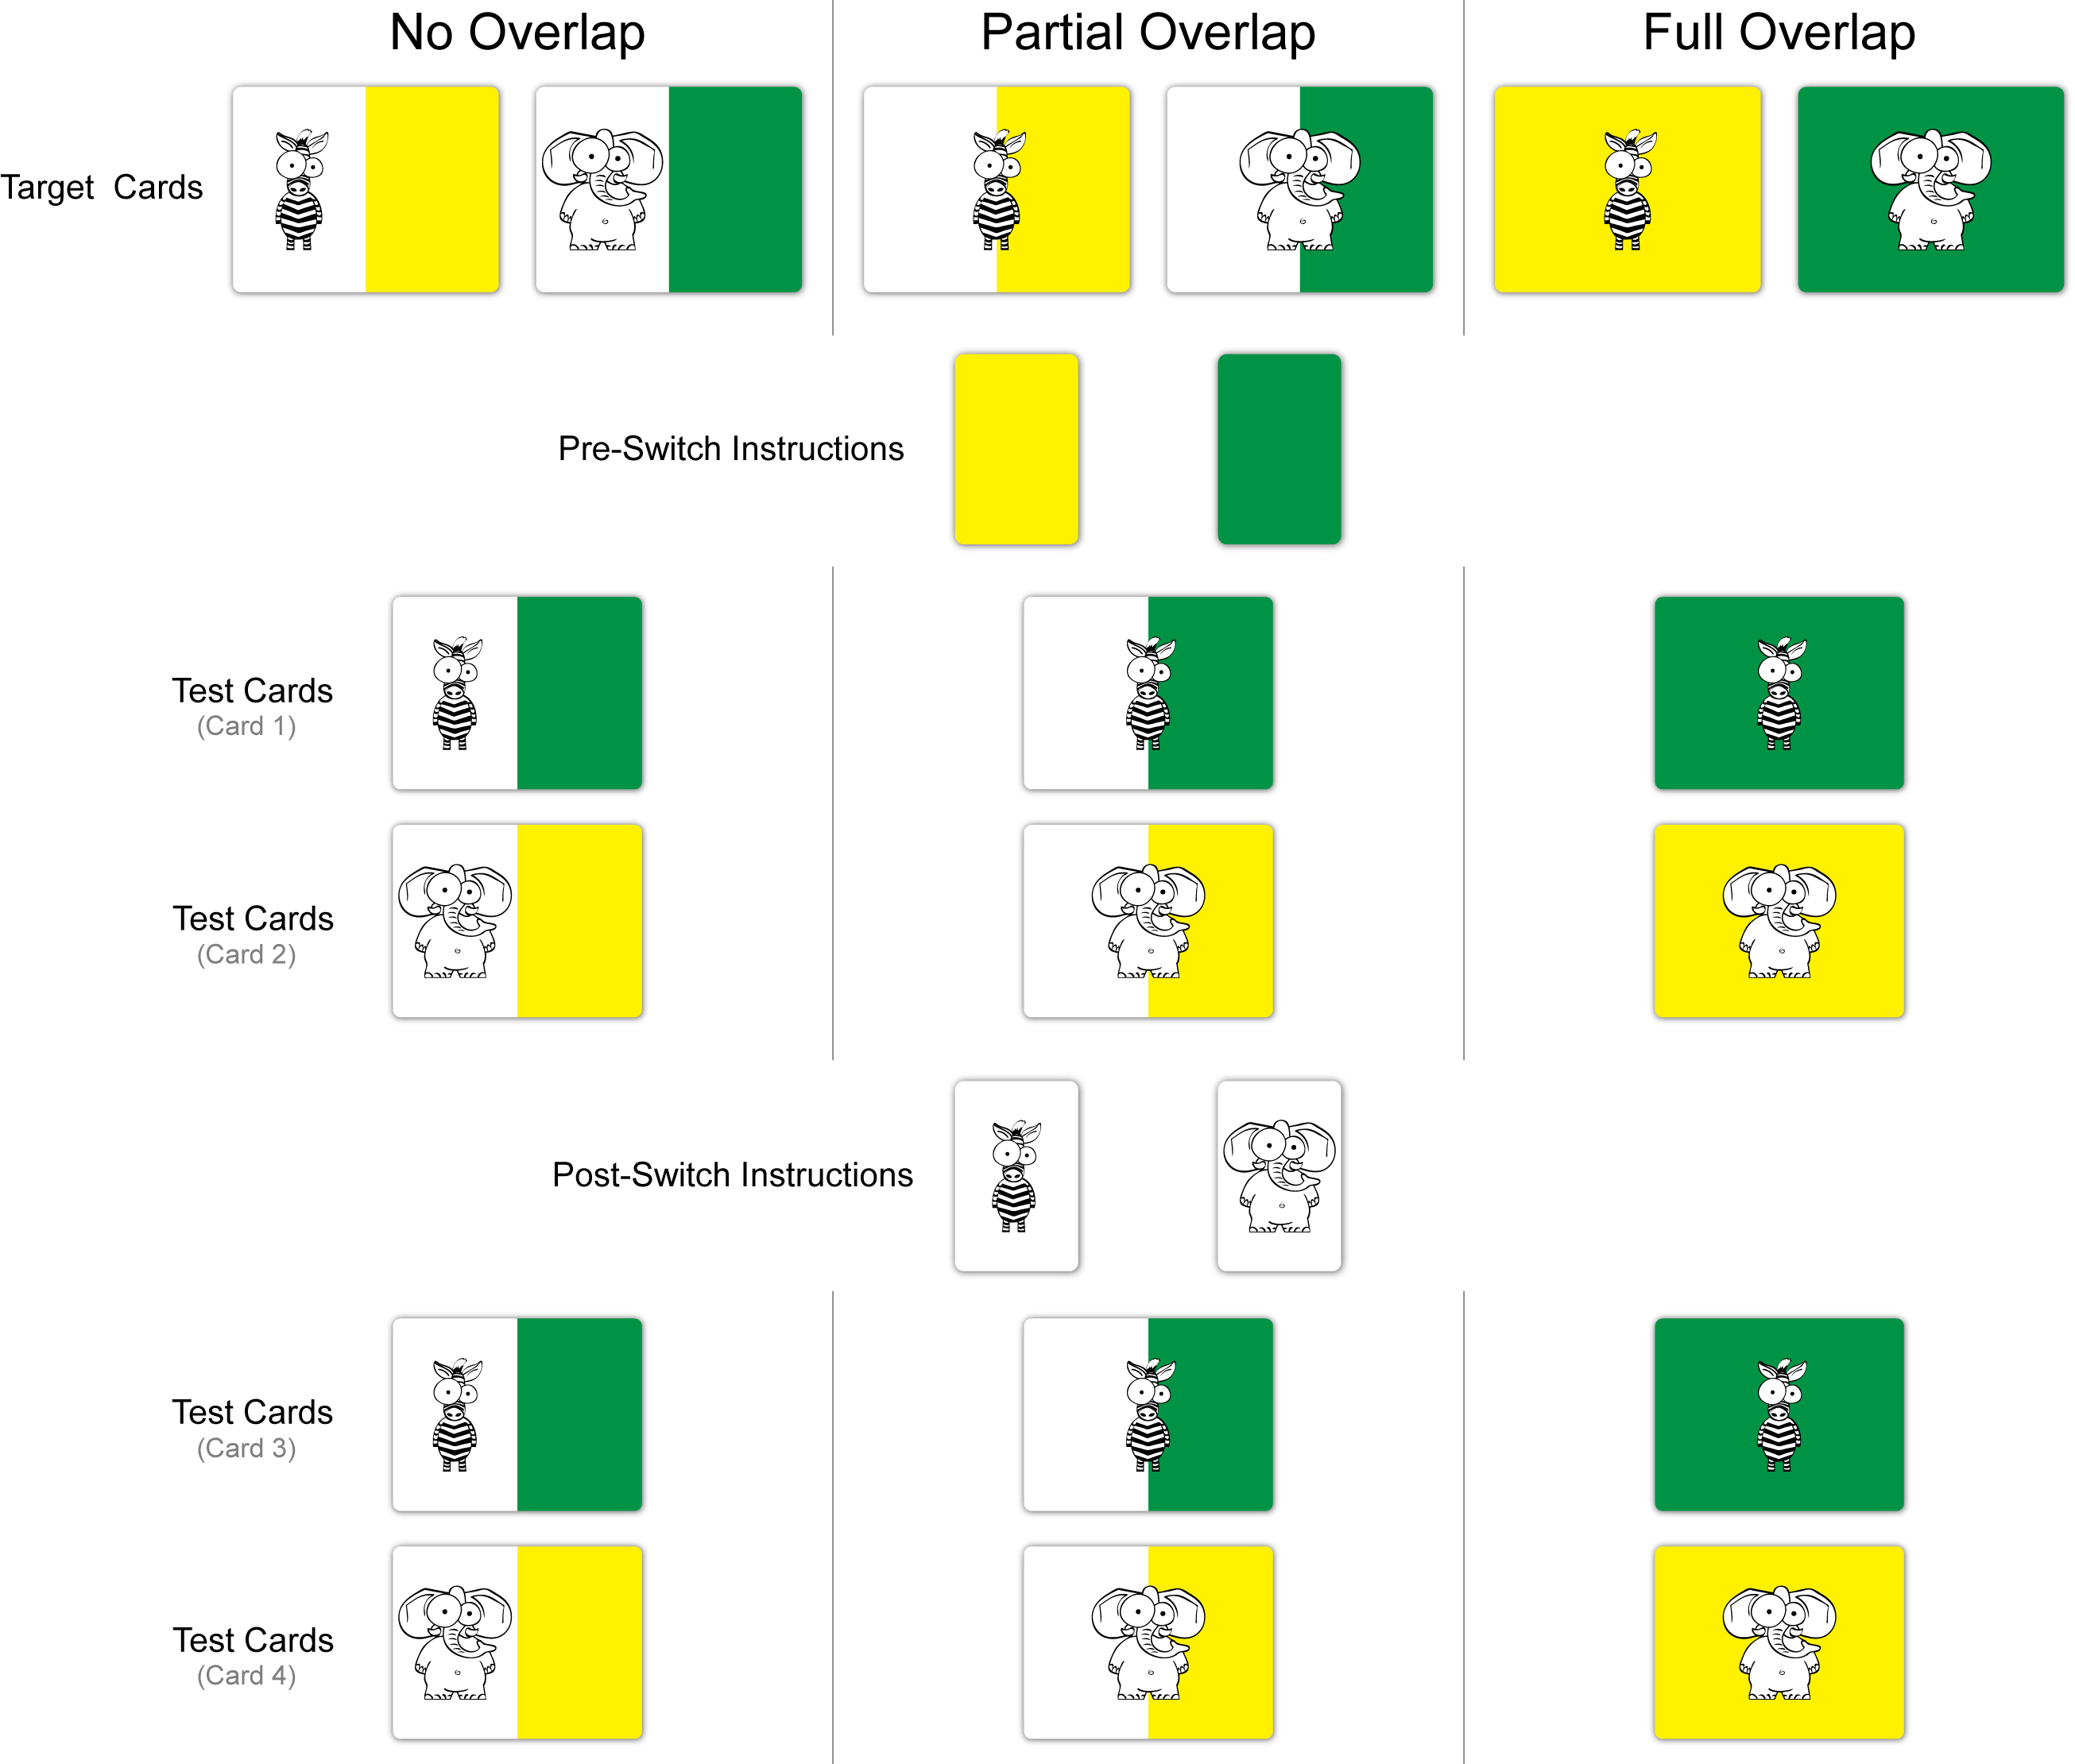
The DCCS( Reference Zelazo 12 , Reference Zelazo, Muller and Frye 27 ) is conceptually simplistic in that it requires the child to sort a series of bivalent cards (online Supplementary Fig. S1) on the basis of one of two instructed dimensions (i.e. colour or shape). Following sorting of an initial series of eight cards based upon colour, the children were instructed to switch the categorisation dimension and sort another series of eight cards on the basis of shape.
Previous studies have demonstrated that children younger than 3 years of age can complete the pre-switch series( Reference Diamond, Carlson and Beck 28 ), but the dimensional change requires engagement of executive function in order to inhibit the previous rule set to execute the correct sorting behaviour( Reference Zelazo 12 , Reference Rennie, Bull and Diamond 29 ). Indeed, children with poor executive function exhibit a tendency to perseverate during the post-switch series by continuing to sort the cards by the first dimension despite being able to verbally express the new sorting rules. A critical limitation of the traditional card sort task, however, is the relatively narrow age range in which it can be utilised, with Rennie et al.( Reference Rennie, Bull and Diamond 29 ) observing that children are unable to successfully complete the post-switch sorting series until about 4–5 years of age. Accordingly, a modified variant of the DCCS task was used in order to increase the number of participants who could perform the task( Reference Diamond, Carlson and Beck 28 ). As young children and those with poor executive function appear to have greater attentional inertia – manifesting with increased difficulty separating features of an object( Reference Kirkham, Cruess and Diamond 30 ) – separating the sorting attributes into differentiable objects reduces, but does not remove, the inhibitory demands required to complete the switch( Reference Diamond, Carlson and Beck 28 ). Therefore, participants completed three versions of the DCCS, which progressively increased the executive function requirements by increasing the overlap between the shape and colour stimulus on the cards (i.e. no overlap, partial overlap, full overlap). The task was modified to use images and colours familiar to the participating children. The mother or caregiver was present during the test to observe the process and allow the child to feel comfortable and confident.
Each version of the DCCS (no overlap, partial overlap, full overlap) had a pre- and post-switch phase. For a child to pass any phase, she or he needed to obtain six correct responses out of eight. If fewer than six correct responses were made in the pre-switch phase, the post-switch phase of that version was not scored. The child was then asked to continue with the next version of the DCCS. Consistent with two dominant approaches to scoring the DCCS, task performance was summarised using the following: (1) highest test passed and (2) total passes. Scoring for (1) ‘highest test passed’ was ordered. A child scored ‘0’ if he or she was unable to pass any post-switch phase, ‘1’ if the child passed the no overlap DCCS post-switch task and the partial overlap post-switch, and ‘2’ if the child passed the full overlap post-switch task. Scoring for (2) ‘total passes’ was not ordered. It was based on the total number of post-switch phases passed and ranged from 0 to 3.
Data reduction and statistical analyses
An a priori power analysis was conducted using the results of previous investigations observing an association between nutritional supplementation and performance on the proposed tasks( Reference Colombo, Carlson and Cheatham 31 ). Assuming a conservative effect size (f 2=0·1), a two-sided α of 0·05 and a β of 0·20 (i.e. 80 % power), a sample of eighty-one participants was estimated to provide adequate power. As more than half of the children <48 months of age failed to pass any DCCS task (Fig. 1), we excluded them from our analyses. The analyses presented in this study are from the 130 children older than 48 months. A post hoc analysis of the statistical power using the method of Cohen( Reference Cohen 32 ) was conducted. Using the data obtained from the analysis of linoleic acid, with 130 subjects, and α set to 0·05, we had 92 % power to detect an R 2 of 0·08. This was adjusted for two additional independent variables (Hb and malaria) with an R 2 of 0·07.

Fig. 1 Percentage of children able to pass each stage of the dimensional change card sort test.
![]() Did not pass;
Did not pass;
![]() , passed no overlap;
, passed no overlap;
![]() , passed partial overlap;
, passed partial overlap;
![]() , passed full overlap.
, passed full overlap.
Basic descriptive analyses were conducted to obtain means and frequencies. Means between groups (i.e. the total study population v. the 130 kids≥48 months of age; those who did not pass any DCCS task v. those who passed at least one DCCS task) were compared using t tests (for continuous data) or χ 2 analysis (for proportions), as appropriate.
As high collinearity among the FA caused tolerance levels<0·1 and gave variance inflation factors >10 when all the FA were entered into a single model, single linear regressions were used to analyse the association between blood FA levels and executive function. Models for linear regression included the FA of interest, Hb levels and malaria status. We included Hb concentrations in our model because it is a known significant predictor of cognitive abilities in our population( Reference Bhargava, Jukes and Ngorosho 33 ). None of the children exhibited symptoms of active malaria infection. Positive malaria status indicated subclinical infection and was included as a covariate because it was positively associated with DCCS performance. To correct for multiple testing, PROC MULTTEST with the false discovery rate (FDR) option was applied. The FDR option uses the linear step-up adjustment described by Benjamini & Hochberg( Reference Benjamini and Hochberg 34 ). SAS version 9.4 was used for these statistical analyses.
Factor analysis was used to reduce the number of FA variables using Proc Factor in SAS version 9.4. This enabled correlated variables to be assessed simultaneously. A linear transformation was performed to enable interpretation. In this case, varimax rotation was performed; three factors were retained as determined by eigenvalues>2. For each of the three factors, FA with rotated factor loadings>0·2 constitute that factor. The procedure assigns each person a score for each of the three factors that emerged from the data. Multiple linear regression using these factor scores as predictors was used to determine the associations between these factors and performance on the DCCS tasks. Models for these linear regressions included the three factor scores, age, sex, BMI-for-age z-scores (BAZ), Hb levels and malaria status. To determine associations between EFA status and executive function, we conducted polytomous logistic regressions for categorical variables using SAS version 9.4. In all cases, a P value<0·05 was used to define statistical significance.
Results
This study enrolled 335 children between 2 and 6 years of age. Of these, 325 attempted the DCCS tasks and ten refused to attempt the DCCS. Basic information about the study participants are presented in Table 1. Less than half of the children between 24 and 48 months successfully performed any DCCS task (Fig. 1). Of the 130 children≥48 months who attempted the DCCS tasks, 38 % passed the full overlap task, 18 % passed the partial overlap task, 13 % passed the no overlap task and 31 % failed to successfully complete any of the tasks. Children≥48 months who successfully completed at least one DCCS task were older, taller and more likely to test positive for malaria than those children who could not complete any DCCS tasks (Table 2).
Table 1 Participant characteristics (Mean values and standard deviations; numbers and percentages)

Table 2 Characteristics of children≥48 months stratified by dimensional change card sort performance (Mean values and standard deviations; numbers and percentages)

BAZ, BMI-for-age z-score; WAZ, weight-for-age z-score.
FA levels in whole blood from the 130 children whose data were analysed are presented in Table 3. The mean linoleic acid level was 17·6 (sd 2·7), as a percent of whole-blood FA, whereas the mean ALA level was 0·4 (sd 0·2). The mean duration of breast-feeding among children ≥48 months was 22·8 (sd 4·4) months. Breast-feeding duration was similar between children who failed to complete any DCCS task and those who successfully completed DCCS tasks (Table 2). In this population, breast-feeding duration closely matched the WHO recommendation to breast-feed up to 24 months( 35 ).
Table 3 Whole blood fatty acid proportions in Tanzanian children≥48 months of age (n 130) (Mean values and standard deviations)

Regression results between the selected FA and the ordered assessment (the highest test passed) and the non-ordered assessment (total passes) of DCCS performance are shown in Table 4. A significant inverse association was observed between DCCS performance and ALA and nervonic acid. Linoleic acid was positively associated with DCCS performance. These three FA were tested in a multiple linear regression model that included the following confounders: malaria infection status, Hb concentration, age, sex and BAZ. For both non-ordered and ordered assessments of DCCS performance, the model was significant (P<0·0001). For the non-ordered assessment, this model explained 24 % of the variation (r 2 0·24; adjusted r 2 0·19). For the ordered assessment, this model explained 25 % of the variation (r 2 0·25; adjusted r 2 0·20). To test the hypothesis that whole-blood levels of EPA, DHA and both EFA (ALA and linoleic acid) would be positively associated with performance on the DCCS tasks, multiple linear regression using EPA, DHA, ALA, linoleic acid, malaria, Hb, age, sex and BAZ was conducted. For both non-ordered and ordered assessments of DCCS performance, the model was significant (P≤0·0002). For the non-ordered assessment, this model explained 26 % of the variation (r 2 0·26; adjusted r 2 0·21). For the ordered assessment, this model explained 24 % of the variation (r 2 0·24; adjusted r 2 0·18). DHA (p ≤ 0·01), ALA (P<0·05), linoleic acid (p ≤ 0·01) and malaria (p ≤ 0·01) were significant contributors to the model in both non-ordered and ordered assessments. DHA, linoleic acid and malaria were positively associated with performance on the DCCS tasks, whereas ALA was inversely associated with performance on the DCCS tasks. It is notable that a full model including all twenty-five single FA as well as Hb concentrations, malaria status, age, sex and BAZ was significant (P=0·003 for total passes and P=0·004 for highest test passed) and explained about 38 % of the variance (r 2 0·38; adjusted r 2 0·21 for total passes and adjusted r 2 0·19 for highest test passed). However, the effects of independent FA and the covariates could not be determined because of high levels of collinearity causing poor tolerance and variance inflation in the model.
Table 4 RegressionFootnote † results for the two methods of scoring the dimensional change card sort and selected fatty acids (FA)

FDR, false discovery rate.*All significant associations (P<0·05).
† Model: total passes=FA+malaria status+Hb concentration. Highest test passed=FA+malaria status+Hb concentration.
To bypass the problems with collinearity, factor analysis was conducted. When factor analysis was used to determine how combinations of the FA might be associated with performance on the DCCS tasks, three factors emerged. The factor loading matrix is shown in Table 5. Multiple linear regression using these three factors (P<0·0001) demonstrated that factor 2 (P<0·01) and factor 3 (P<0·01) were significantly inversely associated with performance on the DCCS tasks (Table 6). When combined with Hb concentrations, malaria status, age, sex and BAZ, these parameters explained 26 % of the variance (r 2 0·26; adjusted r 2 0·21 for both ordered and non-ordered assessments) in the performance on the DCCS tasks.
Table 5 Factor loading matrix for fatty acids (FA) in the whole blood of Tanzanian children≥48 months of age

Table 6 RegressionFootnote † results for the two methods of scoring the dimensional change card sort and fatty acid (FA) factors

*All significant associations (P<0·05).
† Model: total passes=factor 1+factor 2+factor 3+malaria status+Hb concentration+age+sex+BMI-for-age z-score; model P value, P<0·0001; r 2 0·26; adjusted r 2 0·21. Highest test passed=factor 1+factor 2+factor 3+malaria status+Hb concentration+age+sex+BMI-for-age z-score; model P value, P<0·0001; r 2 0·26; adjusted r 2 0·21.
Polytomous logistic regression analyses demonstrated that children with low EFA levels (T:T ratio>0·02) tended to perform more poorly on DCCS tasks than children with high EFA levels (T:T ratio≤0·02). These models included malaria status and Hb levels as co-variates. For the non-ordered assessment of DCCS performance (total passes), children with higher levels of EFA were seven times more likely to successfully complete all three post-switch DCCS tasks than children with lower levels of EFA (OR 6·9; 95 % CI 1·4, 35·3; P=0·02). The overall model P value was 0·13 when Hb and malaria were included and 0·09 when they were not included. This was also true for the ordered assessment of DCCS performance, where children with higher levels of EFA were four times more likely to successfully complete the full overlap post-switch DCCS task than children with lower levels of EFA (OR 3·8; 95 % CI 1·05, 13·9; P=0·04). The overall model P value was 0·13 when Hb and malaria were included and 0·09 when they were not included. The inclusion of Hb and malaria in the models did not affect the OR, CI or P values for the EFA levels comparisons.
Discussion
The hypothesis that children with higher whole-blood levels of EFA would be more likely to successfully complete the DCCS tasks was partially supported. When whole-blood FA levels were analysed individually, children with higher levels of linoleic acid exhibited better executive function. However, children with higher levels of ALA exhibited poorer executive function. When analysed individually, neither DHA nor EPA was associated with executive function. In a model that simultaneously included the parameters EPA, DHA, ALA, linoleic acid, malaria status, Hb concentration, age, sex and BAZ, DHA, linoleic acid and malaria status were positively associated with executive function, and ALA was inversely associated with executive function. Furthermore, children with sufficient EFA levels (T:T ratio≤0·02) were four times more likely to pass the full overlap post-switch DCCS task than children with low EFA levels.
A model that included all twenty-five FA, malaria status, Hb concentration, age, sex and BAZ indicated that these parameters explained 20 % (adjusted r 2) to 38 % (r 2) of the variation in executive function in Tazanian children of 4–6 years of age. This may be indicative of the importance of energy status in human brain development as the human brain uses 44–87 % of resting metabolic energy during childhood( Reference Kuzawa, Chugani and Grossman 36 ). The brain’s peak use of daily energy occurs by about 4 years of age( Reference Kuzawa, Chugani and Grossman 36 ). The fact that the n-6 FA linoleic acid, which is critically required for the efficient use of dietary energy content( Reference Nakamura, Yudell and Loor 37 ), is positively associated with executive function supports the idea that energy availability may be key for optimal cognitive performance. Unfortunately, total energy intake and resting metabolic rate data were not available for the participants in this study.
Randomised-controlled supplementation trials, where mothers were supplemented with PUFA during pregnancy, lactation or both, and the child’s later cognitive performance was assessed, report varied conclusions( Reference Campoy, Escolano-Margarit and Anjos 38 , Reference Sun, Como and Downey 39 ). Some studies have shown positive associations between LCPUFA and executive function, specifically in the domains of planning and working memory( Reference Sheppard and Cheatham 10 , Reference Jiao, Li and Chu 40 ). A study by Helland et al.( Reference Helland, Smith and Saarem 6 ) found that children of mothers consuming LCPUFA supplements during pregnancy had higher intelligence quotient at 4 years of age than children whose mothers had not been supplemented. However, Ghys et al.( Reference Ghys, Bakker and Hornstra 41 ) found no association between cognitive performance at 4 years of age and phospholipid DHA and AA levels at birth. A recent meta-analysis has shown that PUFA supplementation associated positively with cognition only in PUFA-deficient participants( Reference Cooper, Tye and Kuntsi 42 ). Additional differences among these studies include timing of supplementation, failure to measure blood levels of FA, a wide-array of cognitive outcome measures and a focus on n-3 FA rather than a full analysis of all FA.
It has been suggested that discrepant results from supplementation studies are due to genetic variation in the fatty acid desaturase (FADS) gene cluster( Reference Glaser, Lattka and Rzehak 43 , Reference Lauritzen, Fewtrell and Agostoni 44 ). Genetic differences in FA enzymes can alter how individuals process fats that they consume in their diet. When FA levels are measured in the blood, these enzymatic processes are accounted for automatically. Therefore, measuring FA in blood is an improvement over measuring FA intake when it comes to determining the associations between specific fats and cognitive development. The direct analysis of blood FA avoids the potential confounding effect of genetic differences that may decrease blood levels of LCPUFA due to altered FA desaturase activity( Reference Glaser, Lattka and Rzehak 43 ). Thus, supplementation studies that do not assess genetic variation or blood levels of FA miss this critical parameter.
Specificity of cognitive testing may also contribute to the discrepant results( Reference Sun, Como and Downey 39 ). For instance, a systematic review (that included individuals of all ages) reported that n-3 FA intake for more than 3 months did not affect executive function( Reference Jiao, Li and Chu 40 ). In our study, current n-3 FA levels only tended to be associated with executive function. However, in a study by Colombo et al.( Reference Colombo, Carlson and Cheatham 31 ), LCPUFA supplementation in infancy improved executive function in later childhood, but the report did not include current FA levels. In the Colombo study, LCPUFA supplementation did not affect language and development at 18 months or spatial memory, simple inhibition or advanced problem solving at any age. Thus, it is evident that specific testing can lead to different conclusions.
This study has several strengths. Studies to date have focused on FA intake of mothers during pregnancy and lactation, the FA intake of babies through breast milk or formula or the FA intake of school-aged children. The current study assessed a set of twenty-five FA rather than focusing solely on the LCPUFA such as DHA and EPA. Some studies have measured erythrocyte or plasma FA in Tanzanian women and infants( Reference Luxwolda, Kuipers and Koops 45 – Reference Luxwolda, Kuipers and Boersma 47 ). The current study addressed the gap between 4 and 6 years of age. This is an important time period to understand, because it is a time of major brain growth( Reference Kuzawa, Chugani and Grossman 36 ) and a time that the neurons of the prefrontal cortex continue to be myelinated from childhood into adolescence( Reference Hughes and Bryan 13 ). In addition, we report associations between current FA blood levels and the current cognitive performance of the children, providing a direct link between current FA status and cognition. Although Tanzanian children are routinely monitored for growth, there is no formal system to monitor cognitive development. Most studies that assess cognition in young children use the Bayley scales of development( Reference Sun, Como and Downey 39 , Reference Sudfeld, McCoy and Fink 48 – Reference Murray-Kolb, Rasmussen and Scharf 51 ), but our study utilised a specific test of executive function. Therefore, this study provides a first look at the associations between nutrition and executive function in Tanzanian children. The DCCS tasks are an excellent tool for assessing executive function in young children from a variety of backgrounds and experiences. This task can be customised to fit the cultural expectations of the population being analysed( Reference Zelazo 12 ). In this case, we customised the DCCS tasks to include animals and colours that were likely to be familiar to the children. In addition, the test was performed in the local language, Swahili. However, the paper-based format of testing was novel to the children because these children typically do not have access to paper before attending school at the age of 7 years. Consistent with previous investigations conducted in the USA( Reference Kirkham, Cruess and Diamond 30 ) and Scotland( Reference Rennie, Bull and Diamond 29 ), in our population >50 % of those≥48 months of age were able to successfully complete at least one DCCS task, regardless of their FA status. This suggests that our application of this modified DCCS in this population is valid. Further, another strength of the present investigation was the use of two common scoring approaches for the DCCS. For each scoring method, performance on the DCCS was similarly related to FA levels.
There are some limitations to our study. As this study was cross-sectional, all reported associations are correlative rather than causative. This study was conducted in one village in rural Tanzania, and thus the results are not generalisable to children residing in other areas of Tanzania or other areas of the world. The study was powered to detect effects of EFA. Therefore, the lack of association between cognitive function and individual long-chain n-3 FA such as DHA may have been due to the number of subjects analysed. During this study, blood samples were collected throughout the day. No fasting was required. This may increase variability in the whole-blood FA measurements. However, in this setting, differences are likely to be small because children from the village consume relatively similar and low-fat meals compared with children in other settings. In addition, we analysed whole-blood samples for lipids and were not able to differentiate among the source compartment of the lipid. Furthermore, blood levels of FA may not only indicate higher intake of that FA but also may reflect changes in the conversion of that FA to a longer-chain or desaturated FA. Children in this village had additional nutritional deficiencies, and we have corrected for those parameters for which we had data. Although socio-economic data were not collected from parents/caregivers, the population was relatively homogeneous in this regard( Reference Ntwenya, Kinabo and Msuya 14 ).
In summary, the results of this study suggest that whole-blood EFA levels are associated with cognition. Intervention trials that include assessment of whole-blood FA levels are required to determine the relationships between intake, blood levels and executive function in Tanzanian children.
Acknowledgements
The authors acknowledge the assistance of Mariana Ngowi and the village research teams who assisted during data collection.
This study was made possible by the generous support of American people through the United States Agency for International Development (USAID)-funded Innovative Agricultural Research Initiative project (iAGRI) (no. CA-621-A-00-11-00009-00). The opinions reported here are those of the authors and do not necessarily reflect the views of USAID or the United States Government.
T. J., S. S. C., J. K., M. B. P. and J. I. F. designed the study. T. J. and S. S. C. conducted the study. W. S. H., J. K., M. B. P. and J. I. F. provided essential materials necessary for the research. T. J., S. S. C., M. B. P. and J. I. F. analysed the data. All authors made contributions to the manuscript, but J. I. F. has the primary responsibility for the final content. All authors contributed to the critical interpretation and writing of the article and approved the final version.
No authors report conflicts of interest except W. S. H. whose laboratory (OmegaQuant Analytics, LLC) performed the DBS FA analyses.
Supplementary material
For supplementary material/s referred to in this article, please visit http://dx.doi.org/doi:10.1017/S0007114516003494