


Greater intake of fruits and vegetables (F&V) – rich in vitamins, minerals, fibre and phytochemicals – is known to lower the risk of CVD, cancer and all-cause mortality(Reference Zurbau, Au-Yeung and Blanco Mejia1–Reference Wang, Li and Bhupathiraju5). Although many countries recommend consuming adequate quantities of fresh F&V, intake remains insufficient globally. According to a recent study, the average intake of vegetables in 162 countries was 186 g/d, and 88 % of countries had an average vegetable intake lower than the WHO-recommended intake (240 g/d)(Reference Kalmpourtzidou, Eilander and Talsma6). In addition, over 1·5 million deaths worldwide were estimated to be due to insufficient F&V intake in 2019(7). Therefore, accurately measuring and monitoring F&V intake is important for the prevention of chronic diseases resulting from low F&V intake.
An individual’s F&V intake can be estimated through various surveys, such as 24-h dietary recalls, diet records and FFQ. However, these methods have inherent limitations related to their subjective nature(Reference Willett8). The accuracy of intake estimation depends on the memory and motivation of the individual and the coverage of the recipe and nutrient database used in the coding process. Thus, more objective methods are needed to improve the accuracy of F&V intake measurements.
Carotenoids are colourful organic pigments synthesised in photosynthetic organisms such as plants and algae(Reference Rodriguez-Concepcion, Avalos and Bonet9). However, humans cannot synthesise carotenoids and hence only consume them through the diet. Since carotenoids are found in various yellow, orange, red, and green F&V, such as carrot, spinach, kale, tomato, orange, and tangerine, they can be used as biomarkers for F&V intake(Reference Rodriguez-Concepcion, Avalos and Bonet9,Reference Noviendri, Hasrini and Octavianti10) . Moreover, most carotenoids are lipophilic and remain in the body longer than other hydrophilic biomarkers; thus, carotenoids reflect F&V intake in a longer term than hydrophilic biomarkers(Reference Willett8,Reference Stahl and Sies11) . Therefore, habitual F&V intake can be estimated by assessing carotenoid levels in the body.
The level of blood carotenoids, analysed using HPLC or LC-MS, is considered the best biological marker for F&V consumption(12). However, this method is invasive, expensive and time-consuming, making it unsuitable for large-scale epidemiological studies. Recently, optically assessed skin carotenoid status (SCS) has been evaluated as a promising biomarker of F&V intake, as the skin is a relatively stable storage site for ingested carotenoids(Reference Ermakov and Gellermann13,Reference Mayne, Cartmel and Scarmo14) . Optical techniques that can be used for non-invasive SCS measurement include Raman spectroscopy, UV/visible spectrophotometry and colorimetry. Raman spectroscopy is a well-known technique in optical chemometric analysis that measures the vibrational energies of atomic bonds and hence can be used for molecule-specific spectral fingerprinting. In Raman spectroscopy, the specimen is usually illuminated using laser light, and the energy spectrum of the scattered light from the specimen is measured using an optical spectrometer. This energy spectrum contains information on the molecular energy levels of the specimen. Resonance Raman spectroscopy (RRS) is one of the most widely used methods of SCS measurement. It is a special Raman spectroscopy technique that can highly enhance weak Raman signals by matching the laser excitation frequency to the frequency of an electronic transition of the target molecule. The amount of carotenoids stored in the skin can be measured non-invasively in a few minutes using RRS, making it a promising method of SCS measurement in large-scale epidemiological studies.
Studies on the relationship between SCS and F&V intake have been carried out in countries such as the USA, Germany and Japan(Reference Jilcott Pitts, Moran and Wu15–Reference Matsumoto, Suganuma and Shimizu17); however, studies measuring SCS in Koreans are rare. Furthermore, the correlation between SCS and F&V intake could differ according to ethnicity and region since SCS can be affected by race and genetic factors(Reference Jilcott Pitts, Jahns and Wu18), and the main food sources of carotenoids differ depending on the dietary culture. Therefore, the present study aimed to examine the validity of RRS-measured SCS as a biomarker for F&V intake in Korean adults.
Methods
Study procedure and participants
This cross-sectional study was conducted from June to September 2019. Korean adults aged 20–69 years were recruited through flyers posted at a general hospital in Seoul, Republic of Korea. The researchers explained the purpose and process of the study to the volunteers, who then provided written informed consent. Volunteers who met the following criteria were excluded from participating in the study: those who had taken dietary supplements containing carotenoids or vitamin A at least once within the last 4 weeks or for more than 1 week within the last 6 months; those with sleep disorders, mental illness or central nervous system abnormalities; and pregnant or lactating women. Throughout the study period, the participants visited the hospital twice at an interval of less than 2 weeks. During the first visit, trained medical personnel collected participant demographic (age and sex) and lifestyle (smoking status and alcohol consumption) information using a questionnaire survey, measured their height and weight, and instructed the participants on how to write a 3-d dietary record. At the second visit, the medical personnel collected 8-h fasting blood for serum carotenoid analysis from the study participants and measured the carotenoid level of the right thumb skin using an RRS device (Samsung Advanced Institute of Technology, Suwon, Korea). In addition, participants submitted a completed 3-d dietary record. Of the 110 volunteers, 108 participants who completed SCS measurement, blood collection and 3-d dietary record were included in the final analysis.
This study was conducted according to the guidelines of the Declaration of Helsinki, and all procedures were approved by the Institutional Review Board of Samsung Medical Center (IRB No. 2019-04-131).
Skin carotenoid status measurement
The RRS device used in this study was designed to measure carotenoid levels in the top layer of the epidermis of fingertips, especially thumb fingertips, which are less affected by sunlight exposure and melanin pigments. The RRS device consisted of a 488-nm laser light source, a high-resolution spectrometer, and an optic Raman probe with a small measurement window (Fig. 1(a)). The entire measurement system was enclosed in a portable box to ensure safe laser use and ease of handling. The laser light used for Raman excitation could only be accessed through the measurement window, where the participants placed their fingertips while wearing eye-protecting goggles. The power of the laser was monitored throughout the measurement period and maintained under a maximum permissible skin energy of approximately 2 mW/mm2.
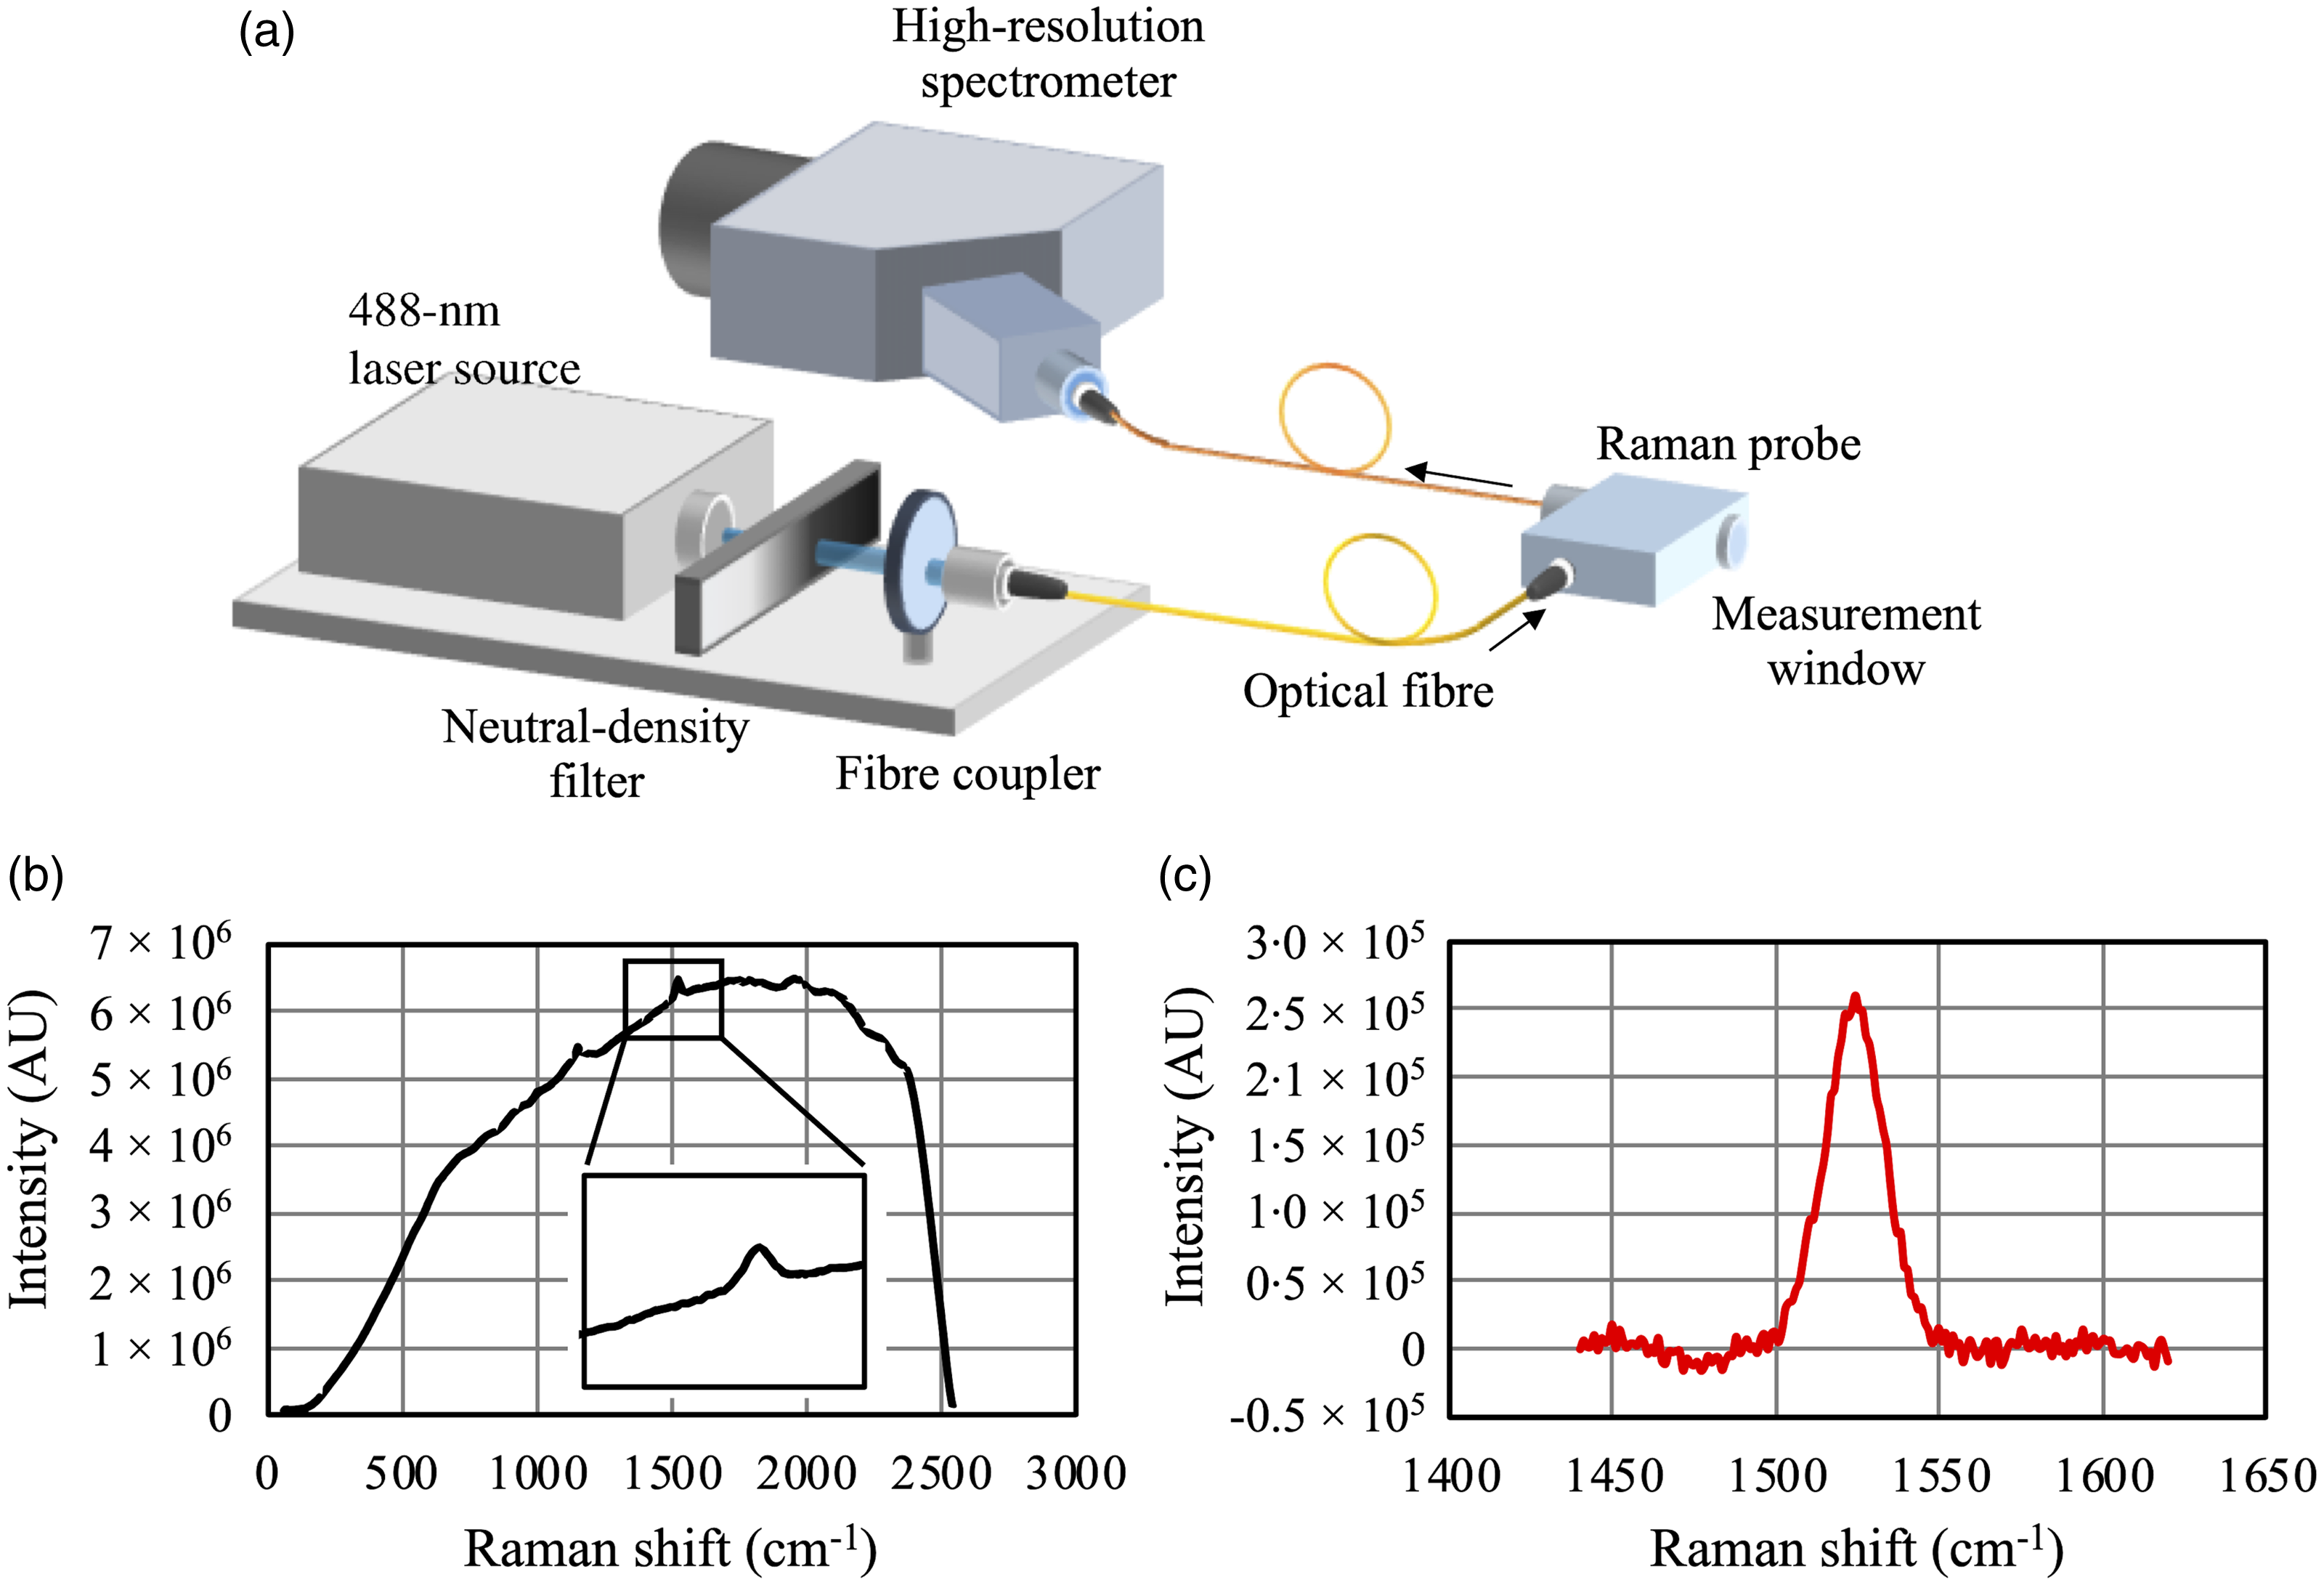
Fig. 1. Schematic diagram of the RRS device used in this study (a); a typical example of the skin Raman spectrum and an inset showing an enlarged area of the carotenoid Raman peak (b); and post-processed Raman spectrum of skin (c). AU, arbitrary unit; RRS, resonance Raman spectroscopy.
Laser light was delivered to the Raman probe via an optical fibre and focused onto the epidermis of the thumb skin. The Raman-scattered light from the skin was then collected through the same probe and fed into the high-resolution spectrometer. The exposure time was adjusted between 300 and 500 ms for each participant, and the spectrum was accumulated for approximately 60 s. The assessed spectrum was recorded and analysed to quantify the SCS.
A typical example of a skin Raman spectrum is shown in Fig. 1(b). A carotenoid Raman peak at 1524 cm−1 can be clearly seen on top of a broad background signal, which corresponds to skin fluorescence originating from skin fluorophores such as NAD, collagen and elastin(Reference Na, Stender and Henriksen19). To accurately calculate the Raman peak intensity, which is directly related to carotenoid levels, we first fitted the background signal with a second-order polynomial function. Thereafter, the post-processed Raman spectrum, shown in Fig. 1(c), was obtained by subtracting the fitted background signal from the original spectrum. Finally, the AUC of the Raman peak was used as a measure of the SCS. Measurements were performed in triplicate, and the average of the measured values was used for the analyses.
Serum carotenoid analysis
Participants’ serum samples were preserved at −80°C after centrifugation with 3200 rpm. Serum aliquots were transferred to the Korea Quality Testing Institute for carotenoid concentration analysis. The concentrations of individual carotenoids, such as lutein, zeaxanthin, α-carotene, β-carotene, α-cryptoxanthin, β-cryptoxanthin and lycopene, present in the serum were quantified with an HPLC device (SHIMADZU LC-20, Shimadzu Corporation) using a YMC Carotenoid C30 column. Each serum sample (200 μl) was treated with n-hexane (600 μl) and centrifuged for 1 min, after vortexing for 30 s to remove proteins. Subsequently, the supernatant liquid was transferred to a microtube and re-extracted with n-hexane. After evaporating the solvent, the residue was reconstituted in 500 μl of EtOH: tert-butyl ether (1:4) for HPLC. The mobile phase involved a mixture of 1·5 % ammonium acetate: methanol (2:98) and tert-butyl ether: methanol: 1·5 % ammonium acetate (90:8:2) at a flow rate of 1 ml/min. Chromatographic separation was performed on the YMC Carotenoid C30 (250 mm length, 4·6 mm id, particle size = 5 μm). The peak identities of carotenoids were confirmed using a photodiode array detector operated at 450 nm with authentic standards, in the order of lutein, zeaxanthin, α-cryptoxanthin, β-cryptoxanthin, α-carotene, β-carotene and lycopene. Total serum carotenoids were calculated as the sum of α-carotene, β-carotene, α-cryptoxanthin, β-cryptoxanthin, lutein, zeaxanthin and lycopene.
Estimation of dietary intakes of carotenoids and fruits and vegetables
Study participants completed 3-d dietary records before the SCS measurement. The staff reviewed and corrected dietary records reported insufficiently or unclearly with participants and coded the dietary data using CAN-Pro 5.0 (The Korean Nutrition Society). F&V intake was calculated as the sum of the F&V weights consumed daily by the participants. Daily carotenoid intake was estimated by combining 3-d dietary record data with a carotenoid database for common Korean foods. The database was constructed based on the Korean food composition table, tables of food functional composition and the US Department of Agriculture national nutrient database for standard reference. Detailed information about the carotenoid database for common Korean foods was previously described(Reference Kim, Jun and Joung20). Total carotenoid intake was calculated as the sum of the intakes of six carotenoid subclasses: α-carotene, β-carotene, lycopene, β-cryptoxanthin, lutein and zeaxanthin. Participants did not take supplements containing carotenoids; thus, carotenoid intake from the supplements was not considered.
Statistical analysis and justification of sample size
The general characteristics of the study participants are presented as mean (standard deviation (sd)) and frequencies (percentages) for continuous and categorical variables, respectively. Differences in SCS, dietary carotenoid intake, F&V intake and serum carotenoid concentrations in participants with different general characteristics (age, sex, BMI, current smoking status, alcohol consumption frequency and physical activity) were examined using the t test or ANOVA. Pearson’s correlation analyses were used to assess the relationship of SCS with dietary carotenoid intake, F&V intake and serum carotenoid concentrations. In addition, in the case of dietary variables significantly correlated with SCS, linear regression analyses were performed to examine the increase in SCS related to dietary intakes. Model 1 was adjusted for age (20–29 or 30–69 years), sex, and BMI (< 23, 23–< 25 or ≥ 25 kg/m2), and model 2 was further adjusted for current smoking status (yes or no) and alcohol consumption frequency (≤ 1 time/month, 2–3 times/month or ≥ 1 time/week). Pearson’s correlation and linear regression analyses were performed using the intake density of carotenoids and F&V, which indicates the intake level per 1000 kcal of energy intake. The Shapiro–Wilk test was used to test the normality of the data. Skewed variables (dietary carotenoid and F&V intakes as well as serum carotenoid concentrations) were log-transformed for the correlation and regression analyses. All statistical analyses were performed using SAS (version 9.4; SAS Institute), and a two-sided value of P < 0·05 was considered statistically significant.
The sample size was calculated using G * Power 3.1 software(Reference Faul, Erdfelder and Buchner21). Based on an effect size obtained from a previous study(Reference Mayne, Cartmel and Scarmo14), a power of 80 % and a two-sided significance level of 0·05, the minimum sample size required to detect a significant correlation between SCS and F&V intake was calculated to be 48.
Results
General characteristics of the participants
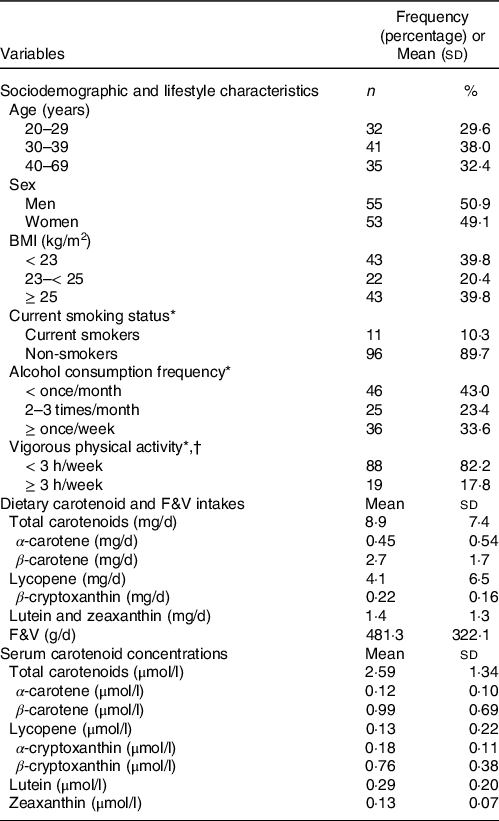
Table 1 presents the general characteristics of the study participants. The eighty participants with an even balance of both sexes had an average age of 41·7 (sd, 14·2) years. The mean BMI was 24·1 (sd, 3·8) kg/m2, and the prevalence of participants with obesity, defined as BMI ≥ 25 kg/m2 according to the obesity criteria for the Korean population(22), was 39·8 %. On average, participants consumed 8·9 (sd, 7·4) mg of total carotenoids and 481·3 (sd, 322·1) g of F&V per d. The mean of the participants’ total serum carotenoid concentrations was 2·59 (sd, 1·34) μmol/l.
Table 1. General characteristics of the study participants
F&V, fruits and vegetables.
* One participant did not answer this question.
† Intense physical activity enough to cause sweating.
Figure 2 shows the SCS distribution of participants, which followed an approximately normal distribution (P = 0·36); the mean SCS was 151·0 (sd, 47·0) arbitrary units (AU).
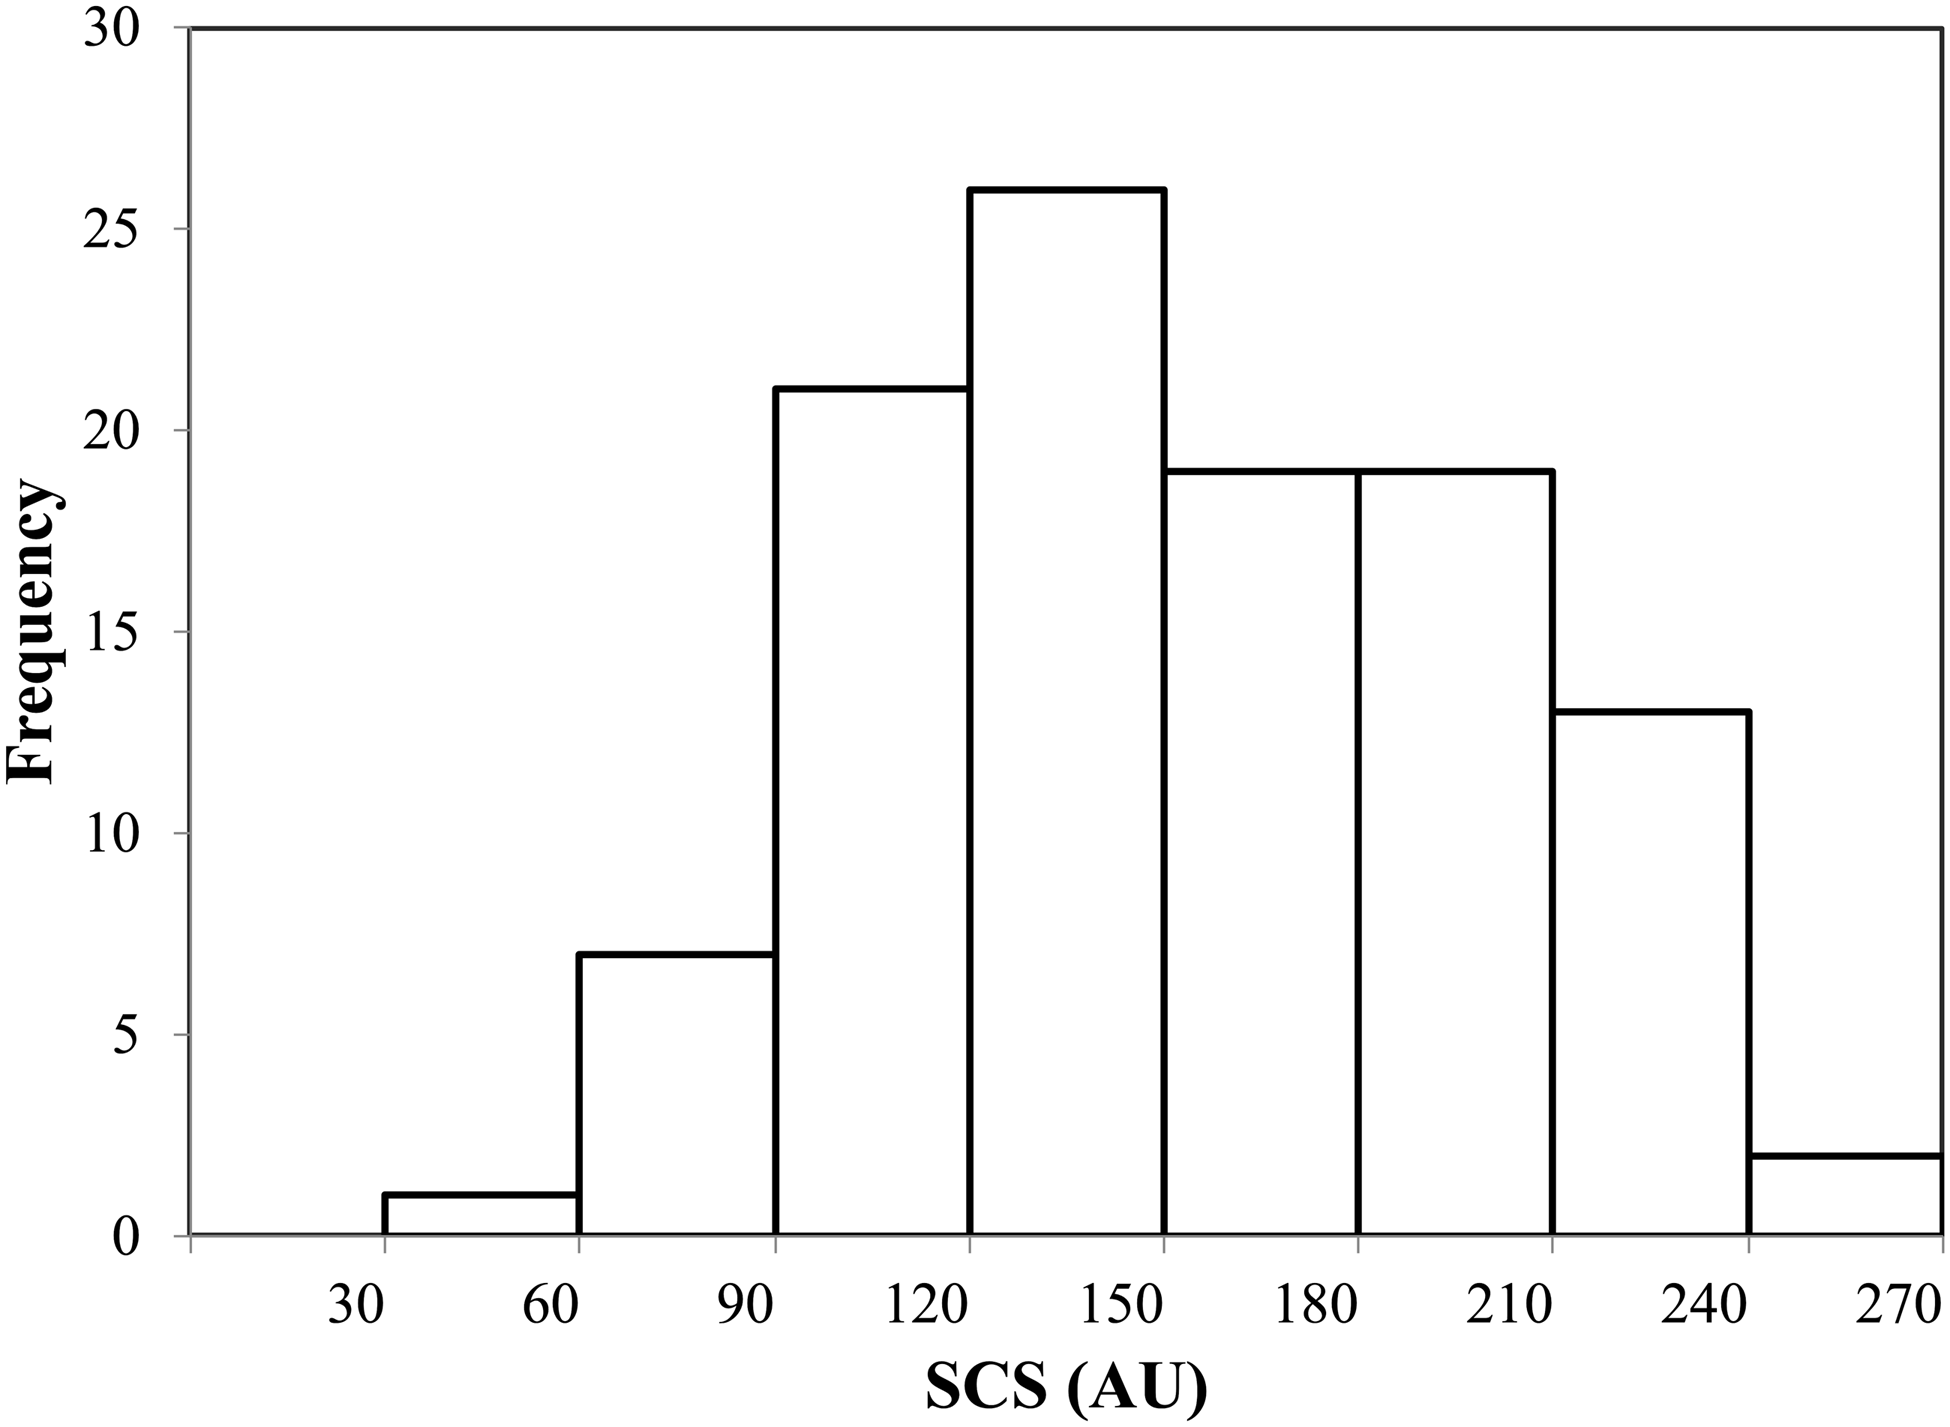
Fig. 2. SCS distribution of study participants. SCS, skin carotenoid status; AU, arbitrary unit. Mean, 151·0; sd, 47·0; minimum, 45·9; 1st quartile, 117·9; median, 149·5; 3rd quartile, 186·8; maximum, 257·5.
Skin carotenoid status based on participants’ general characteristics
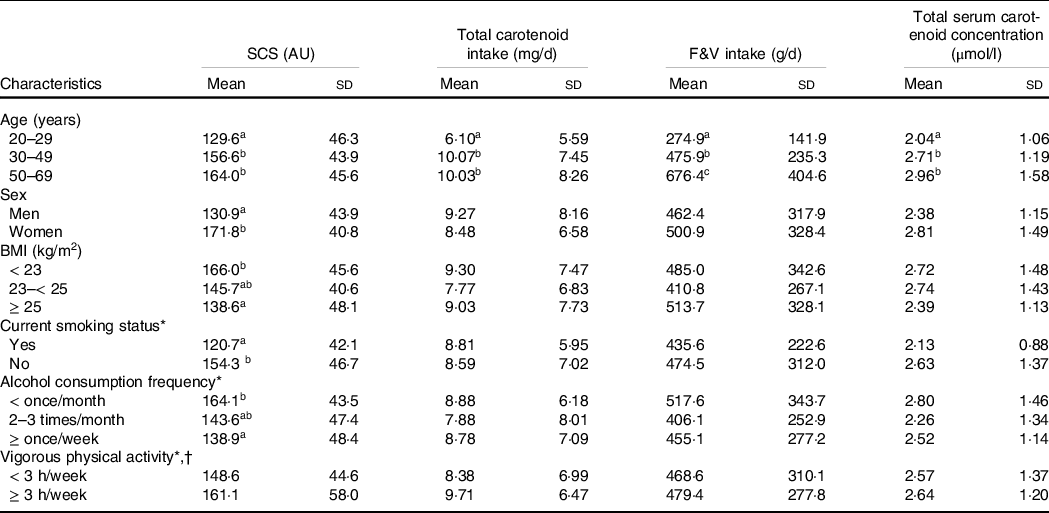
Table 2 shows the means of the SCS, dietary intakes of total carotenoids and F&V, and total serum carotenoid concentration based on participants’ general characteristics. Total carotenoid and F&V intakes and total serum carotenoid concentration were not associated with specific characteristics except age. Participants aged 30 years and older consumed more total carotenoids and F&V than participants aged 20–29 years. They also had higher SCS and total serum carotenoid concentration than younger participants. Although there was no difference in carotenoid and F&V intakes, SCS in women and non-smokers was higher than that in men and current smokers. In addition, SCS tended to decrease as BMI or alcohol consumption frequency increased. There was no significant difference in SCS across physical activity-level categories.
Table 2. Means and standard deviations of SCS, dietary total carotenoid and F&V intakes, and total serum carotenoid concentration based on participants’ general characteristics
SCS, skin carotenoid status; F&V, fruits and vegetables; AU, arbitrary unit.
The between-group differences were examined using the t tests or ANOVA (followed by Duncan tests for post hoc analysis); groups with different superscript letters (a, b and c) were significantly different.
* One participant who did not respond to the questionnaire was excluded from the analysis.
† Intense physical activity enough to cause sweating.
Validation of skin carotenoid status in fruit and vegetable intake estimation
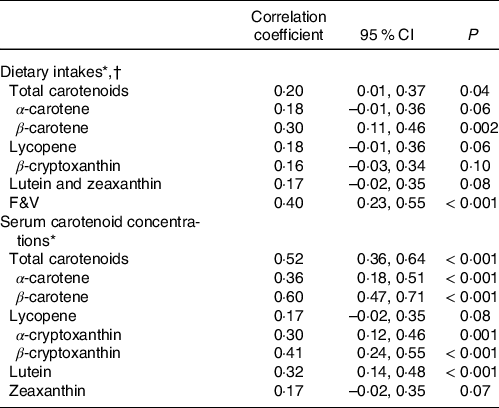
Table 3 presents the correlation between SCS with carotenoid and F&V intakes and serum carotenoid concentrations. There were significant positive correlations between SCS and dietary intakes of total carotenoids (r = 0·20, 95 % CI = 0·01, 0·37), β-carotene (r = 0·30, 95 % CI = 0·11, 0·46) and F&V (r = 0·40, 95 % CI = 0·23, 0·55). In addition, SCS was positively correlated with serum concentrations of total carotenoids (r = 0·52, 95 % CI = 0·36, 0·64), α-carotene (r = 0·36, 95 % CI = 0·18, 0·51), β-carotene (r = 0·60, 95 % CI = 0·47, 0·71), α-cryptoxanthin (r = 0·30, 95 % CI = 0·12, 0·46), β-cryptoxanthin (r = 0·41, 95 % CI = 0·24, 0·55) and lutein (r = 0·32, 95 % CI = 0·14, 0·48).
Table 3. Pearson’s correlation coefficients between SCS with dietary carotenoid and F&V intakes and serum carotenoid concentrations
SCS, skin carotenoid status; F&V, fruits and vegetables.
* Dietary intake and serum carotenoid variables were normalised using a logarithmic function.
† Dietary intakes of carotenoids and F&V were calculated as the intakes per 1000 kcal of energy intake (intake density).
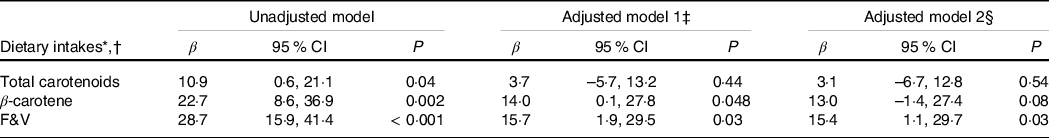
Regression coefficients (β) and 95 % CI obtained from linear regression analyses are shown in Table 4. There was a significant positive association between total carotenoid intake and SCS in the unadjusted model; however, this association was not significant after adjusting for sex, age and BMI. In the case of dietary β-carotene, the positive correlation with SCS was significant in the unadjusted model and model adjusted for sex, age and BMI. However, these correlations were no longer significant after additional adjustments for current smoking status and alcohol consumption frequency. In contrast, there was a consistent positive association of F&V intake with SCS, even after adjusting for possible confounders, such as sex, age, BMI, smoking status and alcohol consumption.
Table 4. Association between SCS and dietary intakes of carotenoids and F&V
SCS, skin carotenoid status; F&V, fruits and vegetables.
Regression coefficients (β), 95 % CI and P-values were analysed using linear regression analyses.
* Dietary intakes of carotenoids and F&V were calculated as the intakes per 1000 kcal of energy intake (intake density).
† Dietary intake variables were normalised using a logarithmic function.
‡ Adjusted for sex (men or women), age (20–29 or 30–69 years) and BMI (< 23, 23–< 25 or ≥ 25 kg/m2).
§ Further adjusted for current smoking status (yes or no) and alcohol consumption frequency (≤ once/month, 2–3 times/month or ≥ once/week). One participant who did not respond to smoking and drinking-related questionnaires was excluded from the analysis.
Discussion
This study was conducted to validate the utility of SCS as a biomarker for F&V intake in Korean adults by examining the relationships of SCS with serum carotenoid concentrations, dietary carotenoid intake and F&V intake. We found significant positive correlations between RRS-assessed SCS and total carotenoid intake, β-carotene intake and F&V intake.
Previous studies have reported positive correlations between RRS-assessed SCS and dietary intakes of F&V and total carotenoids(Reference Mayne, Cartmel and Scarmo14,Reference Toh, Loh and Sutanto23–Reference Bernstein, Sharifzadeh and Liu29) . In addition, SCS evaluated via reflection spectroscopy has been shown to exhibit positive correlations with dietary intakes of F&V and total carotenoids(Reference Jilcott Pitts, Moran and Wu15,Reference Jilcott Pitts, Jahns and Wu18,Reference Jahns, Johnson and Conrad24,Reference Keller, Taylor and Smith30–Reference Ashton, Pezdirc and Hutchesson34) . Our study findings were in line with those of previous studies, although the results cannot be directly compared due to differences in the SCS measurement devices utilised, participant characteristics, dietary survey methods and statistical analyses. Nonetheless, our results may imply that the RRS-assessed SCS of Korean adults could be used as a biomarker of carotenoid and F&V intake.
The participants in this study consumed carotenoids mainly through lycopene and β-carotene. Of the two, only β-carotene intake was positively correlated with SCS. When measuring correlations between SCS and serum carotenoid concentrations, β-carotene concentration positively correlated with SCS, but lycopene concentration did not. Differing correlation coefficients for each carotenoid were also found in previous studies; β-carotene, which accounts for the majority of carotenoid intake and blood carotenoid concentration, had high correlation coefficients with SCS, but lycopene showed weak or insignificant correlations with SCS(Reference Mayne, Cartmel and Scarmo14,Reference Matsumoto, Suganuma and Shimizu17,Reference Janse van Rensburg and Wenhold27,Reference Hayashi, Sato and Suganuma35) . This is because the RRS devices used in this and previous studies are optimised for the absorption wavelength of β-carotene (488 nm), making it difficult to measure lycopene with an absorption wavelength of 514 nm(Reference Janse van Rensburg and Wenhold27). Therefore, it should be noted that the RRS device used in this study may have difficulty in accurately measuring lycopene intake.
Blood carotenoid concentration is known as the gold standard for estimating F&V intake(12). In this study, total serum carotenoid concentration had a 0·38 (95 % CI = 0·21, 0·53, P < 0·001) correlation coefficient with F&V intake, which was similar to that of SCS (r = 0·40, 95 % CI = 0·23, 0·55, P < 0·001). In addition, a recent meta-analysis reported a 0·68 (95 % CI = 0·61, 0·74, P < 0·01) of an overall correlation coefficient between RRS-assessed SCS and plasma/serum carotenoid concentrations(Reference Jilcott Pitts, Johnson and Wu36). Although the correlation between SCS and total serum carotenoid concentration observed in our study was slightly weaker than that estimated in the meta-analysis, it still retained statistical significance. These results indicate that the SCS can be used preferentially over serum carotenoid concentrations to estimate carotenoid-rich F&V intake.
An accurate estimation of F&V intake using the SCS requires an identification of factors affecting the SCS. Therefore, we also examined the differences in SCS based on the general characteristics of the study participants. Consequently, the SCS of participants was different according to age, sex, BMI, current smoking status and alcohol consumption frequency.
Although there was no significant difference in the intake of carotenoids or F&V across BMI strata, participants with obesity had significantly lower SCS than those with normal or underweight. The inverse relationship between BMI and SCS observed in this study is consistent with that found in previous studies(Reference Matsumoto, Suganuma and Shimizu17,Reference Toh, Loh and Sutanto23,Reference Nguyen, Scherr and Linnell28,Reference Keller, Taylor and Smith30,Reference Scarmo, Henebery and Peracchio37–Reference Perrone, Pintaudi and Traina40) . Like skin, adipose tissue acts as a reservoir of carotenoids. Hence, those with obesity may have a relatively low proportion of carotenoids stored in the skin, since adipose tissue takes up carotenoids that could have been stored in the skin(Reference Mayne, Cartmel and Scarmo41,Reference Andersen, Jacobs and Gross42) . In addition, inflammatory cytokines synthesised and secreted by adipocytes can lower the levels of antioxidants, including carotenoids, by triggering oxidative stress and chronic inflammation(Reference Sikaris43,Reference Fonseca-Alaniz, Takada and Alonso-Vale44) .
In the current study, SCS and serum β-carotene concentration were significantly lower in current smokers than in non-smokers despite the lack of a significant difference in carotenoid or F&V intake between the two groups (β-carotene concentration: 0·69 (sd, 0·28) μmol/l for current smokers, 1·02 (sd, 0·71) μmol/l for non-smokers, P for difference = 0·007). Previous studies have shown that smoking is associated with decreased SCS and blood carotenoid concentrations(Reference Toh, Loh and Sutanto23,Reference Meinke, Lauer and Taskoparan39,Reference Ermakov, Ermakova and Sharifzadeh45–Reference Marhuenda-Muñoz, Hurtado-Barroso and Tresserra-Rimbau47) , likely because cigarette smoking induces reactive oxygen species production and inflammatory cytokine secretion(Reference Csiszar, Podlutsky and Wolin48). Smoking-induced oxidative stress can deplete antioxidants, resulting in lower carotenoid levels in cigarette smokers.
Alcohol consumption is associated with increased levels of oxidative stress-related indicators, as ethanol metabolism produces free radicals, which indirectly impair the antioxidant system(Reference Zima, Fialová and Mestek49,Reference Lecomte, Herbeth and Pirollet50) . In the present study, participants who drank alcohol at least once a week had lower SCS than those who rarely drank alcohol. However, results from the few available studies on the relationship between alcohol use and SCS are inconsistent. A previous study conducted on adults in the USA reported no significant association between current drinking status and SCS(Reference Mayne, Cartmel and Scarmo14). Thus, further research is required to clarify the nature of this relationship.
In the present study, women had higher SCS and serum β-carotene concentration, although there was no significant difference in carotenoid or F&V intake between sexes (β-carotene concentration: 1·17 (sd, 0·81) μmol/l for women, 0·82 (sd, 0·49) μmol/l for men, P for difference = 0·009). Previous studies have either reported higher SCS in women(Reference Matsumoto, Suganuma and Shimizu17,Reference Toh, Loh and Sutanto23,Reference Meinke, Lauer and Taskoparan39,Reference Ermakov, Ermakova and Sharifzadeh45) or no significant difference in SCS between sexes(Reference Mayne, Cartmel and Scarmo14,Reference Nagao-Sato, Baltaci and Peralta Reyes33,Reference Scarmo, Henebery and Peracchio37,Reference Aguilar, Wengreen and Lefevre51,Reference Martinelli, Acciai and Tasevska52) . The higher SCS and serum β-carotene concentrations in women in this study were probably because women had lower smoking rates (0 % for women, 20·4 % for men, P for difference < 0·001) and BMI (22·1 (sd, 2·8) kg/m2 for women, 25·9 (sd, 3·6) kg/m2 for men, P for difference < 0·001) than men. Another possible explanation is the difference in stature between men and women. Although the dietary reference intake for carotenoids has not been established, nutrient requirements are generally higher in men with larger body sizes than in women. In this study, women had smaller body sizes than men; however, the dietary intake of carotenoids or F&V did not differ significantly between them. Thus, the amount of carotenoids stored in a fixed area of skin may be higher in women than in men.
Several studies have investigated the effects of age on SCS. A study conducted in New Zealand reported that SCS was significantly higher in people aged over 40 years than in those under 40 years(Reference Rush, Amoah and Diep38). However, many other studies reported no significant age-related differences in SCS(Reference Mayne, Cartmel and Scarmo14,Reference Toh, Loh and Sutanto23,Reference Keller, Taylor and Smith30,Reference Hill, Paschall and O’Brien32,Reference Meinke, Lauer and Taskoparan39,Reference Ermakov, Ermakova and Sharifzadeh45,Reference Aguilar, Wengreen and Lefevre51,Reference Martinelli, Acciai and Tasevska52) . In this study, participants aged 30–69 years consumed more total carotenoids and F&V and hence had a higher SCS than those aged 20–29 years.
To the best of our knowledge, this is the first study to provide evidence for the utility of SCS as a biomarker of F&V intake in Korean adults by examining the correlations of SCS with dietary carotenoid intake, F&V intake and blood carotenoid concentrations. However, this study has a few limitations. First, study participants were not representative of all Korean adults because they were recruited from a metropolitan area. Second, the carotenoid database used in this study covered 92·3 % of the foods consumed by the participants, and therefore the carotenoid intakes of the participants were likely underestimated. Lastly, our findings should be interpreted with caution, as we did not investigate several possible confounders of the association between F&V intake and SCS or serum carotenoid concentrations, such as sun exposure, dermal melanin levels, oxidative stress levels, blood lipid profiles, menstrual cycle, medication use and presence of chronic diseases. Thus, further studies are required to confirm the utility of SCS in evaluating F&V intake in large populations with diverse characteristics. Specifically, large-scale studies with diverse SCS and F&V intake sufficient to approximate a more normal distribution are needed to identify the exact dose–response relationship between F&V intake and SCS. In addition, diet intervention studies are necessary to characterise SCS changes concomitant with changes in dietary carotenoid or F&V intake.
In conclusion, SCS, which can be measured in a fast and non-invasive manner, is a potential biomarker for F&V intake. Moreover, SCS can be used to estimate participants’ F&V intake in large-scale epidemiological research and health promotion programmes.
Acknowledgements
The authors thank all the participants and the staff of Samsung Medical Center.
This research was funded by the Samsung Advanced Institute of Technology (SAIT). Researchers at SAIT participated in study design, project administration, data acquisition, analysis and manuscript writing.
S. A. (Seoeun Ahn) designed the study, performed statistical analyses, interpreted data and drafted the manuscript. S. A. (Sungmo Ahn) conceptualised and designed the study, analysed the data and drafted the manuscript. H. J. (Hyeongseok Jang) participated in the study design, acquisition of data and draft writing. K. E. participated in the methodology design, data analysis and draft writing. Y. J. K. and J-E. H. participated in data curation and analysis. J. I. C. investigated clinical study and methodology. J-Y. P. conceptualised and designed the study, administrated the project and reviewed the manuscript. Y-H. C. designed the clinical methodology, supervised the clinical study and reviewed the manuscript. S. N. designed the study and administrated the project. H. J. (Hyojee Joung) designed the study, supervised the study and revised the manuscript. All authors approved the final version of the manuscript.
There are no conflicts of interest.


