There is a growing concern regarding the global increase in chronic non-communicable diseases related to diet and sedentary lifestyle. There has notably been a large increase in the incidence of obesity over the recent decades, particularly in children(Reference Wang and Lobstein1). Although it is well recognised that overweight results from an imbalance between energy intake and energy expenditure, the relationship between overweight and nutrient or dietary intake in children remains unclear(Reference Newby2). Shifts in dietary habits over recent decades include an increase in snacking(Reference Jahns, Siega-Riz and Popkin3, Reference Zizza, Siega-Riz and Popkin4), more widespread ‘away-from-home’ consumption(Reference Nielsen, Siega-Riz and Popkin5, Reference Guthrie, Lin and Frazao6) and larger portion sizes with an increasingly energy-dense content(Reference Nielsen and Popkin7–Reference Kant and Graubard9). In response to these trends, the WHO and FAO set up an expert consultation on Diet, Nutrition and Prevention of Chronic Diseases in 2003(10). The resulting report focused on the importance of a balanced diet and proposed nutritional and dietary recommendations aimed at the overall population.
Thus, monitoring national trends in food consumption may help to identify eating behaviours and food choices potentially associated with chronic diseases. The evaluation of a population's dietary intake and nutritional status is important to adjust public health policies aimed at improving dietary habits. Dietary surveillance programmes have been implemented in industrialised countries, notably in Europe(Reference Serra-Majem, Ribas Barba and Salvador Castell11–Reference Hulshof, Brussaard and Kruizinga14). They have mostly been based on the repetition of cross-sectional surveys among adults. A trend towards a westernisation of the diet has been described, including the southern European countries, although traditionally characterised by the rather healthy ‘Mediterranean diet’(Reference Slimani, Fahey and Welch15–Reference Schmidhuber and Traill17).
Recent data monitoring the dietary habits of European children, based on national surveys carried out with the same methodology, and taking into account not only the percentage of subjects consuming each food group but also the amount eaten, are scarce(Reference Newby2, Reference Lambert, Agostoni and Elmadfa18). In a recent study comparing the first and second French INCA dietary surveys (études Individuelles Nationales des Consommations Alimentaires), we observed a decrease in energy intake in children aged 3–14 years between 1999 and 2007, while overweight prevalence remained stable(Reference Lioret, Touvier and Dubuisson19). In the present paper, we have further explored the trends of food intake. We used data from the recent French dietary survey INCA2 (2006–7) to: (1) assess food intake by food groups in children aged 3–17 years and (2) analyse trends since the previous INCA1 survey, performed in 1998–9. To our knowledge, this is the first time in France that such a national dietary survey has been repeated, enabling us to compare information for a wide age range of children between two different points in time.
Research methods and procedures
Subjects and study design
The French INCA2 food consumption survey was carried out between December 2005 and May 2007 by the French Food Safety Agency (Afssa). This cross-sectional survey was primarily designed to assess food intake patterns in a nationally representative sample of French people. Two independent random samples of children aged between 3 and 17 years and adults aged between 18 and 79 years were obtained using a multistage cluster sampling technique. The sampling frame was established from the national census published by INSEE (l'Institut National de la Statistique et des Études Économiques; French National Institute of Statistics and of Economic Studies) and has been described elsewhere(Reference Dufour, Lafay, Volatier, Guilbert, Haziza, Ruiz-Gazen and Tillé20). Briefly, the first step consisted of the random selection of 181 primary geographical units, stratified by region of residence and agglomeration size, with probability proportional to size. Two independent sampling frames were drawn in the selected primary units: the first contained only households with at least one child and the second included households with or without children. Households were then randomly and uniformly selected within each sampling frame. Lastly, either a child or an adult was randomly selected within each household.
Information letters were sent to the households. This was followed by a phone call when the telephone number was available (36 % for the child database). During this phone call, additional information about the study was given; the eligible person (either child or adult) was selected and asked to give his/her oral consent. If consent was given, an appointment was made for a meeting at home. If no telephone number was available, or if twelve successive telephone calls failed to reach anyone, trained investigators went directly to the households to establish face-to-face contact (up to four attempts on different days and at different times). A participation rate of 69 % was obtained for children, yielding a sample of 1455 children.
The French INCA1 food consumption survey was performed between August 1998 and June 1999 by the Research Centre for the Study and the Observation of Way of Life (CREDOC) and the French Food Safety Agency (Afssa). The survey design and sampling frame are described in more detail elsewhere(Reference Lioret, Touvier and Lafay21, Reference Volatier22). A complex sampling design was used to obtain a nationally representative sample of French households. Briefly, two independent samples, composed of 1985 adolescents and adults (aged 15 years and over) and of 1016 children (aged 3–14 years), were made representative of the French population diversity through stratification (region of residence, agglomeration size) and use of the quota method (age, sex, household size, head of household socio-professional status)(Reference Deville23). Age, sex and the occupational category of the head of household showed a satisfactory match with data obtained from the national census. Documents (food records and questionnaires) were completed by 56 % of eligible children.
Children's characteristics of the INCA1 and INCA2 samples are shown in Table 1.
Table 1 General characteristics of the INCA1 (1998–99) and INCA2 (2006–07) samples
(Percentages and 95 % confidence intervals)

INCA, étude Individuelle Nationale des Consommations Alimentaires.
Within age group, value was significantly different from that for the INCA1 survey: * P ≤ 0·05, ** P ≤ 0·01, *** P ≤ 0·001.
† Including children and adults.
‡ Educational level of the responding parent. ‘High’ was assigned to university education (undergraduate and postgraduate), ‘intermediate’ to the equivalent of ‘O’ level, and ‘low’ to the mid-secondary level or under. In 80·3 % of the cases, this person was the mother, in other cases it was the father, and more rarely another person of the family. This variable was only available in the INCA2 dataset.
Measurements
In both the INCA1 and INCA2 surveys, dietary intake was assessed using a 7 d open-ended food record. A trained and certified investigator delivered the food record to the home and spent 45–60 min explaining to the parents and their child how to fill it out. For children aged 10 years or younger, their parents completed the document, with the help of the child. The investigator returned to the home immediately following the week that the survey was conducted to check the accuracy of the information reported in the document.
An additional face-to-face questionnaire, including questions on socio-economic status and lifestyle, was conducted, partly with the child selected and partly with the responding parent. At this stage of the INCA2 survey, trained interviewers weighed the child in light clothes and without shoes to the nearest 0·1 kg using electronic scales (Terraillon, Paris, France). Height was measured to the nearest 1 cm, in a standing position and without shoes, with a portable gauge. For the INCA1 survey, weight and height were self-reported.
Dietary data
In the 7 d open-ended food record, subjects reported the type of eating occasion at which each food or drink was consumed, i.e. meals and snacks. ‘Snacks’ were defined as other eating episodes apart from breakfast and main meals (i.e. lunch and dinner). One line of the record corresponded to one item consumed (food or drink). Participants estimated portion sizes either using the SUpplémentation en VItamines et en Minéraux AntioXydants (Su.Vi.MAX) photographic booklet(Reference Hercberg, Deheeger and Preziosi24) or expressing them by weight or household measures.
Food and drink from the INCA2 dataset were separated into thirty-nine categories according to the origin of the product (see Appendix). For each food group, we assessed the percentage of subjects consuming the selected foodstuff over the week of the survey along with the average dietary intake (expressed in g/d). Trends in dietary intake were then estimated by food categories using a common nomenclature for food and drinks between the two datasets (INCA1 and INCA2). Nutritional intake was evaluated using the French CIQUAL (Centre d'Information sur la Qualité des Aliments) food composition tables(Reference Favier, Ireland and Toque25, Reference Ireland, du Chaffaut and Oseredczuk26).
Educational level of the responding parent
In the INCA2 survey, the socio-economic status of the children was determined based on the educational level of the parent who helped to answer the questionnaires. This person was the mother in 80·3 % of cases and the father in 18·1 % of cases. The level of education was defined in three categories: ‘high’, ‘intermediate’ and ‘low’. ‘High’ was assigned to those with a university education (undergraduate and postgraduate); ‘intermediate’ to those having passed the mid-secondary school degree (equivalent to ‘O’ level or general certificate of secondary education (GCSE)); and ‘low’ to the others.
Regional gradients
Twenty-one regions were identified based on the INCA2 dataset. However, due to statistical constraints, only comparisons between the North and South were feasible. The regional area of Paris was excluded from the statistical comparison, due to its relatively high heterogeneity in terms of dietary patterns.
Seasonal variables
Four seasonal periods were considered: winter (January to March), spring (April to June), summer (July to September) and autumn (October to December).
Overweight status
Overweight (including obesity) was estimated according to the International Obesity Task Force (IOTF) age- and sex-specific child BMI (weight/height2, in kg/m2) cut-off points(Reference Cole, Bellizzi and Flegal27).
Both the INCA1 and INCA2 surveys were approved by the French National Commission for Computed Data and Individual Freedom (Commission Nationale Informatique et Libertés; CNIL).
Statistical analysis
We estimated dietary intake by food groups according to sex, age (3–10, 11–14 and 15–17 years), regional area (North, South and Paris region), season, and the educational level of the responding parent. Dietary trends (expressed both as percentage of subjects consuming the food group and quantitative intake) between the two surveys were estimated using the formula: (INCA2 value − INCA1 value)/INCA1 value, expressed in %. In order to remove implausible values for energy intake, the analyses on dietary intake excluded nine children from the INCA1 dataset and eleven from the INCA2 sample whose log-transformed value of energy intake was < mean − 3 sd within four age groups (3–5, 6–10, 11–14 and 15–17 years). They were considered outliers. However, we included in the analyses the implausible reporters identified according to Goldberg's(Reference Goldberg, Black and Jebb28) cut-offs for under-reporting adapted for use in children(Reference Torun, Davies and Livingstone29, Reference Sichert-Hellert, Kersting and Schoch30).
Analyses were computed using SAS (version 9.1; SAS Institute, Inc., Cary, NC, USA) and STATA (release 10; StataCorp LP, College Station, TX, USA) software. Statistical inferences were based on a significance level of 5 % with two-sided tests. Means were compared using Student's t tests and χ2 tests were used to compare frequencies. INCA2 data were weighted for unequal sampling probabilities and for differential non-responses between region, agglomeration size, age, sex, occupation of the head of household, size of the household and season. It should be noted that trends for sweetened beverage and fat consumption were not assessed, because the methodology to record these particular foodstuffs improved during the INCA2 survey.
Results
Characteristics of study populations
General characteristics of the INCA1 and INCA2 samples are listed in Table 1. Overweight rates were not significantly different between the two surveys, whereas energy intake was lower in the INCA2 study than in the INCA1 study for children aged between 3 and 14 years, as previously reported(Reference Lioret, Touvier and Dubuisson19). The distribution of the children according to the educational level of the responding parent was analysed for the INCA2 dataset only, this variable not being available in the earlier study.
Dietary intake by food group in 2006–7
The overall consumption for children aged 3–17 years was about 1760 g/d (Table 2), and was evenly composed of foods and drinks. The groups contributing the most to solid intake (accounting for over 5 % of food consumed) were vegetables (9·1 %), chilled dairy products (8·8 %), fruit (8·0 %), sweetened pastries and biscuits (7·7 %), mixed dishes (6·8 %), bread and crispbreads (6·5 %), and potatoes (6·1 %). The groups contributing the most to liquid intake were water (54·0 %), cold sweetened beverages (21·8 %), and milk (19·7 %) (results not shown). Higher percentages of consumers (>80 %) were observed for the following food groups: bread and crispbreads, pasta, sweetened pastries and biscuits, all dairy products, butter, red meat, meat products, vegetables, potatoes and related products, fruit, sugar and confectionery, water, cold sweetened beverages, and mixed dishes (Table 2). Lower rates ( < 20 %) were observed for offal, crustaceans and molluscs, dried fruit and oleaginous seeds, alcohol, and coffee.
Table 2 Dietary intake (g/d) by sex and age in the INCA2 study (2006–7) estimated for all subjects (including non-consumers)
(Percentage consumers, mean values, standard deviations and medians)

INCA, étude Individuelle Nationale des Consommations Alimentaires.
* P ≤ 0·05, ** P ≤ 0·01, *** P ≤ 0·001.
† Percentages and means were compared between boys and girls.
‡ Overall, 73·3 % of the children aged 3–17 years consumed fruit juices (freshly squeezed or concentrated), with average amounts of 84 (sd 100·5, median 51·4) g/d, and 76·8 % consumed other cold drinks (cordials, fruit drinks, sweetened and carbonated beverages), with an average consumption level of 111·2 (sd 155·5, median 57·1) g/d.
§ Alcohol includes not only alcoholic drinks but also alcohol used for home cooking or in industrial recipes.
Intake was higher with age for most of the groups, with the exception of milk, chilled dairy products and mashed fruit, whose consumption was lower among the 15- to 17-year-old children (Table 2). The consumption of other foods did not differ significantly with age: breakfast cereals, sweetened pastries and biscuits, ice cream and frozen desserts, sugar and confectionery, cream desserts and milk jellies, fish, fruit and soups. However, the intake was much higher in adolescents aged 15–17 years for savoury snacks (mainly sandwiches and hamburgers), coffee and alcohol. Other results (not shown) suggested that in this particular age group, eating behaviours were less structured than in the other age groups (younger children and adults). For instance, the consumption of main meals was less regular amongst the 15–17 years(31): between 61 and 86 % of children or adults of all other age categories, but only 34 % of 15- to 17-year-olds, had all three main meals every day (breakfast, lunch and dinner).
Boys had a higher intake than girls, overall and for most food groups considered; this difference was most pronounced from 11 years old (Table 2). The most marked differences were for bread, breakfast cereals, pasta, sweetened pastries and biscuits, milk, chilled dairy products, meat, poultry and game, meat products, pulses, water, savoury snacks, cream desserts and milk jellies.
Regional differences were observed between the North and South of France (Table 3). Intake was higher in the South for vegetable oil, vegetables, pulses, fruit, dried fruit and oleaginous seeds, soups, eggs, meat, poultry and game, and water. Conversely, intake was higher in the North for sweetened pastries and biscuits, margarine, chocolate, cold sweetened beverages, and hot drinks.
Table 3 Dietary intake (g/d) according to regional area, season and educational level of the responding parent in the INCA2 study (2006–07)
(Mean values and standard deviations)

INCA, étude Individuelle Nationale des Consommations Alimentaires.
* P ≤ 0·05, ** P ≤ 0·01, *** P ≤ 0·001.
† Winter (January, February, March), spring (April, May, June), summer (July, August, September), autumn (October, November, December).
‡ Educational level of the responding parent. ‘High’ was assigned to university education (undergraduate and postgraduate), ‘intermediate’ to the equivalent of ‘O’ level, and ‘low’ to the mid-secondary level or under. In 80·3 % of the cases, this person was the mother, in other cases it was the father, and more rarely another person of the family.
§ Means are compared between North and South.
∥ Means are compared between seasons.
¶ Means are compared according to the educational level of the responding parent.
Regarding seasonal variations, the amounts of fruit and vegetables, ice cream and frozen desserts, and water consumed were higher in the spring and summer (Table 3). The consumption of bread, crustaceans and molluscs, pulses, dried fruit and oleaginous seeds, mixed dishes, soups and hot drinks was higher during autumn and winter. Sweetened pastries and chilled dairy products were preferentially eaten during winter and summer.
A significant positive association between dietary intake and the educational level of the responding parent was observed for the following groups (Table 3): chilled dairy products, cheese, vegetables and fruit, mashed and cooked fruit, sweetened pastries and biscuits, ice cream and frozen desserts, vegetable oil, and water. Conversely, children with a parent of low level of education had higher intakes of starchy foods such as pasta and rice, meat products, savoury snacks such as sandwiches and hamburgers, mixed dishes, sugar and confectionery, and hot drinks.
Trends observed between the INCA1 (1998–9) and the INCA2 (2006–7) surveys
Starchy foods
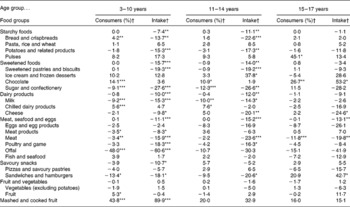
The overall amount of starchy foods consumed decreased during this 8-year period, by 7·4 and 11·1 % among children aged 3–10 years and 11–14 years, respectively (Table 4). The subgroups involved in this trend are bread and crispbreads and potatoes. We did not observe any significant trends over this period for adolescents aged 15–17 years.
Table 4 Trends (%) in dietary intake (percentage of subjects consuming the food group and quantitative intake) according to age between the INCA1 (1998–99) and INCA2 (2006–07) surveys

INCA, étude Individuelle Nationale des Consommations Alimentaires.
Dietary trend between the two surveys was significant: * P ≤ 0·05, ** P ≤ 0·01, *** P ≤ 0·001.
† Dietary trends (percentage of subjects consuming the food group and quantitative intake) between the two surveys were estimated using the formula: (INCA2 value − INCA1 value)/INCA1 value, expressed in %.
Sweetened foods
The overall amount of sweetened foods consumed decreased by 15 % for children aged 3–14 years. Sweetened pastries and biscuits are the main food groups concerned, showing a significant drop in their absolute intake over 8 years (Table 4). Consumption of sugar and confectionery also decreased, but to a lesser extent. Sweetened food intake, for all subgroups considered together, was stable for adolescents aged between 15 and 17 years, despite the same trend being observed for sugar and confectionery. This decrease in the consumption of sugar and confectionery was counterbalanced by a significant increase in the consumption of chocolate, along with a non-significant trend towards a higher consumption of ice cream.
Dairy products
The overall intake of dairy products declined between 1999 and 2007 by about 11 % in children aged 3–14 years (Table 4). The marked decrease of milk consumption (in absolute and relative terms) is mainly responsible for this trend. The decline in cheese consumption is also involved. In adolescents aged 15–17 years, despite a decline in cheese consumption, the overall intake of dairy products remained stable during this period.
Meat, seafood and eggs
For all age categories, the overall intake of these foods significantly decreased over the 8-year period (between 11·1 and 15·2 %) (Table 4). Decreased meat consumption is the main factor accounting for this trend, for all age groups, with poultry and game also accounting for a substantial reduction in this food group for children aged between 3 and 14 years.
Fruit and vegetables
The consumption of fruit and vegetables, taken together or separately, remained stable between 1999 and 2007 (Table 4). However, the intake of mashed and cooked fruit increased substantially in the youngest age group.
Savoury snacks
Trends in the consumption of this particular food group differed with age. In children aged 3–10 years, the consumption of savoury snacks declined over 8 years by 10·7 %, mainly due to decreased consumption of sandwiches and hamburgers (Table 4). The consumption of sandwiches and hamburgers also decreased by 20·6 % in adolescents aged 11–14 years, but their overall consumption of savoury snacks remained stable over the period. Of particular note, the consumption of sandwiches and hamburgers increased markedly in adolescents aged 15–17 years, despite a decrease overall in the consumption of pizzas and savoury pastries.
Discussion
The present study provides insight into the dietary intake of French children aged 3–17 years, which has rarely been undertaken before using observational data collected at the individual level.
Main findings for dietary intake in 2006–7
Variation in the foods eaten by age
The decline of dairy product consumption during growth (particularly milk) is a common result, contributing to a concomitant decrease in the proportion of energy intake accounted for by sugars(Reference Lambert, Agostoni and Elmadfa18). The intakes of other food groups, which were not expected to be higher in adolescents aged 15–17 years, were stable with age: these are foods more traditionally eaten by children, such as breakfast cereals, sweetened pastries and biscuits, sugar and confectionery. However, other foods not specific to young children – fish, fruit, cheese, and soups – did not differ according to age either. Conversely, the older adolescents (15–17 years) consumed energy-dense and less nutrient-dense foods (such as savoury snacks and cold sweetened beverages) in larger quantities. Coffee and alcohol consumption also rose sharply at this stage of life, which in addition was characterised by relatively less structured eating behaviours. These results reflect the fact that adolescence corresponds to a turning point between childhood and adulthood, which is accompanied by growing independence from parents, along with more personal food choices. These choices of food are not necessarily healthy and thus more attention should be given to this particular period of life, which seems particularly vulnerable(Reference Dietz32).
Variation in the foods eaten by geographical region and season
Our findings showed some geographical and seasonal differences in the dietary patterns of French children. Despite the globalisation of dietary patterns, the higher consumption of vegetable oil, pulses, fruit and vegetables in the Southern part of Europe has already been described in previous studies, mostly conducted amongst adults(Reference Slimani, Fahey and Welch15, Reference Balanza, Garcia-Lorda and Perez-Rodrigo16). Similarly, a higher level of consumption of sweetened pastries, margarine, sweets, cold sweetened beverages, and hot drinks has been observed in Northern European countries. Most of the geographical differences observed for French children have also been found in adults from the same dataset(31). In particular, this was notably the case for the North–South gradient observed for vegetable fats, foods of plant origin (potatoes, vegetables, and soups), sweetened pastries and biscuits, and hot drinks. It should be noted that France is located between Southern and Northern Europe, with traditional regional dietary habits that can be tracked over time, despite the trend towards a global homogenisation of the diet(Reference Slimani, Fahey and Welch15, Reference Schmidhuber and Traill17, Reference Kesse, Boutron-Ruault and Clavel-Chapelon33). Our findings also show that food and drink choices are still largely influenced by seasonal availability and climate. It is noteworthy that the higher consumption of fruit and vegetables, ice cream and water during spring and summer, as well as the higher intake of bread, crustaceans and molluscs, pulses, dried fruit and oleaginous seeds, mixed dishes, soups and hot drinks during autumn and winter, are seasonal patterns similar to those observed in adults(31).
Variation in the foods eaten by education level of the responding parent
The higher consumption of nutrient-dense and low energy-dense foods among groups of a high educational level and, conversely, the intake of nutrient-poor and energy-dense foods in the lowest socio-economic groups have been previously reported in other studies undertaken in industrialised countries(Reference Darmon and Drewnowski34). More specifically, in children, studies carried out in the USA have found a positive relationship between consumption of fruit and vegetables and the socio-economic status of the household(Reference Xie, Gilliland and Li35–Reference Cullen, Ash and Warneke37). Conversely, higher consumption of sweetened beverages was observed amongst the families with a low level of education(Reference Cullen, Ash and Warneke37). Similar results have been described for European countries(Reference Serra-Majem, Ribas and Perez-Rodrigo38–Reference Vereecken, Inchley and Subramanian41). In our previous studies based on the first INCA survey, we found that socio-economic status was positively associated with a pattern of food consumption characterised by a high consumption of dairy products, fruit and vegetables and water, and negatively associated with another pattern partly characterised by a high intake of mixed dishes, savoury snacks such as sandwiches, sugar and confectionery, and soft drinks(Reference Lioret, Touvier and Lafay21). It has been suggested that the level of education of the parents is likely to influence literacy, knowledge on nutrition, and health-related behaviour(Reference Sobal42). Other studies have shown that energy-dense and nutrient-poor diets have a lower cost per MJ(Reference Andrieu, Darmon and Drewnowski43, Reference Maillot, Darmon and Vieux44). These observations may explain, at least in part, the positive correlation observed between socio-economic status and the quality and diversity of food consumed(Reference Darmon and Drewnowski34).
Trends observed between the INCA1 (1998–9) and the INCA2 (2006–7) surveys
Most of the trends observed in children have also been found in adults, based on the same datasets(31). These common trends include: the decline in the consumption of dairy products (mainly milk and cheese); the decrease in sweetened pastries and biscuits, along with intake of sugar and confectionery; the decline in food products of animal origin, due to a reduced consumption of meat (conversely, the consumption of fish remained stable in all age groups); and the stable level of consumption of vegetables. Regarding starchy foods, the consumption of bread, crispbreads and potatoes also declined for all age groups. However, differences were observed between children and adults: the consumption of pasta, rice and fruit increased amongst adults, but remained stable in children. These overall trends are consistent with the French food balance sheet data produced by INSEE (l'Institut National de la Statistique et des Études Économiques; French National Institute of Statistics and of Economic Studies) between 1998 and 2005(45), which also showed reduced availability of milk ( − 19 %), meat ( − 9 %), sugar and confectionery ( − 12 %), and bread ( − 7 %); a stable trend for the availability of vegetables (+2 %); and increased consumption of fruit (+10 %), pasta and rice (+16 %). This convergence of results between two independent national sources of dietary data supports our findings.
Due to the paucity of other studies on dietary trends in children, comparison with recent national or international data is not straightforward. It may, however, be noted that the decreased consumption of milk has previously been observed in other countries, notably in the USA. This trend was concomitant to increases in the consumption of soft drinks and other sweetened beverages(Reference Forshee, Anderson and Storey46–Reference Nielsen and Popkin48). Similar trends have been observed in European countries. The Dortmund Nutritional and Anthropometric Longitudinally Designed (DONALD) Study also showed a decrease in milk consumption in German children older than 4 years and adolescents between 1986 and 2001(Reference Alexy and Kersting49); however, the overall consumption of dairy products remained relatively stable over this period. Milk consumption also declined in Scottish adolescents in the 1990s(Reference Inchley, Todd and Bryce50). Conversely, the consumption of chips, burgers and pies, sausages, and sweets and chocolates increased over this period. The daily intake of fruit increased, as well as vegetables in girls only. Fruit consumption among Danish adolescents also increased between 2002 and 2006, although the opposite trend was observed between 1998 and 2002(Reference Rasmussen, Krolner and Svastisalee51).
Our findings showed that energy intake was stable in adolescents aged 15–17 years between 1999 and 2007 (Table 1). The same trend was observed in adults (results not shown)(31). However, a decrease was observed among children aged 3–14 years (Table 1), partly due to the decline in the consumption of food products of animal origin (mainly milk, cheese, and meat) and sweetened products. These findings were observed in parallel to the levelling off of the prevalence of overweight and the increase in sedentary screen behaviour(Reference Lioret, Touvier and Dubuisson19).
Strengths and limitations
Weight and height were self-reported in the INCA1 survey, while they were measured in the INCA2 study. It should, however, be noted that the overweight prevalence estimates based on the INCA1 data compared favourably with other studies carried out in the late 1990s which used measured weight and height(Reference Rolland-Cachera, Castetbon and Arnault52–Reference Janssen, Katzmarzyk and Boyce55), suggesting that any underestimation would be insignificant. We are also aware that potential bias towards under-reporting of food intake cannot be excluded, which is a limitation inherent to all methods used to assess food intake. This might have affected the estimation of dietary and nutritional intake in both studies. The criteria we used to exclude the outliers (log-transformed value of energy intake < mean − 3 sd) is less selective towards the issue of mis-reporting than another method used in previous studies in children(Reference Torun, Davies and Livingstone29, Reference Sichert-Hellert, Kersting and Schoch30), based on Goldberg's cut-off technique(Reference Goldberg, Black and Jebb28). Applying this method to the INCA studies resulted in rates of under-reporting ranging from 4·3 to 41·4 %, the higher rates being observed in adolescents aged 15–17 years. These potential biases have indeed mainly been described in obese adolescents and adults(Reference Livingstone and Robson56–Reference Rennie, Jebb and Wright58).
Several reasons led us to conduct the analyses while including the probable under-reporters. First, a better calculation of the cut-off values would ideally require the assessment of total physical activity, which was not available based on our questionnaires. In addition, the Goldberg's cut-off technique has only been validated in adults; suitable methods still need to be harmonised to address the issue of mis-reporting in children. Second, it has been argued that low energy reporting may concern not only those identified as under-reporters, but also those with plausible energy intakes(Reference Macdiarmid and Blundell59). Therefore, selectively excluding those with implausible energy intakes could bias the results(Reference Matthys, De Henauw and Devos60). Third, it is likely that a significant proportion of the children identified as under-reporters are under-eaters, where a diet is followed in order to lose weight, for example. This issue is particularly sensitive during adolescence. In the context of a study aiming to describe overall dietary patterns at the national scale, it makes sense to include individuals who are on restrictive diets. Finally, any existing bias is likely to be about the same in both studies (as shown in Table 1), without affecting the trends observed. Indeed, the INCA surveys were carried out using the same tools to collect food intake (i.e. the 7 d food record and the photographic booklet) and using the same nomenclature for food groups, allowing us to closely monitor food intake. The French CIQUAL (Centre d'Information sur la Qualité des Aliments) database improved between 1999 and 2007 thanks to analysis campaigns, reviews of scientific literature, and changes in food composition. As these improvements have led to a higher precision regarding the energy content of foods, we believe that the trends regarding energy intake over the 8-year period were mainly due to changes in food consumption, rather than changes in food composition.
This is the first time in France that a national dietary survey has been repeated using the same methodology in children, allowing food and nutrient intake to be monitored at the population level. The trends described in the present study occurred at a time of growing concern about overweight and the associated co-morbidities in France. Indeed, a number of public health measures, designed to improve dietary habits and physical activity patterns in children and adults, were implemented during this period. One concrete example of such measures was the ban on vending machines selling sweets and sugar-sweetened beverages in schools. This fulfilled one of several objectives stated by the Public Health Law published in 2004(61). This increasing awareness of healthy nutrition and lifestyle followed the launch of the first National Programme on Nutrition and Health (Programme National Nutrition Santé; PNNS) by the Ministry of Health in 2001(Reference Hercberg, Chat-Yung and Chauliac62). This policy highlighted the nutritional benefits of dairy products, fruit, vegetables, pulses, starchy foods, and water. It also recommended that sweetened foods be eaten only occasionally, and low-nutrient sweetened drinks be consumed even less frequently. However, it should be noted that the dietary trends observed over the last 8 years between the INCA surveys cannot be directly attributed to this national policy on nutrition. The next INCA dietary survey (INCA3) should allow these trends to be characterised further. Although repeating cross-sectional surveys of this type does not provide responses for all questions on overweight and the associated determinants, periodic monitoring of dietary patterns through the INCA surveys is an essential part of the surveillance network in France.
Acknowledgements
The authors would like to thank the French Centre d'Information sur la Qualité des Aliments (CIQUAL) group for providing the national food composition tables, the Institut de Sondage Lavialle (ISL) team for the collection of data, and all the families for their cooperation.
The INCA1 and INCA2 studies were supported by the Ministries of Agriculture, Health and Consumer Affairs, and the French Food Safety Agency (Afssa), respectively.
S. L. designed the study, analysed and interpreted the data, and wrote the manuscript. C. D. contributed to the analyses and interpretation of the data. J.-L. V. and L. L. designed, coordinated and supervised the survey. C. D., M. T., A. D., B. M., J.-L. V. and L. L. contributed to the conception of the study, interpretation of the results and editing of the manuscript. S. L., A. D., C. D. and M. T. contributed to the design of the survey and data collection. G. C.-T. was in charge of codifying foods. All authors saw and approved the final version.
No authors have a conflict of interest to declare.
Appendix Description of the thirty-nine food groups