


Chronic kidney disease has long been established as the most prevalent metabolic disease and the leading cause of death in domestic cats over the age of 12 years(Reference Brown, Elliott and Schmiedt1,Reference Alexander, Stockman and Atwal2) . It is a progressive disease that can be triggered by a number of genetic and environmental factors(Reference Finch, Syme and Elliott3). Among acquired causes of the disease, dietary phosphorus (P) has been linked to its development and/or progression, not only in cats(Reference Alexander, Stockman and Atwal2) but also in humans (reviewed in(Reference Chang and Anderson4)).
Several studies have indicated that inclusion of high levels of soluble P salts in diets, often added for technical, palatability and nutritional reasons, can cause glucosuria and increase blood urea nitrogen content whilst decreasing creatinine clearance(Reference Dobenecker, Webel and Reese5,Reference Pastoor, Van ’t Klooster and Mathot6) . In a recent feeding study(Reference Alexander, Stockman and Atwal2), reduced feed intake and vomiting were observed within 4 weeks in adult cats fed high dietary levels of sodium dihydrogen phosphate (NaH2PO4; SDHP) providing 3·6 g/1000 kcal (4184 kJ) P (total P 4·8 g/1000 kcal [4184kJ]; Ca:P ratio 0·6). This led to structural and functional changes in the kidneys as indicated by reduced glomerular filtration rate (GFR) and proteinuria, compatible with early stage chronic kidney disease(Reference Alexander, Stockman and Atwal2). This may have been due to the high post-prandial serum phosphate levels induced by the test diet(Reference Coltherd, Staunton and Colyer7). In a subsequent 28-week study, exposure to a more moderate level of SDHP, providing 1·5 g/1000 kcal (4184 kJ) P (total P 3·6 g/1000 kcal [4184kJ]; Ca:P 0·9) resulted in the development of renoliths and/or structural changes in the kidneys(Reference Alexander, Stockman and Atwal2). Although biochemical markers of kidney health remained within physiological reference ranges in most of these cats, three out of twenty-five in the test group were removed from the study due to persistent azotaemia(Reference Alexander, Stockman and Atwal2). These data indicate that reducing SDHP in the diet reduced the severity of the impact on health parameters.
A no observed adverse effect level has therefore yet to be established for total P or the inclusion of soluble P salts, and currently no specific nutritional guidance for safe upper limits for dietary P exists for feline diets. Since 2018, however, the European Pet Food Industry, FEDIAF, has added a precautionary footnote to maximum dietary P recommendations, suggesting that inorganic P compounds may pose a risk to feline renal function(Reference Alexander, Stockman and Atwal2,Reference Dobenecker, Kienzle and Schaschl8,Reference Dobenecker, Hertel-Böhnke and Webel9) . The studies reported by Alexander et al. (Reference Alexander, Stockman and Atwal2) indicate that further long-term feeding trials are needed to determine safe upper limits of dietary P and particularly in the form of added soluble salts. Dietary P from organic raw materials, such as meat and bone meals or plant-based ingredients, has been shown to be less bioavailable than from soluble P salts(Reference Pastoor, Van ’t Klooster and Mathot6,Reference Finco, Barsanti and Brown10) . Recent studies in healthy adult cats investigating post-prandial responses following single meal exposure indicate that soluble P salts, but not organic P sources, induce rapid, dose-dependent increases in serum phosphate and parathyroid hormone (PTH), a key regulator of mineral homoeostasis(Reference Coltherd, Staunton and Colyer7).
To provide further evidence to inform a safe upper limit for soluble P inclusion in cat diets, a 30 week feeding study was initiated to investigate the effects of 1 g P/1000 kcal (4184 kJ) of sodium tripolyphosphate (Na5P3O10, STPP). Two diets were tested at this level, containing either 4 g/1000 kcal (4184 kJ) or 5 g/1000 kcal (4184 kJ) levels of total P, with Ca:P ratios of 1 and 1·3, respectively. Our aim was to investigate not only the effect of this level of STPP inclusion but also any potential interactions with higher total P levels observed among commercial dry diets(Reference Summers, Stockman and Larsen11). This enabled two hypotheses to be tested, firstly that a diet formulated to 4 g/1000 kcal (4184 kJ) total P (incorporating 1 g P from STPP) and a Ca:P = 1 would not cause observable adverse effects; and secondly increasing the total P to 5 g/1000 kcal (4184 kJ), while maintaining STPP contribution at 1 g, with a Ca:P of 1·3 would also not cause observable adverse effects and allow more flexibility in dietary formulations using organic raw materials. To evaluate safety, markers of renal and bone function, as well as Ca and P homoeostasis, were assessed throughout the course of the study.
Materials and methods
This work was approved by the WALTHAM Animal Welfare and Ethical Review Body and the local Institutional Animal Care and Use Committee (IACUC, #ONL 19-001) and performed under the Canadian Council on Animal Care and in compliance with the Animals for Research Act.
Animals and husbandry
Adult cats housed at an independent research facility were health screened based on the assessment of serum biochemistry, haematology and urinary health parameters, as well as dual-energy X-ray absorptiometry (DXA) and abdominal ultrasound scans. Prior to screening, the cats had been fed one of two commercial feline diets, one wet and one dry format (see Table 1 for analysis), for varying amounts of time (1–4 months). Those with findings outside of the respective laboratory reference intervals or otherwise exhibiting signs of ill health as considered by the site veterinarian were excluded, as were cats identified as having pre-existing uroliths, renoliths or abnormal kidney architecture (i.e. extremely small kidneys or high echogenicity) as determined by an independent specialist in veterinary diagnostic imaging.
Table 1. Experimental diet composition in g/1000 kcal (4184 kJ) and as fed g/100 g
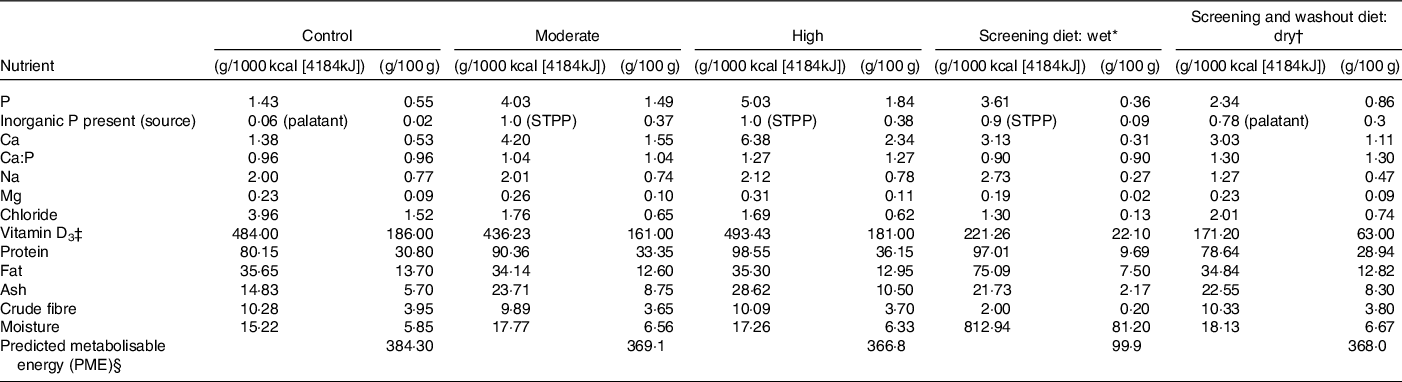
* International units IU/1000 kcal (4184kJ) or IU/100 g.
† Calculated by proximate analysis to PME kcal or 4.184kJ/100 g according to La Flamme(Reference Laflamme49).
‡ Whiskas pate with chicken.
§ Royal Canin indoor dry (cat).
The seventy-five cats included in the study (thirty-eight neutered males, twenty-seven neutered females and ten entire females) were aged between 1·9 and 8·6 years (median age 5·3 years) at the start of the study. Before initiation of the feeding study, cats were subjected to a stratified randomisation across diet groups to balance sex and neuter status, age, energy intake and body condition score. All cats were group housed within the colony across six different social rooms, capacity varied with room size and there were twenty cats in the largest group. Deionised water was offered ad libitum and social rooms are enriched with multi-level furniture, shelving and windows so that cats have access to more of the room and are able to view the surroundings. To enable individual feeding, cats received two meals per day, each providing 50 % of their maintenance energy requirements, for 30 min within their assigned lodges (measuring 122 cm × 90 cm × 76 cm (height × length × depth), multileveled with hammocks and privacy barriers), arrangements that they were habituated to. When individual housing was required during urine and faeces collection phases, they were placed within the same assigned lodges, within their normal rooms, overnight. During the day, cats were group housed and monitored to enable socialisation and normal behaviours during the collection periods.
Throughout the study period, diets were offered to maintain body weight within 10 % of their initial weight and body condition score assessed according to a 9-point scale(Reference German, Holden and Moxham12). Deionised water was offered ad libitum throughout the study.
Study design
The study assessed kidney health effects in adult cats offered one of three experimental diets during a 30-week feeding study in a parallel design followed by a 4-week washout period. The number of cats included was based on power analyses (detailed in the ‘Statistical Powering’ section). All cats were initially offered the control diet (Table 1) for 5 weeks. In the final 2 weeks of this pre-feed period, baseline blood, faeces and urine samples were collected. Following this, each group was then offered one of three experimental diets (Table 1) differing in P content, source and Ca:P ratios for 30 weeks. All cats were then transitioned onto the dry format commercial diet, fed during the screening phase, for the 4-week washout period, after which an additional blood and urine sample was collected (see Table 1 for diet analyses).
Diets
Single batches of all three experimental dry format extruded diets were manufactured by Mars Petcare North America with ingredients routinely used in commercial cat foods. All diets were produced through a standard extrusion process common in the pet food industry(Reference Rokey and Frame13). For ease, these experimental diets will subsequently be referred to as control, moderate and high throughout (see Table 1 for analyses). The control diet, formulated to the same specifications as the control diet from Alexander et al. (Reference Alexander, Stockman and Atwal2), was made to meet the Association of American Feed Control Officials and FEDIAF minimum recommended total P level of 0·5 g/100 g DM (or 1·25 g/1000 kcal (4184 kJ) based on an estimated maintenance energy requirements of 100 kcal (418.4kJ)/kg 0·67 body weight for adult cats) and a Ca:P ratio of 1·0. The P content of this diet was almost entirely supplied by the animal- and plant-derived raw materials, although a small contribution (0·06 g P/1000 kcal [4184kJ] representing 4·4 % of the total P) came from a commercial palatant. The two test diets both included STPP (Na5P3O10), at a level to provide a P at 1·0 g/1000 kcal (4184 kJ). The test diets differed, however, in total P and Ca:P ratios with the moderate test diet formulated to contain 1·5 g/100 g DM (4 g/1000 kcal or 4184 kJ) and a Ca:P ratio of 1·0, and the high test diet formulated to contain 1·8 g/100 g DM (5 g/1000 kcal or 4184 kJ) and a Ca:P ratio of 1·3 (Table 1). Due to the Ca and P content of chicken and pork meals used in the diets, the high test diet’s Ca:P could not be adjusted to <1·3 without major changes to the ingredient list.
Analyses
Diets were nutritionally analysed to ensure they were complete and balanced according to Association of American Feed Control Officials guidelines. All nutritional chemical analyses were carried out using Association of Official Agricultural Chemists procedures at Mars Petcare North America Regional Laboratory.
Intake was recorded on an individual basis as mass (g) of diet offered minus mass (g) of diet refused. Body weight and body condition score were recorded weekly using the same calibrated scale.
Mineral balance
Faecal mineral content and apparent digestibility
At baseline and after 27 weeks of feeding, 5-d total urine and faeces collections were carried out to determine macronutrient, Ca and P apparent digestibility and balance. Faeces were stored at −20°C in a sealed container until the 5-d pooled sample was collected and analysed at the Royal Canin Laboratory, Guelph, Canada. Faeces were dried, homogenised and the moisture crude fibre, ash, fat and protein content measured according to established Association of Official Agricultural Chemists methods. Inductively coupled plasma atomic emission spectroscopy analysis of P and atomic absorption spectrometry analysis of Ca were also performed on faecal samples. Apparent digestibility (%) was calculated to represent the fraction of the nutrients that were retained from the diet rather than being excreted in the faeces using the following formula:
 $${\rm{Apparent}}\,{\rm{digestibility}}\,(\% ) = ({\rm{Intake}} - {\rm{Faecal}}\,{\rm{excretion}})/{\rm{Intake}})*100$$
An estimation of the possible mineral absorption of the cats to P and Ca was carried out using the formula:
 $${\rm{Estimated}}\,{\rm{mineral}}\,{\rm{absorption}}\,\left( {{\rm{g}}/{\rm{kg}}\,{\rm{Metabolic}}\,{\rm{Body}}\,{\rm{Weight}}/{\rm{d}}} \right) = {\rm{Mineral}}\,{\rm{intake\;*}}\;\left( {{\rm{Apparent}}\,{\rm{digestibility}}/{\rm{1}}00} \right)$$
Urine mineral content and relative super saturation
All urine excreted during a 5-d period was collected and stored at −80°C until analysis was performed. Urinary pH was assessed on freshly voided samples twice daily. The method for urine preparation and relative super saturation (RSS) analysis has been previously described(Reference Robertson, Jones and Heaton14). Samples were analysed, at the Royal Canin Laboratory, Guelph, Canada, for oxalate, citrate, urate, potassium, Ca, Na, ammonium, creatinine, sulphate and phosphate via ion chromatography. The concentrations of minerals were then analysed by SUPERSAT software(Reference Robertson, Jones and Heaton14) to calculate the RSS (activity product/solubility product) for struvite (magnesium ammonium phosphate (MAP)) and Ca oxalate. The urine concentration of P and Ca used for calculation of the urinary excretion of these minerals was determined via inductively coupled plasma analysis at the University of Guelph, Ontario, Canada.
Mineral balance (g) was also calculated for P and Ca as:
 $$\eqalign{{\rm Total}\,{\rm mineral}\,{\rm balance}\,( {\rm g} ) =\qquad\qquad \cr {\rm Intake} - ( {\rm faecal}\,{\rm excretion} + {\rm urinary}\,{\rm excretion} )}$$
Urinalysis
At screening, baseline, 2, 4, 8, 12, 20, 27 weeks and following the 4-week washout period, a 5 ml freshly voided sample was obtained from each cat for albumin, creatinine, protein, pH and urine-specific gravity analysis. Chemstrip 10 A (Roche diagnostics) strips were employed with visual inspection via microscopy for urinary crystals and specific gravity was determined using a refractometer (ATAGO URC-Ne) within 30 min of collection. Following storage at −20°C, urine albumin and creatinine were measured using the Beckman Coulter Microalbumin (OSR6167) and Creatinine (OSR6178) assays for the Olympus AU480 biochemistry analyser (Olympus Europe GmbH). The urine albumin : creatinine ratio was then calculated for each sample.
Blood-based measures
At screening, baseline and week 2, 4, 8, 12, 20 and 28 of the study and following the 4-week washout period, morning fasted (>12 h) blood samples were collected for the measurement of standard biochemistry and haematology parameters. Vitamin D metabolites, PTH, fibroblast growth factor 23 (FGF-23), and markers of bone turnover – ionised Ca (iCa), serum cross-laps (CTx) and bone-specific alkaline phosphatase (BAP) were measured during the study and washout period only. EDTA anticoagulated blood was sent to IDEXX Laboratories for measurement of standard haematology parameters: leucocytes and erythrocytes, Hb concentration, haematocrit, platelet count, mean corpuscular volume (MCV), mean corpuscular Hb (MCH), number and percentage of lymphocytes, monocytes and granulocytes. Serum was also prepared using serum separator tubes, these were stood upright at room temperature for a minimum of 30 min prior to a 10 min centrifuge at 2000 g , and sent to IDEXX Laboratories for determination of standard biochemistry parameters. These included total protein, albumin, phosphate, alkaline phosphatase, alanine transaminase, aspartate aminotransferase, Ca, cholesterol, blood urea nitrogen, creatinine, TAG and glucose, as well as symmetric dimethylarginine (SDMA, was not measured during screening). Further serum was prepared in the same manner for the measurement of BAP and CTx using the BAP MicroVue™ Quidel ELISA (TECO medical Group) and CartiLaps® ELISA (Immunodiagnostic Systems Ltd), according to the manufacturer’s instructions; both assays have been previously validated for use in feline samples(Reference DeLaurier, Jackson and Pfeiffer15). EDTA anticoagulated blood was centrifuged at 2000 g for 10 min and plasma aliquoted, this plasma was sent to the Department of Comparative and Biomedical Sciences, Royal Veterinary College (London) for measurements of intact plasma FGF-23 and PTH concentration. FGF-23 was analysed using a sandwich ELISA (Kainos Laboratories Inc.) as detailed by Geddes et al. (Reference Geddes, Elliott and Syme16), and PTH concentrations by a total intact PTH immunoradiometric assay (Scantibodies Laboratory, Inc.), previously validated for use with feline samples(Reference Williams, Elliott and Syme17). Serum was also prepared as above for the measurement of the vitamin D metabolites at the Bioanalytical Facility at the University of East Anglia, Norwich, UK using methods previously validated for cats(Reference Alexander, Stockman and Atwal2). Total 25OHD and total 24,25(OH)2D were measured by LC/MS-MS (performed using a Micromass Quattro Ultima Pt Mass Spectrometer; Waters Corp.). Total serum 1,25(OH)2D levels were measured using an EIA Kit (IDS Ltd.). iCa analysis was conducted using heparinised whole blood in a Stat Profile Prime Critical Care analyser (Nova Biomedical).
Serum Ca:P product (mmol2/l2) was calculated by multiplying plasma total Ca and inorganic P concentrations in mmol/l.
Renal functional measurements
At baseline and week 4, 12, 20 and 28 of the study, iohexol clearance tests were carried out to enable an estimate of GFR using the method described by Finch et al. (Reference Finch, Syme and Elliott18). Briefly, 647 mg/kg iohexol (Omnipaque 300, Amersham Health) was administered over a 2–3 min period, via a cephalic catheter, followed by a heparinised saline flush (100 IU/ml, Wockhardt UK Ltd). The completion of the infusion represented time zero. Blood samples (1 ml) were collected from the cephalic vein into serum separator tubes at 2, 3 and 4 h post-infusion. Serum iohexol concentration at each time point was analysed using High Performance Capillary Electrophoresis (deltaDOT Ltd, BioScience Innovation Centre). Weight-adjusted clearance (ml/kg per min) was calculated by the slope of the concentration gradient over the three time points.
The fractional excretion of P and Ca were calculated as the percentage filtered by the glomerulus and excreted into the urine, expressed as a ratio to creatinine clearance as below:
 $$\eqalign{\% \,{\rm{FE}} = \,{\rm{Urinary}}\,{\rm{concentration}}\,{\rm{of}}\,\left( {\rm{X}} \right)\hskip 82pt {\rm{*\;serum}}\,{\rm{creatinine}}\,{\rm{concentration}} \times {\rm{1}}00}$$
 $${\rm{Urinary}}\,{\rm{concentration}}\,{\rm{of}}\,{\rm{creatinine*serum}}\,\left( {\rm{X}} \right)\,{\rm{concentration}}$$
It is important to note that urine data for this measure were collected during week 27 of the study and blood data collected during week 28. Therefore, when collating data across these sample types at this time point, it may be asynchronous and parameters such as fractional excretion may be affected as a result.
Imaging
To detect soft tissue mineralisation, urolithiasis or other pathology, a general physical health examination, DXA and abdominal ultrasound scans were carried out, at screening and at the end (week 30) of the study with an additional ultrasound also performed during weeks 13 or 14. With the cats under sedation (6 mg/kg Intra Venous, IV, propofol (10 mg/ml)), whole body DXA scans were performed in dorsal recumbency (Hologic Discovery A QDR series) as well as full abdominal ultrasound imaging (6 mHz probe on a Biosound Esaote MYLAB 30 machine). To confirm ultrasound findings at the end of the study (week 30), an additional enhanced resolution ultrasound was performed with a 10–12 mHz (linear probe) on a Logiq-E R7 machine with cats sedated (0·14 mg/kg intramuscular or subcutaneous (SQ) premedication premix consisting of butorphanol (10 mg/ml), atropine (0·5 mg/ml) and acepromazine (10 mg/ml), and further anaesthetised with 5 mg/kg IV propofol (10 mg/ml)). DXA images were analysed using the Hologic infant whole body software (Discovery system standard analysis, version 13.2:3). Estimates of total body mass, fat mass, bone mineral density (BMD), bone mineral content (BMC) and lean body mass including BMC were derived. All imaging and interpretations were carried out by two independent specialist veterinary diagnostic consultants blinded to the dietary groupings.
Statistical powering
The study was powered according to the primary response variable GFR (iohexol clearance ml/min per kg), by simulation using baseline values from previous studies to estimate variance(Reference Alexander, Stockman and Atwal2). To detect a change in distribution where 10 % of cats had values <0·92 ml/min per kg, with approximately 80 % power, twenty cats were required per diet group and an additional five cats per group were used in the study to allow for potential dropout.
Statistical analysis
Linear mixed effects models were used with log10 transformation where necessary and fixed effects of diet group, time point (weeks) and the interaction between diet group and time point. Individual cat was included as a random effect and time point was included as a factor, not a continuous variable. From these models, mean values and 95 % CI were estimated for each diet group and time point. For the pH measure, the median collection time was used for all estimates.
For the measures that had data for both screening and washout periods, a linear mixed effects model was fitted with the measure as the response, sampling time, diet group and their interaction as fixed effects and individual cat as a random effect. The estimates for each diet group at each time point were obtained from the model. The difference between washout and screening periods was calculated within each diet group using a Tukey honestly significant difference test. These differences for each diet group were compared back to the control diet, again using a Tukey honestly significant difference test.
Where data are only available from the washout period, a linear model was fitted with the measure as the response, and diet group as the predictor variable. The difference between the test diet groups and the control diet was calculated using a Tukey test.
All analyses were performed using R version 3.6.1(19) with the lme4(Reference Bates, Mächler and Bolker20) and multcomp(Reference Hothorn, Bretz and Westfall21) libraries. Multiple comparisons correction was applied within each measure to maintain a false discovery rate of 5 %.
Results
Body weight and intakes
To ensure that the diets had been accepted by the cats for the duration of the study, body weight and intake were investigated. Body weight did not significantly change between diet groups or over the course of the study (Table 2); however, intake reduced between baseline and 27 weeks across all groups. Compared with control diet, estimated mean absorption of P and Ca was greater in the test diets (Table 2) reflecting the differences in formulations.
Table 2. Body weight, intake, bone mineral density (BMD), bone mineral content (BMC), lean body mass including BMC (LBM) and estimated P and Ca absorption at beginning and end (week 28 for the DXA measures) of the study.
(P-values denote change from baseline). (Mean values with their standard errors)
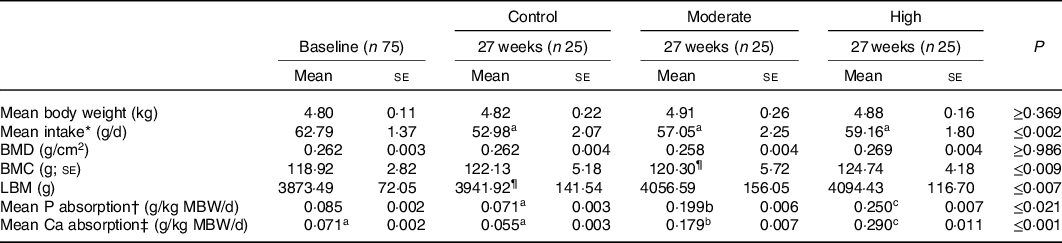
a,b,c Mean values within a row with unlike superscript letters were significantly different (P ≤ 0·05).
* Average intake per cat calculated over the 5 d faeces and urine collection periods.
† Estimated mineral absorption (g/kg metabolic body weight/d) = Mineral intake*(apparent digestibility/100).
‡ Diet did not significantly change from baseline.
Mineral apparent digestibility, balance and fractional excretion
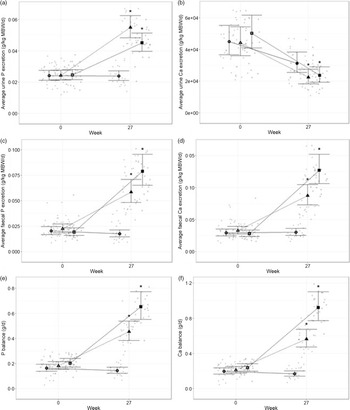
The digestibility of P and Ca in the diets and the effect on mineral balance and fractional excretion were evaluated. At baseline, P and Ca excretion and balance were not significantly different between groups (Fig. 1). Excretion of P in urine and faeces increased significantly in cats fed both test diets (P < 0·001, Fig. 1(a) and (c)). Urinary excretion of P was higher in cats fed the moderate test diet than the high test diet (P = 0·033, Fig. 1(a)), whilst P faecal excretion was higher in cats fed the high test diet than the moderate test diet (P < 0·001, Fig. 1(c)). This resulted in a higher positive P balance in cats fed the high test diet than the moderate test diet at the end of the study (P = 0·043, Fig. 1(e)). Urinary Ca excretion decreased from baseline in all diet groups (P < 0·001, Fig. 1(b)). Faecal excretion of Ca increased after feeding both test diets, although this was significantly greater for the high test diet compared with the moderate test diet (P < 0·001, Fig. 1(d)). This resulted in a higher positive Ca balance in cats fed the high test diet than the moderate test diet at the end of the study (P = 0·002, Fig. 1(f)).

Fig. 1. Mean values with 95 % upper and lower CI (n 25 per diet group) for Ca and phosphorus (P) excretion and balance at baseline (week 0) and week 27. Urinary excretion (g/kg metabolic body weight, MBW) of (a) P and (b) Ca; faecal excretion (g/kg MBW) of (c) P and (d) Ca; and resulting balance (g/d) for (e) P and (f) Ca in cats fed ●; control (1·4 g total P, Ca:P = 0·96), ▲; moderate (4 g total P, 1 g P from STPP, Ca:P = 1) and ■; high (5 g total P, 1 g P from STPP, Ca:P = 1·3) diets. *Signifies that the change from baseline in that test diet is significantly different from the change from baseline in the control diet, whilst a marker change from an ‘open’ to a ‘filled’ symbol denotes a significant difference from baseline within diet group.
Data indicate fractional excretion of P and Ca did not change for cats fed control diet. However, cats fed test diets increased fractional excretion of P (P < 0·001, Table 3) compared with baseline, whilst fractional Ca excretion reduced (P < 0·002). The fractional excretion of P in the moderate diet group was significantly higher than the high diet group at 27 weeks (P < 0·001, Table 3).
Table 3. Selected blood biochemistry, vitamin D metabolites, iCa, bone markers and urinary fractional excretion data (change from baseline within diet P values reported).
(Mean values and 95 % confidence intervals)

FECa, fractional excretion of Ca, FEP, fractional excretion of P.
a,b,c Mean values within a row with unlike superscript letters were significantly different (P ≤ 0·05).
Relative supersaturation
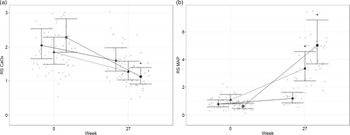
To better understand the risk of renal and urinary stone formation, urine was collected and analysed at the beginning and end (week 0 and 27) of the study for RSS. The RSS for calcium oxalate (Fig. 2(a)) was reduced compared with baseline in cats fed both test diets for 27 weeks (P < 0·001). At the end of the study, cats fed the high test diet had reduced Ca oxalate RSS compared with those fed the control diet (P = 0·005). In contrast, struvite; MAP, RSS (Fig. 2(b)) was increased in cats fed all three experimental diets (P ≤ 0·044) compared with baseline. Cats fed the high test diet had increased MAP compared with cats fed the moderate test diet (P < 0·001). Cats fed the high test diet had lower MAP at baseline compared with cats fed the moderate test diet (P = 0·005).

Fig. 2. Mean values and 95 % upper and lower CI for urinary relative super saturation of (a) calcium oxalate (CaOx) and (b) magnesium ammonium phosphate (MAP) at baseline (week 0) and week 27 for cats fed diets ●; control (1·4 g total P, Ca:P = 0·96), ▲; moderate (4 g total P, 1 g P from STPP, Ca:P = 1) and ■; high (5 g total P, 1 g P from STPP, Ca:P = 1·3) diets. *Signifies that the change from baseline in that test diet is significantly different from the change from baseline in the control diet, whilst a marker change from an ‘open’ to a ‘filled’ symbol denotes a significant difference from baseline within diet group.
Urinalysis
To assess the general health of the kidneys and urinary tract, urinalysis was performed throughout the study. Urine pH increased in cats fed the moderate (P ≤ 0·02) and high test diets (P < 0·001), compared with baseline, from weeks 8 and 2, respectively (Fig. 3(a)). This measure was also significantly increased for cats fed the high test diet, compared with cats fed control diet, at week 2 (P = 0·017) and from week 12 onwards (P ≤ 0·012). Urine pH in cats fed the moderate test diet was significantly higher than in the control group only at week 12 (P = 0·045). Urine-specific gravity was observed to significantly increase in cats fed the moderate test diet from weeks 4 to 20 (P ≤ 0·07). In cats fed the high test diet, urine-specific gravity was observed to be increased between weeks 4 and 12 (P ≤ 0·016) before returning to baseline levels at week 20 (Fig. 3(b)). Despite oscillations over the study, urine protein : creatinine ratio was reduced compared with baseline in all cats regardless of diet group (control diet, week 27 P = 0·002; moderate test diet, week 12 P = 0·015 and high test diet, week 20 P = 0·014; Fig. 3(c)). No significant effect of time or diet on the microalbumin : creatinine ratio was observed (Fig. 3(d)).
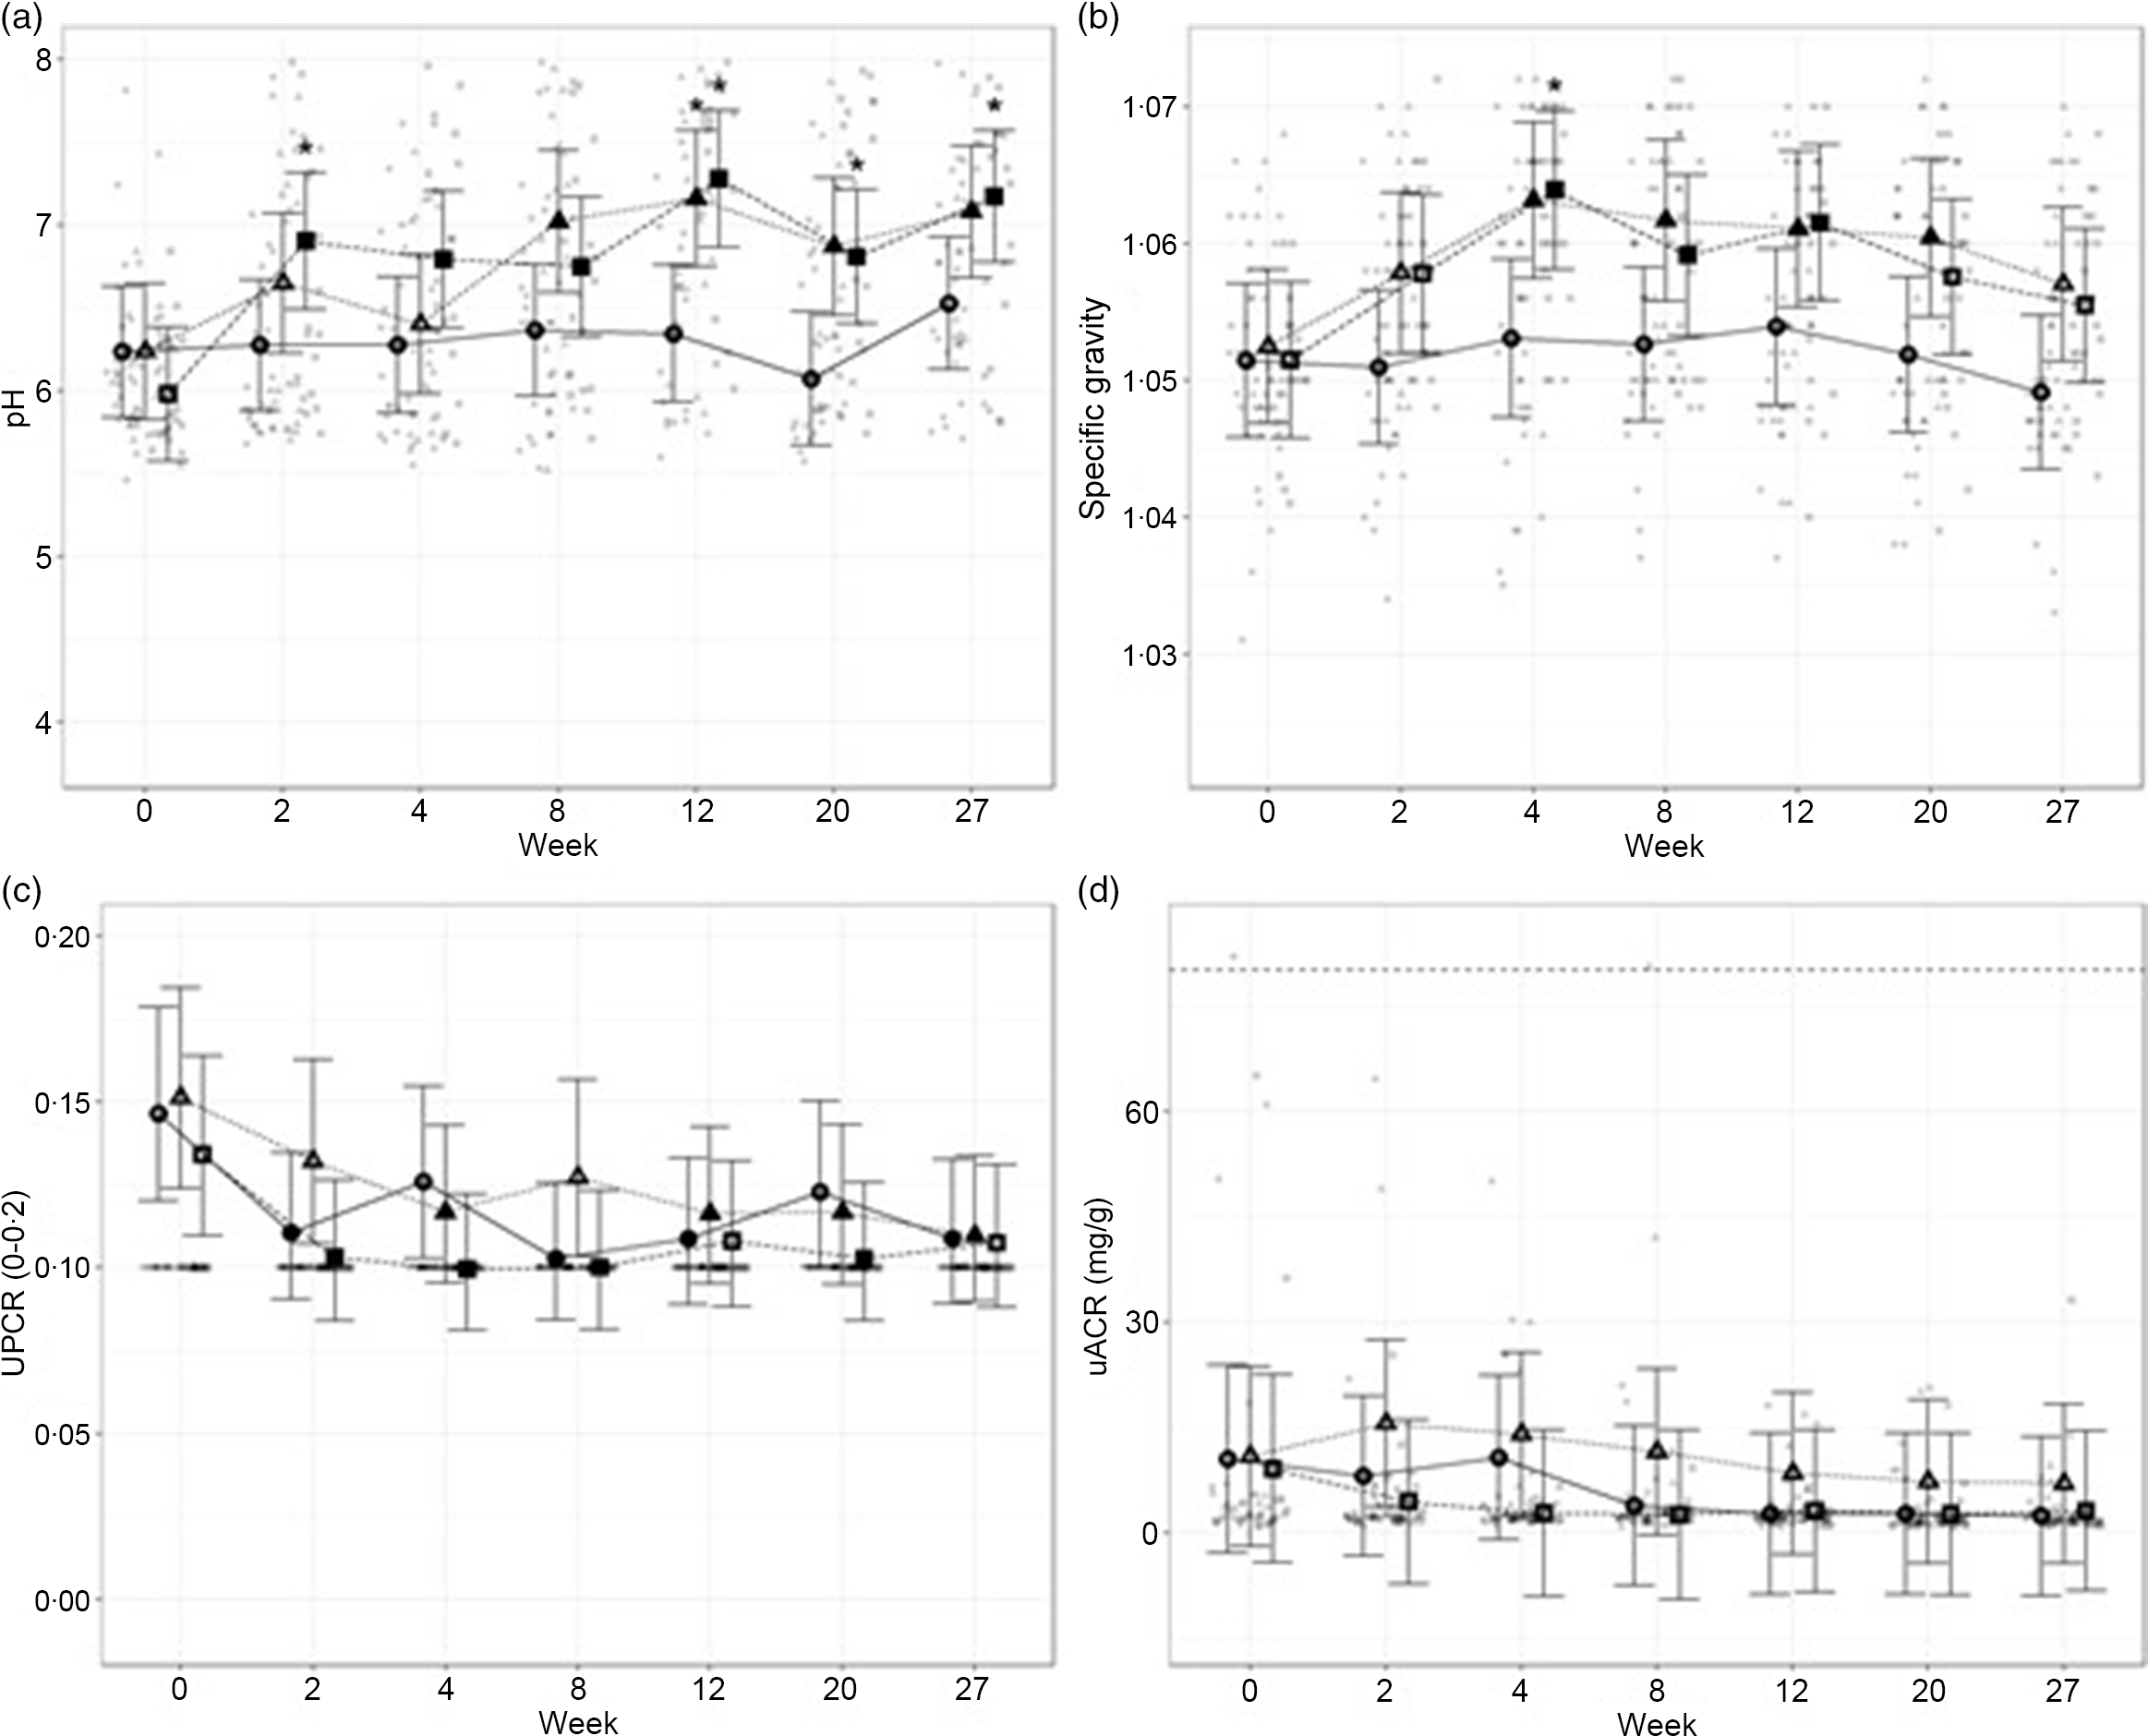
Fig. 3. Mean values and 95 % upper and lower CI for urine parameters at baseline (week 0) and during the course of 27 weeks for (a) pH, (b) specific gravity (USG), (c) urine protein:creatinine ratio (UPCR) and (d) microalbumin:creatinine ratio (µACR) for cats fed diets ●; control (1·4 g total P, Ca:P = 0·96), ▲; moderate (4 g total P, 1 g P from STPP, Ca:P = 1) and ■; high (5 g total P, 1 g P from STPP, Ca:P = 1·3) diets. *Signifies that the change from baseline in that test diet is significantly different from the change from baseline in the control diet, whilst a marker change from an ‘open’ to a ‘filled’ symbol denotes a significant difference from baseline within diet group. Dotted lines across UACR graph indicate the upper physiological reference range.
Glomerular filtration rate
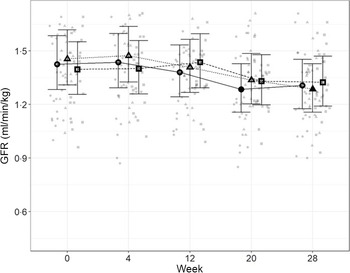
In order to directly assess kidney function, iohexol clearance was assessed at regular intervals to determine GFR. Although no significant differences between diets were detected (Fig. 4), a slight decrease from baseline, which did not meet the level of statistical significance for the high diet group, was observed over the course of the study. At week 20, a significant reduction from baseline (P = 0·011) was observed for cats fed the control diet, which was not detected at week 28. Cats fed the moderate test diet had significantly lower GFR at week 28 than at baseline (P < 0·001), but no difference between diet groups were detected at this time point.
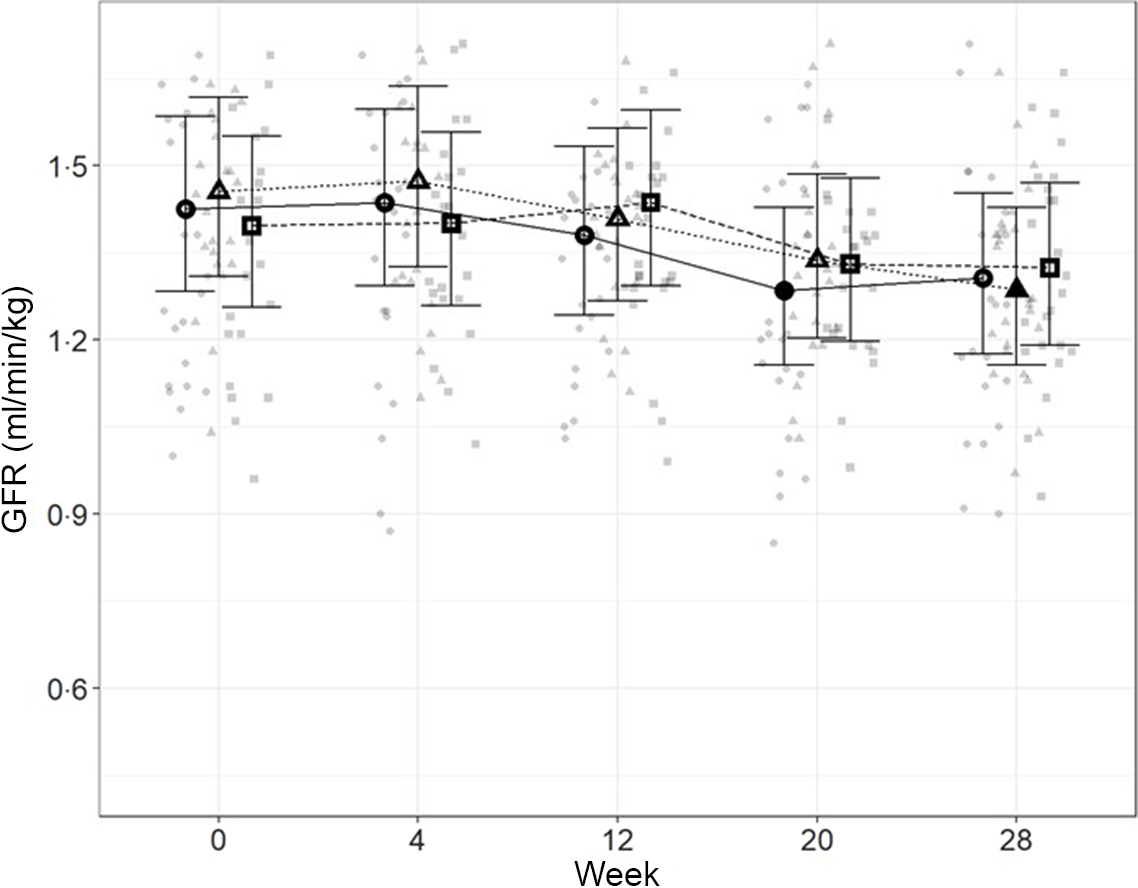
Fig. 4. Mean values and 95 % upper and lower CI for glomerular filtration rate (iohexol clearance in ml/min per kg) at baseline (week 0) and over the course of 28 weeks for cats fed ●; control (1·4 g total P, Ca:P = 0·96), ▲; moderate (4 g total P, 1 g P from STPP, Ca:P = 1) and ■; high (5 g total P, 1 g P from STPP, Ca:P = 1·3) diets. *Signifies that the change from baseline in that test diet is significantly different from the change from baseline in the control diet, whilst a marker change from an ‘open’ to a ‘filled’ symbol denotes a significant difference from baseline within diet group.
Blood biochemistry, mineral concentrations, regulatory hormones and bone markers
The blood parameters used as indices of health, kidney and bone function, as well as mineral metabolism and regulation are provided in Fig. 5 and Table 3 (see online Supplementary Table for screening and/or washout data).
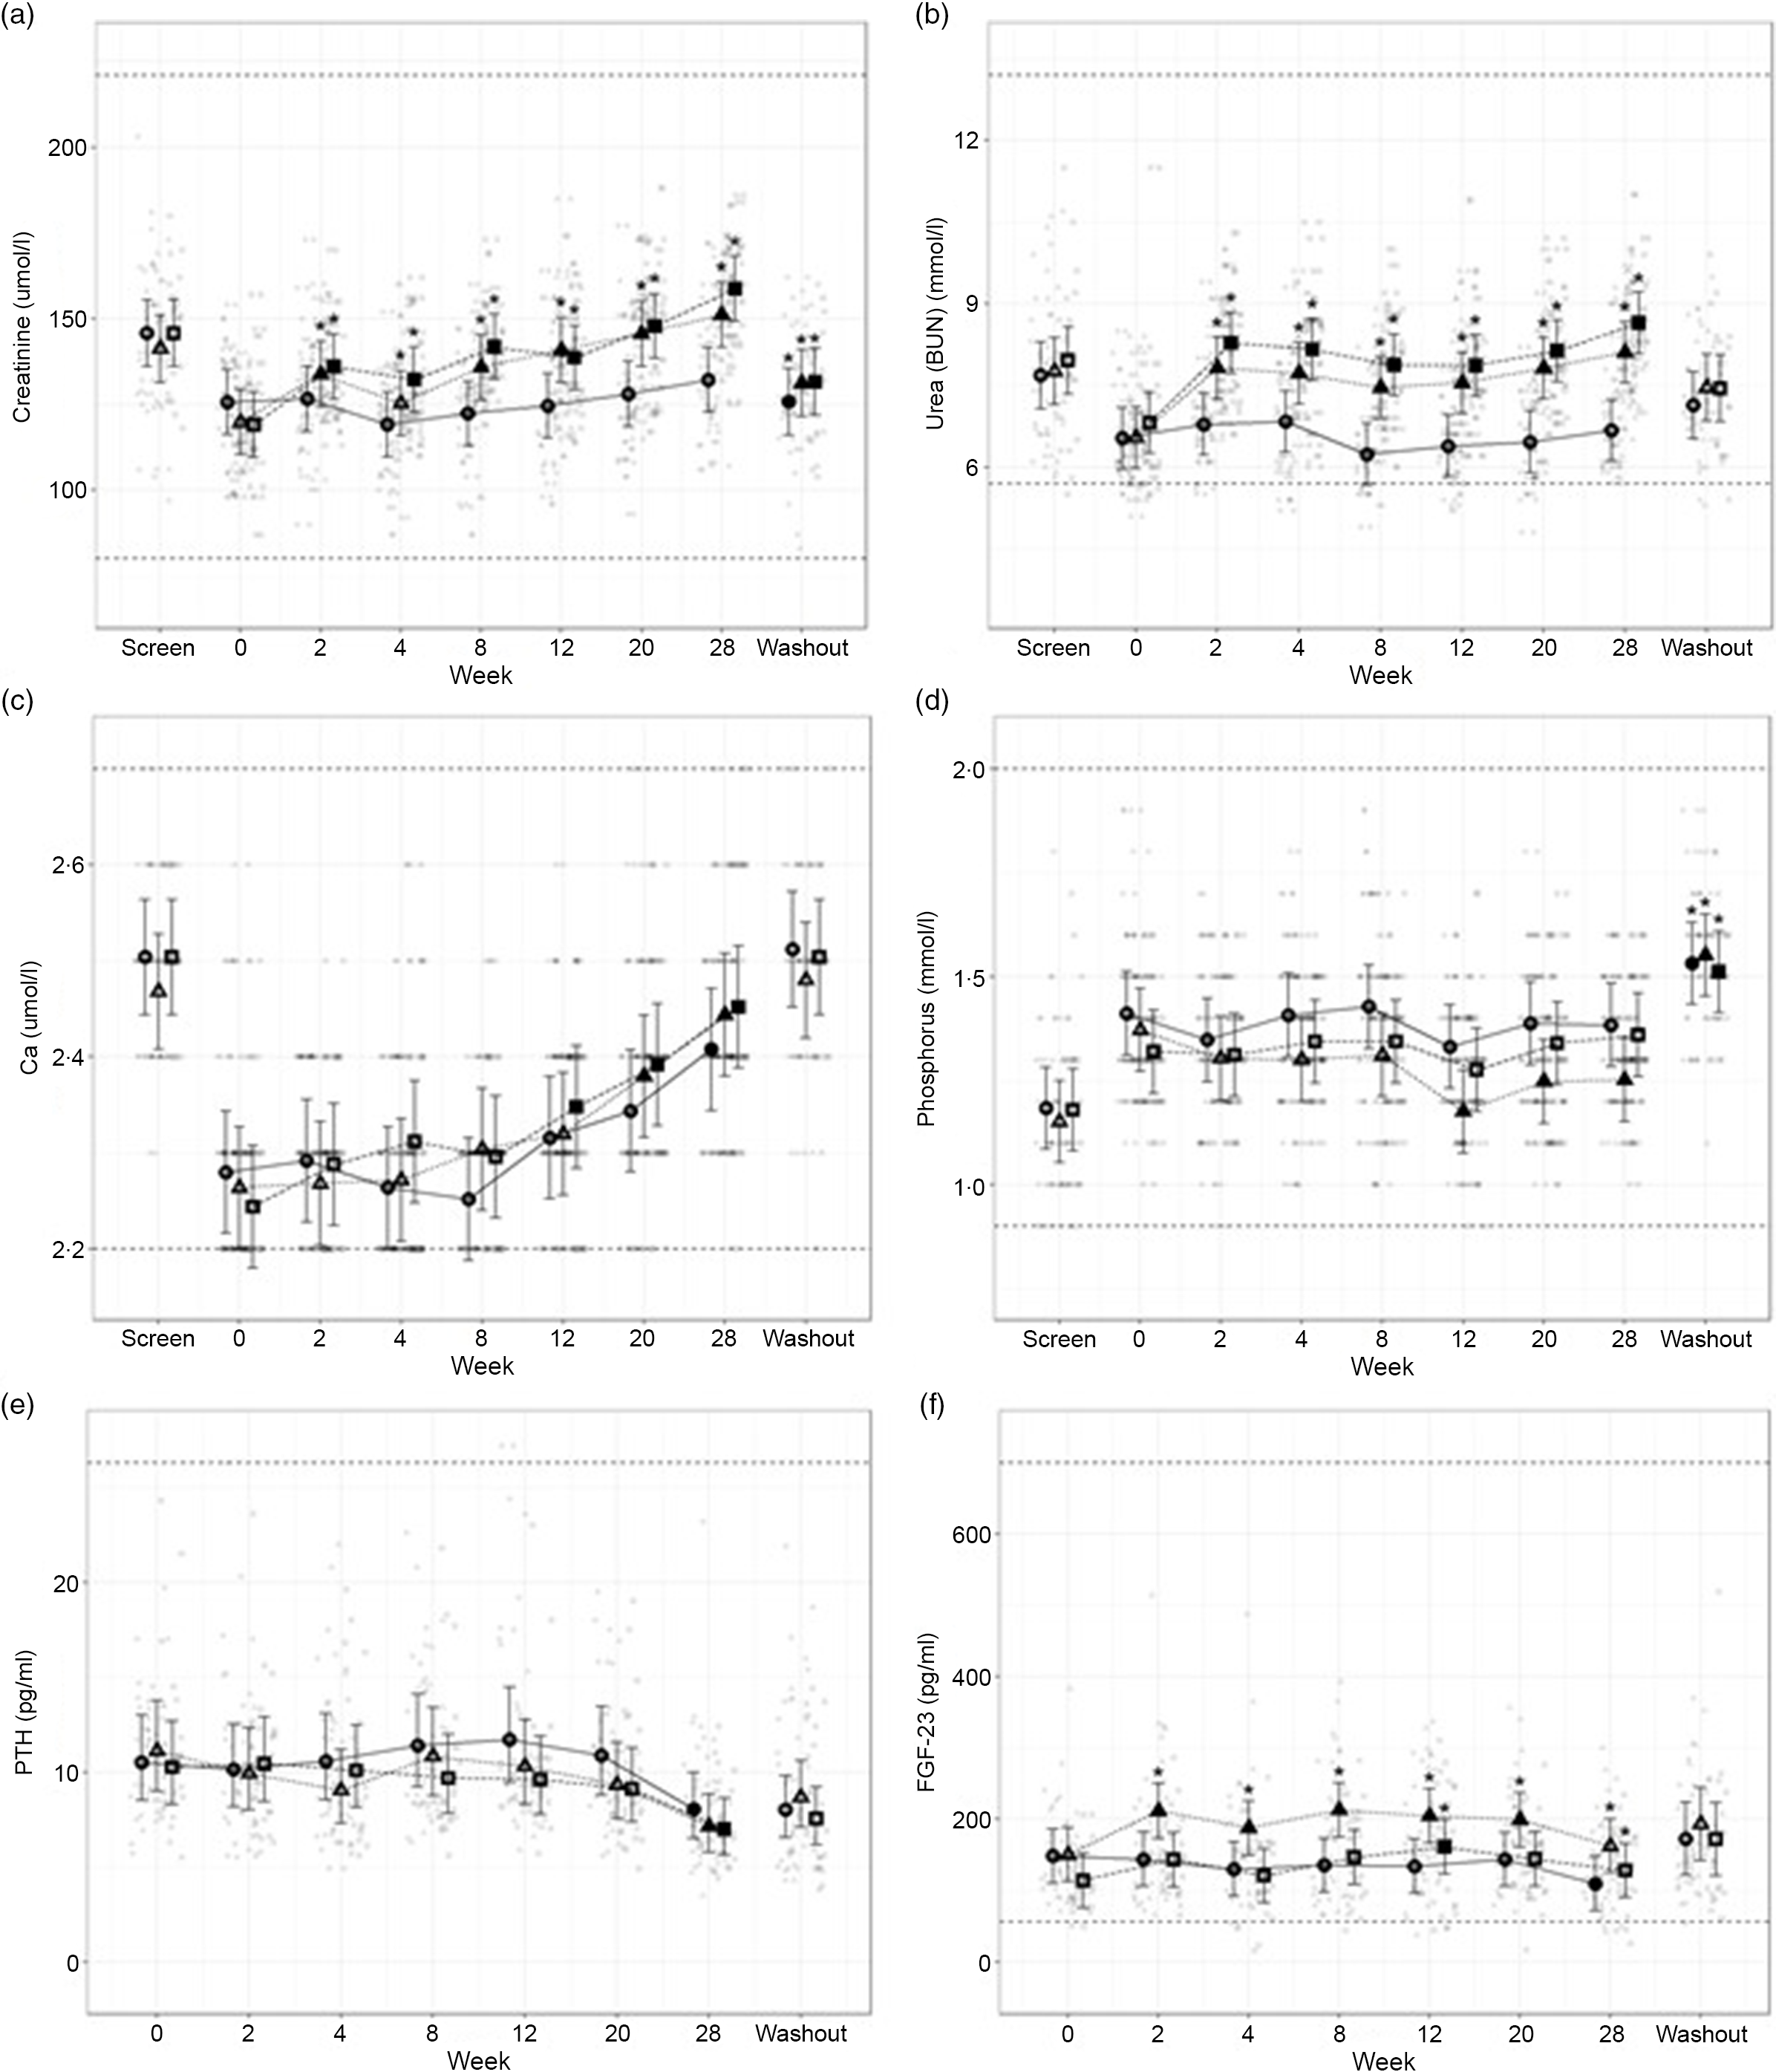
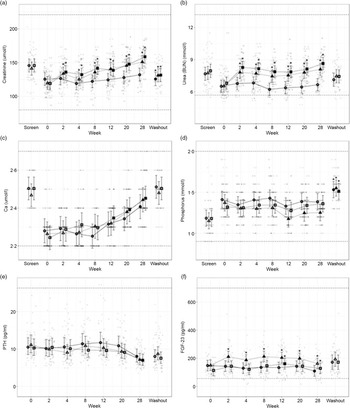
Fig. 5. Mean values and 95 % upper and lower CI at baseline (week 0) and during the course of 28 weeks of feeding for serum biochemical parameters (a) creatinine (mmol/l), (b) urea (mmol/l), (c) total Ca (mmol/l), (d) inorganic P (mmol/l) and plasma concentrations of (e) parathyroid hormone (PTH, pg/ml) and (f) fibroblast growth factor – 23 (FGF-23, pg/ml) in cats fed ●; control (1·4 g total P, Ca:P = 0·96), ▲; moderate (4 g total P, 1 g P from STPP, Ca:P = 1) and ■; high (5 g total P, 1 g P from STPP, Ca:P = 1·3) diets. All graphs also show data from screening (where possible) and washout sampling. *Signifies that the change from baseline in that test diet is significantly different from the change from baseline in the control diet, whilst a marker change from an ‘open’ to a ‘filled’ symbol denotes a significant difference from baseline within diet group. Dotted lines across the graphs indicate the physiological reference ranges (for graphs a–d these are from IDEXX).
Secondary markers of kidney health, creatinine (Fig. 5(a)) and blood urea nitrogen (Fig. 5(b)) were increased in cats fed both test diets when compared with baseline values and to those fed the control diet (P ≤ 0·041 and 0·001, respectively). Serum SDMA (Table 3) increased in all groups over the course of the study (P < 0·001) and change from baseline for cats fed the moderate test diet was significantly greater than that for cats fed the control diet at week 20 (P = 0·015). In contrast, no difference between the control and the high test diet group was detected. Serum albumin and globulin concentrations (see online Supplementary Table 1) remained unchanged throughout the study with no effect of diet observed, although a reduction between screening and baseline was detected for cats fed the control diet and the high test diet (serum albumin P < 0·001) and cats fed the high test diet only (serum globulin P = 0·004). Serum albumin concentration was found to significantly decrease between screening and washout period for cats fed the high test diet (P = 0·03, see online Supplementary Table 2).
Total serum Ca (Fig. 5(c)) increased in all diet groups by the end of the study, from week 12 for the high test diet, week 20 for the moderate test diet and week 28 for the control diet (P < 0·001). Serum inorganic P (Fig. 5(d)) remained stable throughout the study, except in cats fed the moderate test diet where P was decreased at weeks 12–28 when compared with baseline values (P ≤ 0·005). There were, however, no significant between diet differences in serum P concentration during the study. From baseline to week 28, cats fed the high test diet significantly increased CaP product concentration (Table 3) (P < 0·001), but there was no significant difference compared with the control group at any time. However, at weeks 12 and 28 the change from baseline in the moderate test diet group was significantly less than that in the high test diet group (P = 0·03 and 0·02, respectively). There was a significant increase in CaP product observed for all diets when screening and washout periods were compared (P < 0·001, Table 3).
The plasma concentration of regulatory hormone PTH (Fig. 5(e)) did not show a significant effect of diet, but did decline over time for all diet groups (P ≤ 0·01). However, FGF-23 plasma concentrations (Fig. 5(f)) were significantly increased in cats fed the moderate test diet (P ≤ 0·028). At week 12, cats fed the high test diet had increased FGF-23 concentrations (Fig. 5(f), P < 0·001), this was returned to baseline at week 20, and cats fed the control diet showed a significant reduction in FGF-23 at week 28 (Fig. 5(f), P = 0·012).
Vitamin D metabolites (Table 3), total 25(OH)D, total 24,25(OH)2D and 1,25(OH)2D, showed no significant differences in serum concentration between the diet groups for the duration of the study (P > 0·05). Total 24,25(OH)2D concentrations decreased significantly from baseline in all diet groups from week 2 (control P = 0·022, moderate test diet P = 0·005 and high test diet P = 0·013). Cats fed the high test diet showed a significant increase from baseline in 1,25 (OH)2D concentration at week 8 (P = 0·019), then returned to baseline levels for the rest of the study.
Among the markers of bone turnover measured, blood iCa concentrations in cats fed the test diets were significantly increased from baseline levels at week 28 (P < 0·001, Table 3). BAP concentrations were not significantly different between diet groups, but decreased from baseline over time for all diet groups (Table 3). This decrease was, however, observed earlier in cats fed the high test diet, which was significantly reduced from baseline from week 4 onward (P = 0·028). At week 12, BAP concentrations for cats fed the moderate test diet were also significantly reduced compared with baseline (P < 0·001), while for the control diet group a significant reduction was detected from week 20 (P < 0·001). For serum cross-laps (CTx), no change from baseline was observed over the course of the study for the control diet group (Table 4). Cats fed test diets, however, showed a decrease in CTx concentrations over time (P ≤ 0·006, Table 3). This decrease from baseline was significantly greater than the control group from week 12 for cats fed the high test diet and week 28 for the moderate test diet (P = 0·03 and 0·001, respectively). After the washout period, cats fed control diet had significantly lower CTx than at week 28 (P < 0·001).
Table 4. Number of cats showing findings in their ultrasound data by diet group and time point. There were twenty-five cats in each diet group

Haematology
Haematology analysis was carried out as a measure of health; those parameters affected by diet are reported in online Supplementary Table 1 (see online Supplementary Table 2 for screening and/or washout data). MCH, MCV and reticulocyte Hb reduced significantly over the course of the study for all diet groups, whilst staying within IDEXX laboratory reference ranges (P < 0·001). At weeks 12 and 28, cats fed the moderate and high test diets were observed to have significantly decreased MCH, compared with the control diet group (P = 0·04 and 0·01, respectively). MCV for cats fed test diets was also observed to have reduced significantly more than the control diet group at week 12 (moderate test diet P = 0·002, high test diet P = 0·024) and this remained significantly lower than the control group at week 20 in cats fed the high test diet (P = 0·04). MCH and MCV were also found to significantly decrease between screening and washout periods for all diet groups (P < 0·001). Compared with cats fed control diet, the MCH of cats fed the moderate test diet was significantly decreased (P = 0·023) and the MCV of cats fed the high test diet was significantly decreased (P = 0·029) following the washout period. The concentration of reticulocyte Hb in cats fed the moderate test diet was significantly reduced compared with the control diet group from week 12 onwards (P ≤ 0·042).
Abdominal ultrasound and dual-energy X-ray absorptiometry
In order to assess soft tissue and skeletal mineralisation, imaging via DXA and ultrasound was performed. No changes in mineralisation were observed during DXA scans at baseline or week 28, and no difference in BMD was detected following 28 weeks of feeding the experimental diets (Table 2). However, BMC was found to be increased from baseline in cats fed the control and high diets (Table 2, P<0·009), whilst lean body mass was increased from baseline in cats fed the moderate and high diets (Table 2, P < 0·001 and P = 0·007, respectively).
No changes in kidney size, shape or soft tissue structure indicative of pathology were observed by renal sonography. At the end of the 30 week study, one cat from the moderate test diet group was reported by the primary imager to have partial (or non-continuous) rim signs that were not present at baseline, indicating presence of some echogenicity of the thin medullary band parallel to the corticomedullary junction where the proximal renal tubules reside. Several additional findings were noted in both the first and second opinions, and therefore a frequency analysis was performed (Table 4). This showed that the incidence of rim signs and bright (hyperechoic) renal cortices did not differ between diets (P > 0·88). However, it was noted that these findings increased as time progressed in all diet groups. There was also one instance of ‘speckling’ and one cat developed renal ‘cysts’, but as these were isolated observations, no statistical analyses could be performed.
Discussion
This 30-week feeding study in healthy adult cats was initiated to investigate the safety of P-rich, dry extruded diets containing 1·0 g/1000 kcal (4184kJ) of a soluble P salt. Results indicate that the diets with total P levels of 4·0 and 5·0 g/1000 kcal (4184kJ), of which STPP provided 1·0 g/1000 kcal (4184kJ), and Ca:P ratios of 1·0 and 1·3, respectively, did not cause adverse health effects. Ultrasound and DXA scans did not reveal adverse structural changes in renal or skeletal tissue. Blood and urinary markers of general health, renal function and bone metabolism remained within physiological reference ranges. Findings from the 4-week washout period indicate that the increased serum creatinine and urea values in cats fed the test diets were adaptations to dietary factors, including but not limited to P levels, rather than indications of kidney damage. Differences between diet groups in mineral status and regulators of Ca and P metabolism were detected. However, the absence of adverse health effects suggests that these regulatory mechanisms were operating within physiological boundaries, and adaptation to the added Ca and P load was apparently successful following 30 weeks of exposure. Therefore, this is the first chronic feeding study to demonstrate a no observed adverse effect level for a soluble P salt in complete and balanced, dry feline diets, specifically STPP providing 1·0 g/1000 kcal (4184kJ) P in diets containing up to 5·0 g/1000 kcal (4184kJ) total P (with Ca:P 1·0 or 1·3) for a 30-week feeding period in healthy, adult cats.
Measures of kidney and bone function and health
No significant structural changes or renoliths were observed in the kidneys on ultrasound imaging after 30 weeks of feeding STPP at this dietary concentration. Although medullary rim signs were observed in some cats over the length of the study, frequency analysis suggested that these were not diet-related. The observed increase in albumin in the urine in association with renal structural changes reported in previous studies(Reference Alexander, Stockman and Atwal2) was absent here.
Despite significant increases in SDMA and reductions in GFR during the course of the study, which correlates with current SDMA/GFR literature ((Reference Braff, Obare and Yerramilli22); reviewed in(Reference Sargent, Elliott and Jepson23)), no significant differences were observed between the dietary groups. The direct correlation between creatinine and SDMA is well established and, due to extrarenal parameters exerting less direct influence on SDMA concentration, it is considered a more sensitive and reliable marker of early kidney disease(Reference Braff, Obare and Yerramilli22). However, there has been a successful nutritional intervention in non-azotemic geriatric dogs, where both SDMA and creatinine were decreased(Reference Hall, MacLeay and Yerramilli24). In our study, it is therefore likely that SDMA increased in response to increased serum creatinine in the cats fed the test diets (due to dietary composition) rather than a decline in GFR(Reference Braff, Obare and Yerramilli22), although this mechanism is not supported in the cats fed the control diet in the present study who did not show increased serum creatinine. The lack of dietary group differences suggests another, currently unknown mechanism behind the increased SDMA over the study, such as seasonal variation. There is some evidence in hypertensive humans that GFR declines between spring and summer(Reference Masugata, Senda and Inukai25), suggesting SDMA may also show seasonal effects due to the inverse correlation between these measures((Reference Braff, Obare and Yerramilli22); reviewed in(Reference Sargent, Elliott and Jepson23)). As all cats were fully grown adults at the start of the study, it is also unlikely that ageing over the 7 months could have led to this increased creatinine and SDMA. The cats fed the P-rich diets continued to concentrate their urine well, as indicated by the higher USG values compared with control, and urine protein : creatinine ratio and urine albumin : creatinine ratio were reduced or unchanged indicative of an absence of glomerular disease. Although GFR is the most direct measure of kidney function, clinical cases are often identified by observing a picture of declining USG (below 1·035), and increased urine protein : creatinine ratio, serum creatinine and serum urea concentrations(Reference Paepe and Daminet26,Reference Finch, Syme and Elliott27,Reference Elliott and Barber28) . Comparison of blood and urine values for several parameters between the screening, test and washout periods indicates that some of the differences detected were likely caused by diet formulation differences rather than effects of dietary P levels on kidney function or health. For example, the lower protein level in the control diet compared with the screening and test diets (Table 1) may explain the reduced serum creatinine and urea levels at baseline compared with when the cats had transitioned onto the higher protein test diets(Reference Lew and Bosch29). Likewise, the higher serum creatinine and urea concentrations observed in test diet fed cats decreased following the 4 week washout period to levels lower or similar to those observed during screening. This may indicate that changes induced by the P-rich test diets were transient and not indicative of impaired kidney function or health. Increased serum creatinine can be indicative of increases in lean mass as a result of higher dietary protein content(Reference Backlund, Zoran and Nabity30,Reference Hosten, Walker, Hall and Hurst31) , as supported by our DXA data showing differences in lean body mass for the cats fed the test diets.
In the present study, DXA scans did not reveal changes in BMD after 30 weeks of feeding the test diets, nor did BAP values differ between diet groups. The serum CTx concentration suggested that bone mineral resorption was reduced in cats fed the Ca and P-rich test diets. Despite increased BMC detected with DXA scans in control group cats, CTx values indicated that mineral resorption may be occurring, but was reduced following the washout period. The control diet was lower in Ca, P, Ca:P as well as protein than the other two test diets (Table 1), which may have induced an increase in bone turnover although no changes in BMD were detected. Yamka et al. (Reference Yamka, Friesen and Lowry32) showed that increased dietary crude protein (35·75 % v. 30·52 %) and Ca:P (1·3 v. 1·1), along with increases in EPA, DHA and n-3 fatty acids, reduced CTx in healthy geriatric cats. This corroborates our findings from the high test diet group, containing the highest protein, Ca and Ca:P ratio, which had the lowest CTx levels after week 12 of the study. In growing-finishing pigs, it was observed that decreasing total P in the diet correlated with increased serum CTx concentrations(Reference Sørensen, Kruger and Hansen-Møller33). Serum CTx concentrations were also reported to be inversely correlated with BMD and BMC(Reference Sørensen, Kruger and Hansen-Møller33), which was not the case with our data where no dietary effect on BMD was observed and BMC increased in cats fed the control and high P diets.
Mineral metabolism and regulatory mechanisms
In response to increased total and highly soluble P salt inclusion in the test diets, cats increased P excretion in the urine, as well as the faeces, the latter leading to the reduced apparent P digestibility. However, the reduction in digestibility was not low enough to fully compensate for the increased P intake, which was between 2- and 3-fold higher in test compared with control group cats. Total P levels in the test diets dose-dependently increased the positive Ca and P balance in the cats, which differed from findings in the previous studies conducted by our group(Reference Alexander, Stockman and Atwal2). A test diet containing 3·6 g/1000 kcal (4184kJ) from SDHP (4·8 g/1000 kcal [4184kJ] total P, Ca:P 0·59) resulted in no change in P but a negative Ca balance following 4 weeks of feeding. Decreasing SDHP to 1·5 g/1000 kcal or 4184kJ (3·6 g/1000 kcal [4184kJ] total P, Ca:P 0·93) and feeding for 28 weeks caused a more marked increase in P balance compared with that reported here, while no change in Ca balance data was observed(Reference Alexander, Stockman and Atwal2). These differences between studies appear to be largely driven by the reduction of Ca excreted via the urine (along with a concurrent increase in Ca faecal excretion); in the present study, this potential reduction in intestinal absorption was not observed previously. Interestingly, baseline balance values in all three of these studies were positive, supporting the hypothesis that cats tend to have a positive Ca and P balance, even when Ca and P levels in the diet are relatively low, as reported previously(Reference Alexander, Stockman and Atwal2,Reference Dobenecker, Webel and Reese5,Reference Baker and Czarnecki-Maulden34) . Mineral balance is difficult to evaluate and methodologies used can affect the variation in the results. In the present study, overnight losses in urinary volume cannot be accounted for as we did not employ radiolabelling methods, possibly impacting the data as noted previously by Hendriks et al. (Reference Hendriks, Wamberg and Tarttelin35). Analytical variability in measurement of minerals in the laboratory may also hinder the ability to measure balance with 100 % accuracy. In any case, detailed insights into regulatory mechanisms and impact on long-term health following continuous positive Ca and P burden in cats fed mineral-rich test diets are not fully understood.
To understand the risk of developing soft tissue mineralisation, renoliths or uroliths, the CaP product was calculated. In all cats, CaP product increased during the present study with no adverse effects detected on kidney or bone scans. However, it is important to note that all CaP product values in all diet groups (Table 3) were below the threshold level of 5·6 mmol2/l2 (70 mmol2/l2) at which soft tissue mineralisation has been reported to occur(Reference McLeland, Lunn and Duncan36), helping to explain the absence of any findings. RSS data suggest that the test group cats may have had a higher risk of struvite (MAP) urolith formation(Reference Smith, Stevenson and Markwell37,Reference Buffington, Rogers and Morris38,Reference Lekcharoensuk, Osborne and Lulich39) . However, there was no evidence of stone formation in any cats fed the test diets. Indeed, the cats fed the moderate test diet had increased P excretion (both absolute and fractional) compared with cats fed the high test diet, yet it was the high test group that had the highest struvite RSS values. This occurred despite cats assigned to the high diet group incidentally having a significantly lower struvite RSS than cats assigned to the moderate diet at baseline. This is in contrast to data from Alexander et al. (Reference Alexander, Stockman and Atwal2), where no sustained increase in struvite RSS was determined, but urolith and renolith formation were observed. Cats fed the test diets had higher urinary pH and specific gravity compared with the control group cats, likely due to the higher protein content of the test diets(Reference Backlund, Zoran and Nabity30,Reference Zentek and Schulz40) . This increased urinary pH may have contributed to the higher RSS MAP values(Reference Osborne, Lulich and Kruger41).
The increased P excretion in faeces and urine in cats fed the test diets indicated homoeostatic mechanisms were functioning to enable serum P to be kept relatively stable. While both test diets resulted in an absence of adverse structural or functional effects on the kidney following 30 weeks of feeding, intake of the moderate test diet with the lower Ca:P ratio of 1 resulted in reduced fasting plasma phosphate and elevated FGF-23. In humans, FGF-23 is an important regulator of phosphate and calcitriol concentrations in the serum (reviewed in(Reference Jüppner42)). In mice, it was found that administration of 5 µg of purified human full length FGF-23 reduced serum phosphate, PTH and calcitriol at various time points during the 24 h sampling period(Reference Shimada, Hasegawa and Yamazaki43). Previous work investigating the acute responses of a high oral dose of highly soluble dietary P in cats found that FGF-23 did not change over a 6 h sampling period, whereas PTH and plasma P did(Reference Coltherd, Staunton and Colyer7). This could indicate that, although the time frames are not the same, the broad mechanisms by which FGF-23 plays a role in the regulation of P may be similar, as serum P and calcitriol were found to be reduced in cats fed the moderate test diet from week 12 onwards. These observations may also suggest that the moderate P diet activated regulatory mechanisms not required by cats exposed to the high test diet due to its higher Ca:P of 1·3. There is evidence that increasing the Ca:P may mitigate the effects of exposure to high levels of soluble P salts in the diet(Reference Coltherd, Staunton and Colyer7,Reference Mack, Alexander and Morris44) . The main effect is due to the formation of insoluble complexes of Ca and P can form with Mg and reduce digestibility of P(Reference Pastoor, Van ’t Klooster and Mathot45). The inability to formulate the high test diet with a Ca:P of 1 means that we are unable to draw conclusions about the higher organic P content of this diet in isolation.
The small but significant increases in fasted FGF-23 observed here cannot be excluded as possible risk factors for the longer term development of renoliths and renal structural changes, as observed previously(Reference Alexander, Stockman and Atwal2). However, Alexander et al. observed a concurrent increase in PTH, which did not occur in the present study. Both increased PTH and FGF-23 were suggested to contribute to reduced reabsorption of phosphate in the kidney’s proximal tubules, which would explain the increased urinary and fractional P excretion and lower serum P levels observed in the present study. This would largely corroborate the current understanding of regulatory mechanisms involved in P homoeostasis(Reference Shimada, Hasegawa and Yamazaki43). PTH responses in cats do appear to be more rapid than FGF-23, as indicated by post-prandial profiles observed following acute feeding studies(Reference Coltherd, Staunton and Colyer7), and the PTH measured in fasted blood samples may not indicate levels present during the first hours after each meal. Although not measured at screening, interestingly, plasma PTH increased while FGF-23 values did not change between week 28 and the washout period. However, other regulatory proteins not measured during the present study, such as klotho, could influence homoeostasis and, as not well understood in cats, merit further investigation.
There were haematological and biochemical parameters altered over the study period across all dietary groups. These included increased Ca and iCa and declining MCH, MCV and reticulocyte Hb concentrations in blood. Currently, these data are not easy to explain as there are no obvious differences in dietary formulations that are likely to lead to changes in these parameters (e.g. dietary Ca or Fe) across the three experimental diets. Feeding the control diet prior to baseline sampling decreased total serum Ca significantly compared with screening values (by ∼ 0·2 mmol/l), it is not known whether there was a concomitant decrease in iCa as it was not measured at screening. However, all diet groups subsequently increased in Ca concentration during the test period, returning to screening levels. Hormonal regulation of Ca uptake and excretion does occur(Reference Wongdee, Rodrat and Teerapornpuntakit46); however, our study design does not allow adaptation to dietary Ca to be measured. For the haematological parameters, there was no influence of the baseline diet, and after washout MCH concentrations declined in the control cats while reticulocyte Hb declined in the control and high diet groups. In humans, increased dietary Ca content has been shown to reduce Fe absorption, possibly explaining the slower decline of control group cats for these measures (reviewed in(Reference Zijp, Korver and Tijburg47)). However, meat and poultry, which were abundant ingredients in the test diets, could enhance Fe absorption (reviewed in(Reference Zijp, Korver and Tijburg47)); therefore, any effect of the higher Ca may be counteracted. Although these results remain largely unexplained, time-dependent changes in diet composition (such as water loss) or seasonal variability cannot be excluded as factors influencing trends observed across all diet groups.
Longer term, longitudinal studies are necessary to be able to unequivocally determine safety over years of feeding; however, data reported in older cats (mean age 10·1 years, range = 5·3–14·5 years) in a 2-year study(Reference Reynolds, Chetboul and Nguyen48) may provide support for the longer term safety of inclusion of inorganic P beyond 7 months. The diets fed by Reynolds et al. contained lower total P and Ca:P than the test diets reported here, with a mean of 2·3 g/1000 kcal (4184kJ) and Ca:P of 0·8, but were similar in inorganic soluble P salt contribution (1 g/1000 kcal [4184 kJ]; Vincent Biourge, personal communication). During this 2 year study, no detrimental effects on GFR or structural changes in the kidneys as assessed by ultrasound, or albuminuria were observed. Although the formulation (i.e. different mineral concentrations, different source of inorganic P) and the focus of diets were not on dietary P, these data are encouraging.
Conclusion
The data provide evidence that dry format diets containing 1·0 g/1000 kcal (4184 kJ) P in the form of the soluble salt STPP caused no observable adverse effects when fed for 30 weeks to healthy adult cats. This was true for both test diets formulated for the present study, total P of 4·0 and 5·0 g/1000 kcal (4184 kJ) and Ca:P of 1·0 and 1·3, respectively, additionally providing evidence for no observed adverse effect level of a higher inclusion of P from organic sources with an increased Ca:P. Ultrasound and DXA scans did not reveal signs of adverse structural changes in renal or skeletal tissue. Markers of renal function, general and skeletal health, remained within physiological reference ranges. Any differences observed between diet groups were considered regulatory responses to maintain mineral homoeostasis or adaptations to dietary factors other than P levels. These findings will assist the pet food industry, regulators and professional bodies in developing guidance on safe maximum dietary levels of P for healthy adult cats.
Acknowledgements
The authors would like to acknowledge the skills and expertise of all staff that were involved with the care, training and sampling of the cats and analysis of the samples throughout the present study. The authors also wish to thank Bruce Arentson for formulation and oversight of the production of the experimental diets for the study.
This work was funded by Mars Petcare. The WALTHAM® Petcare Science Institute is a fundamental research centre for Mars Petcare.
J. C. C., J. A., J. R., J. E., V. B., L. M., R. B., D. W. L. P.W. and A. M. B conceived the project. J. C. C., J. A., C. P., J. R., J. E., V. B., L. M., R. B., D. W. L., P. W. and A. M. B developed the overall research plan and had study oversight. J. C. C. and C. P. conducted the research and oversaw the analysis of the samples. R. H. and L. C.-M., performed the statistical analysis. J. C. C. authored the paper with J. A., C. P., J. R., J. E., L. C.-M., V. B., R. B., D. W. L., P. W. and A. M. B. J. C. C, J. A., C. P., J. R., R. H., L. C.-M., V. B., L. M., R. B., D. W. L., P. W. and A.M.B were employees of (or contractors for) Mars Petcare during the study. J. E. acted as a paid independent consultant for Mars Petcare at the time of the study.
There are no conflicts of interest.
Supplementary material
For supplementary material referred to in this article, please visit https://doi.org/10.1017/S0007114521000477


 Open access