


Rice is an important staple food for half of the world’s population, and its consumption is rising steadily worldwide. The highest daily consumption of rice is in Asia, including Thailand(1). White rice (WR), or polished rice, consists mainly of starch, and it is the major type of rice consumed by Thai populations. Traditionally, the Thai population consumes WR as a staple food with an average daily consumption of more than 300 g, which provides a major source of carbohydrates (50–60 % of total energy intake)(Reference Boonpattararuksa, Songchitsomboon and Akkaravessapong2). A previous prospective cohort study of US subjects reported that the consumption of more than five servings per week of WR was associated with a higher risk of type 2 diabetes than brown rice consumption(Reference Sun, Splegelmen and Dam Van3). A recent meta-analysis revealed that the levels of WR consumption in Asian populations were higher than those in the West (average three to four servings/d v. one to two servings/week) and were strongly related to an increased risk of type 2 diabetes(Reference Hu, Pan and Malik4).
Riceberry rice (RR) (deep purple grain; Oryza sativa L.) is a special cultivar of rice developed in Thailand. RR originated from a cross-bred strain of Chao Hom Nin rice and Khao Dawk Mali 105 or fragrant Thai Jasmine rice. Riceberry oil contains several antioxidant bioactive compounds, such as γ-oryzanol, α-tocopherol, γ-tocotrienol, β-carotene, lutein, co-enzyme Q10, polyphenol and quercetin(Reference Vanavichit and Kongkachuichai5,Reference Nakornriab, Sriseadka and Wongpornchai6) . In diabetic rats, riceberry oil improved blood glucose, insulin, glucose tolerance and HbA1C and increased GLUT 4 levels(Reference Kongkachuichai, Prangthip and Surasiang7). However, the mechanisms by which RR reduces blood glucose in humans have not been established.
The glycaemic index (GI) represents the postprandial glycaemic response after the consumption of a test food compared with a standard reference (50 g of glucose). The GI values of food are classified into three categories: (1) low (GI < 55), (2) medium (GI 55–69) and (3) high (GI ≥ 70)(Reference Riccardi, Rivellese and Giacco8). Low GI foods tend to lower plasma insulin and plasma glucose when compared with high GI foods(Reference Stevenson, Williams and Nute9). Moreover, a low GI diet helps reduce the risk of developing metabolic and CVD in the nondiabetic population(Reference Bhupathiraju, Tobias and Malik10,Reference Barclay, Petocz and Millan-Price11) . RR is a medium GI food (GI = 62)(Reference Songjitsomboon12), whereas WR is a high GI food (GI = 73)(Reference Atkinson, Foster-Powell and Brand-Miller13).
The rate of gastric emptying and release of gut peptides are two of the major determinants of postprandial plasma glucose concentrations(Reference Näuck and Meier14). The gastric emptying rate (GER) is the rate-limiting step to deliver ingested food from the stomach into the small intestine for digestion and absorption. The gut peptides glucose-dependent insulinotropic polypeptide (GIP) and glucagon-like peptide 1 (GLP-1) are secreted in response to nutrients from K cells in the proximal intestine and L cells in the distal intestine, respectively. They are responsible for the substantial augmentation of insulin secretion after oral glucose compared with intravenous glucose, known as the ‘incretin effect’(Reference Näuck and Meier14), while GLP-1 also slows gastric emptying, which further contributes to lowering plasma glucose concentrations(Reference Näslund, Bogefors and Skogar15).
The effects of RR on GER and glucose-regulating hormones have not previously been evaluated. Therefore, this study aimed to compare the effects of RR and WR on GER, as well as plasma glucose, insulin, GIP and GLP-1 concentrations in healthy subjects.
Subjects and methods
Subjects
The number of subjects in this study was calculated based on data from a previous study(Reference Pletsch and Hamaker16) with an analysis of crossover design using a differences programme PASS version 14 (NCSS Statistical Software). The mean difference of half-emptying time was set as 0·3 h, the standard deviation of the paired difference was set as 0·1 h and the power was 0·9. Therefore, the sample size was 6, and this power calculation only refers to GER.
Healthy Thai subjects aged 19–50 years were recruited from the Bangkoknoi area and invited to visit the Department of Physiology for a screening assessment if they were healthy, non-pregnant, had a BMI between 18·5 and 22·9 kg/m2 and had no food or radioactive substance allergies. Subjects with a history of gastrointestinal disorders, prior abdominal surgery, diabetes mellitus, dyslipidaemia or endocrine diseases were excluded from the study. The complete blood count, fasting blood glucose, lipid profile and kidney profile were assessed before the study to ensure that the subjects were healthy. The protocol was approved by the Siriraj Institutional Review Board, Faculty of Medicine Siriraj Hospital, Mahidol University (COA no. Si209/2018) and registered in the Thai Clinical Trials Registry (registration no. TCTR20201108002). The study was performed according to the international guidelines of the Helsinki Declaration, and all subjects gave their written informed consent. The study was undertaken at the Department of Radiology and Department of Physiology, Faculty of Medicine, Siriraj Hospital, Mahidol University, Thailand between 22 October 2019 and 29 May 2020.
Study design
This was a randomised, open-label, within-subject crossover study with subjects attending on two occasions, 2 weeks apart, at 07.30 after an 8-h overnight fast. Vital signs were measured after 15 min of resting, after which an indwelling catheter was placed in the antebrachial vein for blood collection at any time point during the experiment.
On each day, subjects consumed the test meal, containing 100 g of either steamed RR (energy content: 1539·7 kJ (368 kcal), proteins: 8·6 g, fat: 3·6, carbohydrate: 75·5 g, dietary fibre: 4·1 g) or steamed WR (energy content: 1468·2 kJ (350·9 kcal), proteins: 5·7 g, fat: 1·2, carbohydrate: 79·4 g, dietary fibre: 1·7 g) served with microwaved labelled eggs and 100 ml water. The microwaved egg was prepared from 65–70 g whole egg mixed with 5 ml vegetable oil, 10 ml water and 37 MBq 99mTc phytate. Randomisation was performed using a random number table. The study protocol is shown in Fig. 1.

Fig. 1. Flow chart of the present study.
Gastric emptying measurement
The GER was determined using a scintigraphic technique, which represents the gold standard method for measuring gastric emptying, as described previously(Reference Näslund, Bogefors and Skogar15,Reference Vasavid, Chaiwatanarat and Pusuwan17) . The entire test meal was consumed within 10 min, and its retention in the stomach was imaged with the subject in the upright position using a single head γ camera (45° left anterior oblique view) immediately after meal ingestion (t = 0 min) and at 30, 60, 90, 120, 180 and 240 min. The curve for the proportion of the meal remaining in the stomach over time was fitted by a modified power exponential function. The lag time before emptying commenced, the slope of the emptying portion of the curve (% of initial activity per minute) and the gastric half-emptying time (GE T1/2) were calculated with correction for isotope decay.
Blood sampling and analysis
Venous blood samples were taken before the test meal and at 15, 30, 60, 120 and 180 min after the test meal ingestion for subsequent measurement of plasma glucose and hormone concentrations. Blood samples were collected into chilled EDTA tubes containing aprotinin, a kallikrein inhibitor, at 5000 units per ml of blood (Trasylol; Bayer). Blood tubes were stored on ice and immediately centrifuged at 1800 rpm for 10 min at 4°C. Plasma was separated and subsequently stored at −70°C until assayed.
Plasma glucose and insulin concentrations were measured in the Department of Clinical Pathology, Faculty of Medicine, Siriraj Hospital, Mahidol University, Thailand, the former using an enzymatic hexokinase method and the latter using an electrochemiluminescence immunoassay.
Plasma GIP and GLP-1 were determined by commercial ELISA kits. Total GLP-1 (7–36 amide) and the primary metabolite of GLP-1 (9–36 amide) were measured using a GLP-1 total ELISA kit (Cat #EZGLP1T-36K; EMD Millipore Corporation). The detection procedure followed the manufacturer’s instructions. The range of detection was 4·1–1000 pmol/ml, the sensitivity limit for detection was 4·1 pmol/ml and the intra-assay CV for GLP-1 was 5·31. Total GIP was determined using an ELISA kit (Cat #EZHGIP-54K; EMD Millipore Corporation). The detection procedure followed the manufacturer’s instructions. The range of detection for GIP was 4·2–2000 pg/ml, the sensitivity limit for detection was 4·2 pg/ml and the intra-assay CV was 9·23.
Statistical analyses
All data are expressed as the mean values with their standard error of the mean and were analysed using SPSS software version 22 (SPSS Inc.). Normally distributed data, including the percentage of gastric retention and plasma glucose, insulin, GIP and GLP-1 concentrations, were analysed using repeated-measures ANOVA followed by Fisher’s least significant difference analysis. Non-normally distributed data, including gastric lag time and gastric half-emptying half time (GE T1/2), were analysed using the Mann–Whitney U test. The incremental AUC were calculated based on the trapezoidal rule for plasma glucose, insulin, GIP and GLP-1. Differences in values were also compared using the Mann–Whitney U test. P ≤ 0·05 was considered statistically significant.
Results
Six subjects (all male; age 29 (s em 2·1) years (range 25–37 years); BMI 21·5 (s em 0·5) kg/m2 (range 19·5–23 kg/m2)) completed both study visits. Fasting blood chemistry parameters including cholesterol, TAG, blood urea nitrogen, creatinine and estimated glomerular filtration rate of all participants were in normal ranges and did not differ between the two visits. Baseline fasting plasma glucose and hormone concentrations did not differ between the two visits (Table 1).
Table 1. Subject characteristics and fasting glucose, hormones, lipid profiles and kidney profiles across two study visits
(Mean values with their standard error of the mean, n 6)

GIP, glucose-dependent insulinotropic polypeptide; GLP-1, glucagon-like peptide 1; BUN, blood urea nitrogen; eGFR, estimated glomerular filtration rate.
* P > 0·05 for all between-visit comparisons.
Gastric emptying rate
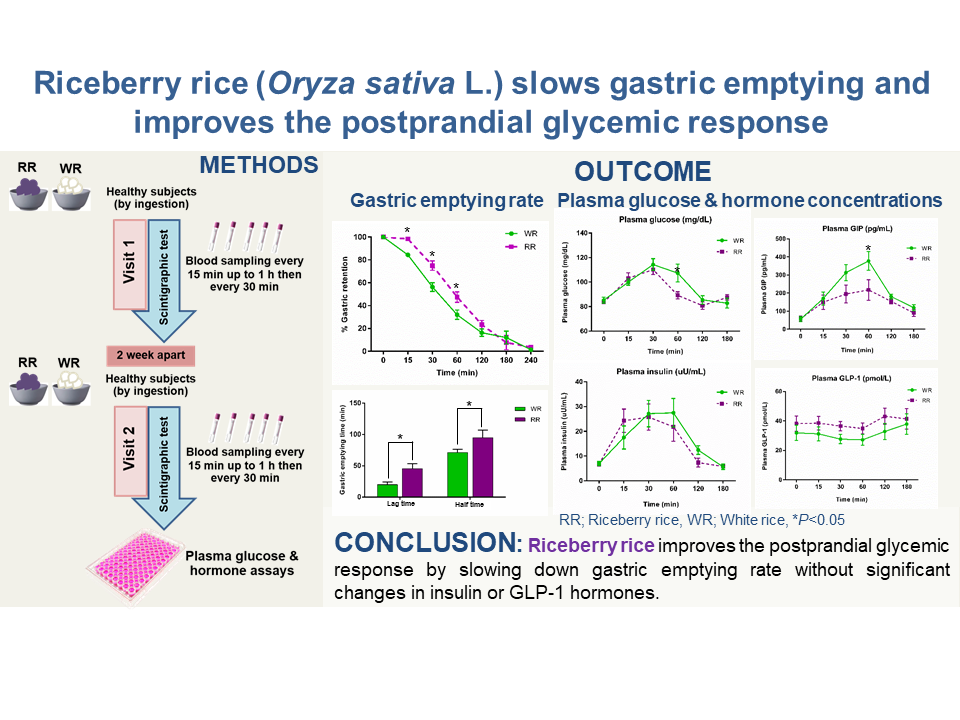
There was a significant treatment × time effect (P = 0·031) for GER. The mean percentage of gastric retention at 15, 30 and 60 min after RR ingestion was significantly higher than that after WR ingestion (98·37 (s em 1·90) v. 84·36 (s em 1·73) %, P = 0·000 at 15 min, 75·03 (s em 4·17) v. 56·26 (s em 3·81) %, P = 0·009 at 30 min, 47·51 (s em 4·54) v. 31·98 (s em 4·14) %, P = 0·032 at 60 min) (Fig. 2(a)). RR also showed a higher gastric lag time (45·26 (s em 8·20) v. 19·96 (s em 4·25) min, respectively, P = 0·004) and gastric half-emptying time (102·16 (s em 11·86) v. 73·76 (s em 4·68) min, respectively, P = 0·017) than WR (Fig. 2(b)).

Fig. 2. The effect of RR ingestion on gastric emptying rate. (a) Percentage of gastric retention over 240 min. (b) Gastric lag time and gastric half-emptying time. Data are expressed as the mean values with their standard error of the mean (n 6). *P < 0·05 compared with WR. RR, riceberry rice; WR, white rice; NP, non-parametric test. (a) ![]() , WR;
, WR; ![]() , RR. (b)
, RR. (b) ![]() , WR;
, WR; ![]() , RR.
, RR.
Plasma glucose concentrations
The plasma glucose concentrations increased from baseline to a peak at approximately 30 min after RR and WR ingestion (P < 0·05). There was a significant treatment × time effect (P = 0·05) for plasma glucose. Between 30 and 60 min after RR ingestion, plasma glucose was reduced and significantly lower than WR at 60 min after ingestion (89·17 (s em 5·51) v. 107·33 (s em 5·51) mg/dl, respectively, P = 0·042) (Fig. 3(a)). However, the iAUC (0–180 min) for plasma glucose was non-significantly lower after RR ingestion (P = 0·065) (Fig. 3(b)).

Fig. 3. Effect of RR ingestion on plasma glucose and insulin concentrations. (a) Plasma glucose concentrations at each time point for 180 min. (b) iAUC (0–180 min) for plasma glucose concentrations in (a). Data are expressed as the mean values with their standard error of the mean (n 6). #
P < 0·05 compared with baseline, *P < 0·05 compared with WR. (c) Plasma insulin concentrations at each time point for 180 min. (d) iAUC (0–180 min) for plasma insulin concentrations in (c). Data are expressed as the mean values with their standard error of the mean (n 6). #
P < 0·05 compared with baseline. RR, riceberry rice; WR, white rice; NP, non-parametric test. (a) ![]() , WR;
, WR; ![]() , RR. (b)
, RR. (b) ![]() , WR;
, WR; ![]() , RR. (c)
, RR. (c) ![]() , WR;
, WR; ![]() , RR. (d)
, RR. (d) ![]() , WR;
, WR; ![]() , RR.
, RR.
Plasma insulin concentrations
The plasma insulin concentrations between 15 and 120 min increased from baseline after RR and after WR ingestion (P < 0·05). However, there was no significant treatment × time effect (P = 0·617) for plasma insulin, which was no different in the plasma insulin concentrations at the different time points between RR and WR ingestion (Fig. 3(c)). The iAUC (0–180 min) for plasma insulin after ingestion of RR also showed no significant difference from the WR (P = 0·240) (Fig. 3(d)).
Plasma glucose-dependent insulinotropic polypeptide concentrations
Plasma GIP concentrations increased from baseline during each time point after RR and after WR ingestion (P < 0·05). There was a significant treatment × time effect (P = 0·032) for plasma GIP. Interestingly, after ingestion of WR, higher plasma GIP concentrations were observed at 60 min compared with RR (377·69 (s em 51·93) v. 217·67 (s em 56·89) pg/ml, P = 0·026) (Fig. 4(a)). The iAUC (0–180 min) for plasma GIP after WR ingestion was also higher than that after RR ingestion (P = 0·015) (Fig. 4(b)).

Fig. 4. Effect of RR ingestion on plasma GIP and GLP-1 concentrations. (a) Plasma GIP concentrations at each time point for 180 min. (b) iAUC (0–180 min) for plasma GIP concentrations in (a). Data are expressed as the mean values with their standard error of the mean (n 6). #
P < 0·05 compared with baseline, *P < 0·05 compared with WR. (c) Plasma GLP-1 concentrations at each time point for 180 min. (d) iAUC (0–180 min) for plasma GLP-1 concentrations in (c). Data are expressed as the mean values with their standard error of the mean (n 6). RR, riceberry rice; WR, white rice; NP, non-parametric test. (a) ![]() , WR;
, WR; ![]() , RR. (b)
, RR. (b) ![]() , WR;
, WR; ![]() , RR. (c)
, RR. (c) ![]() , WR;
, WR; ![]() , RR. (d)
, RR. (d) ![]() , WR;
, WR; ![]() , RR.
, RR.
Plasma glucagon-like peptide 1 concentrations
The plasma GLP-1 concentrations between 15 and 60 min after RR or WR ingestion were not different from baseline, while the plasma GLP-1 concentrations between 60 and 180 min were slightly increased without a statistically significant difference from baseline. While there was no significant treatment × time effect, the plasma GLP-1 level after RR ingestion tended to be higher than that after WR ingestion at 30 and 60 min (39·34 (s em 2·78) v. 27·64 (s em 2·54) pmol/l, P > 0·05 at 30 min, 38·68 (s em 2·83) v. 27·17 (s em 2·58) pmol/l, P > 0·05 at 60 min) (Fig. 4(c)). The iAUC (0–180 min) for plasma GLP-1 (Fig. 4(d)) also showed no significant difference between RR and WR ingestion (P = 0·394).
Discussion
The consumption of RR has become more popular in recent years due to the belief that it has beneficial health effects. The present study was the first to evaluate the acute effects of RR ingestion on glycaemic regulation in healthy human subjects. We hypothesised that RR would empty from the stomach more slowly than WR and that this would be associated with a reduction in postprandial glycaemic excursion, which was indeed the case. We also examined plasma insulin and incretin hormone concentrations and found that plasma insulin did not differ following RR and WR ingestion. The ingestion of RR was associated with lower postprandial plasma GIP concentrations than those with WR, whereas postprandial plasma GLP-1 concentrations tended to be higher after RR than WR ingestion during the 30- to 60-min interval.
RR is composed of several antioxidant bioactive compounds(Reference Vanavichit and Kongkachuichai5,Reference Nakornriab, Sriseadka and Wongpornchai6) , and chronic treatment with riceberry oil improves plasma glucose and insulin sensitivity in animal models of type 2 diabetes(Reference Kongkachuichai, Prangthip and Surasiang7), likely due to bioactive compounds, such as tocotrienol, γ-oryzanol and β-carotene, which might inhibit pancreatic β-cell apoptosis and stimulate insulin secretion from remnant pancreatic β-cells and/or regenerated β-cells(Reference Pari and Latha18,Reference Canas, Damaso and Altomare19) . However, in the present study, we evaluated the acute effect of whole RR on plasma glucose, which may be related to its fibre content rather than its bioactive compounds. RR has a higher fibre content and lower GI than WR (dietary fibre RR = 4·1 g, WR = 1·7 g, GI RR = 62, WR = 73)(Reference Songjitsomboon12). Carbohydrate-rich foods with a low GI and high fibre content protect against diabetes or CVD(Reference Riccardi, Rivellese and Giacco20). In previous studies, acute administration of dietary fibre-enriched cereal flakes attenuated postprandial plasma glucose without any significant change in glucose-regulating hormones in patients with type 2 diabetes when compared with conventional cereal flakes(Reference Kim, Oh and Kim21). The consumption of a low-GI diet for 4 weeks improves fasting plasma glucose, HbA1C and whole-body glucose utilisation (measured by the euglycaemic–hyperinsulinaemic clamp) in type 2 diabetic patients compared with a high-GI diet(Reference Rizkalla, Taghrid and Laromiguiere22). Moreover, a study of sixty-three patients with type 1 diabetes demonstrated that long-term intake of a high-fibre diet reduced mean daily blood glucose concentrations, HbA1C and the number of hypoglycaemic events compared with a low-fibre diet(Reference Giacco, Parillo and Rivellese23). An explanation for the glucose-lowering effect of RR compared with WR is its slower rate of gastric emptying. Potential factors regulating postprandial blood glucose levels include (1) the rate of delivery of nutrients into the small intestine, (2) absorption of glucose from the small intestine and (3) glucose metabolism in the liver and other tissues. The rate of gastric emptying is now established as a major determinant and rate-limiting step of nutrient delivery from the stomach into the small intestine and therefore is a major contributor to variations in postprandial glycaemia(Reference Shakil, Church and Rao24,Reference Chaikomin, Rayner and Jones25) . Drug-induced delays in gastric emptying reduce the postprandial glycaemic response to mixed meals, whereas pharmacological acceleration of gastric emptying increases postprandial blood glucose concentrations(Reference Gonlachanvit, Hsu and Boden26). Several factors determine the GER, including dietary composition(Reference Marciani, Gowland and Spiller27,Reference Gentilcore, Chaikomin and Jones28) . A previous study in thirty patients with type 2 diabetes supplemented with a soluble dietary fibre liquid diet compared with a soluble dietary fibre-free liquid diet found that soluble dietary fibre decreased postprandial glucose and insulin concentrations and negatively correlated with the rate of emptying from the distal part of the stomach(Reference Yu, Ke and Li29). The probable explanation for the slowing effect of fibre on gastric emptying includes greater resistance of fibre-containing food to the grinding action of the stomach(Reference Leeds, Vahouny and Kritchevsky30), the increased viscosity of fibre-rich foods, which delays intragastric movement of chyme towards the antrum(Reference Hunt31), and delayed absorption of fat induced by the presence of fibre in the meal, resulting in exposure of a longer length of intestine to the products of its digestion(Reference Benini, Castellani and Brighenti32). The energy content of foods also affects gastric emptying, which generally occurs at a relatively steady energetic rate within an individual(Reference Marciani, Gowland and Spiller27). Slowing gastric emptying in general attenuates the postprandial increases in insulin and GIP as well as glucose concentrations. Slow gastric emptying would also lower GLP-1 concentrations, although these may be elevated if delayed emptying is the result of prior exposure of the gut to nutrients, for example, fat(Reference Gentilcore, Chaikomin and Jones28). Our findings showed that with equivalent amounts of RR and WR, RR had slightly higher energy content (1539·7 kJ (368 kcal)) than WR (1468·2 kJ (350·9 kcal)), had higher fat content (3·6 g) than WR (1·2 g) and had higher dietary fibre (4·1 g) than WR (1·7 g), suggesting that RR was more effective in slowing the GER and reducing the increases of postprandial glucose concentrations in healthy subjects.
This study demonstrated that postprandial plasma insulin concentrations were not significantly different between RR and WR ingestion. Previous observations regarding postprandial plasma insulin responses to fibre-rich meals have been variable. The consumption of boiled barley kernels with higher dietary fibre and lower carbohydrate than white wheat bread did not change the postprandial plasma insulin levels, whereas the postprandial plasma glucose levels were decreased after boiled barley kernel ingestion(Reference Johansson, Nilsson and Östman33). The intake of dietary fibre-enriched cereal flakes exhibited low post-breakfast 2-h glucose levels without any change in plasma insulin compared with conventional cereal flakes(Reference Kim, Oh and Kim21). Acute ingestion of a highly resistant starch resulted in a decrease in both the postprandial plasma glucose and insulin levels(Reference Robertson, Currie and Morgan34). In contrast, the consumption of resistant starch for 4 weeks improved first-phase insulin secretion in overweight subjects(Reference Bodinham, Smith and Wright35). The different findings might indicate the complex mechanisms involving the control of postprandial plasma insulin secretion. Another explanation is diet composition, which is a major influence on insulin secretion(Reference Holt, Brand Miller and Petocz36,Reference Ludwig, Majzoub and Al-Zahrani37) . Carbohydrate-rich food caused a greater increase in postprandial plasma insulin levels than fat- or protein-rich food. However, the glycaemic and insulinaemic responses to ingested carbohydrates also depend on many factors, such as the source, structure, composition, processing and food preparation(Reference Trout, Behall and Osilesi38–Reference Karamanlis, Chaikomin and Doran41). In addition, dietary fibre may attenuate the glycaemic response to ingested carbohydrates by slowing the absorption of nutrients(Reference Potter, Coffman and Reid42,Reference Jenkins and Jenkins43) . Decreased blood glucose concentrations reduce the amount of insulin necessary for clearing the glucose load. In the long term, the reduction in insulin secretion may enhance insulin receptor up-regulation, which increases insulin sensitivity(Reference Song, Sawamura and Ikeda44). In our study, we evaluated the acute effect of RR on glycaemic and insulinaemic responses, but the long-term effect of RR ingestion on glycaemic control and insulin sensitivity should be investigated in future studies.
Our study also evaluated the effect of RR ingestion on plasma concentrations of the incretin hormones GIP and GLP-1. These are released from the small intestine in response to nutrients(Reference Holst and Gromada45). GLP-1 suppresses antral motility and stimulates pyloric contractions, resulting in the slowing of gastric emptying, which is likely a major mechanism of its action to lower postprandial glycaemia(Reference Näuck, Niedereichholz and Ettler46). Moreover, GIP and GLP-1 both stimulate insulin secretion when plasma glucose concentrations are increased(Reference Näuck and Meier14). In the present study, there was a greater increase in postprandial plasma GIP concentrations after WR than RR ingestion. In contrast, the postprandial plasma GLP-1 concentrations were not significantly different between the two types of rice. The slightly increased in GLP-1 concentrations after the meal should be further investigated. GIP is secreted from K cells, which are located in the proximal intestine, whereas GLP-1 is secreted from L cells located in the distal small intestine and large intestine(Reference Näuck and Meier47,Reference Drucker49) . To stimulate the release of GIP and GLP-1, ingested nutrients must reach the K and L cells, respectively. As gastric emptying regulates the delivery of nutrients into the small intestine, the minimum delivery rate is lower for GIP because GIP-producing K cells are located more proximally, while a greater delivery rate is needed, above the threshold for proximal absorption of nutrients, to increase exposure of the nutrients to the distal gut where the L cells are located(Reference Schirra, Katschinski and Weidmann50,Reference Wettergren, Schjoldager and Mortensen51) . As seen in the present study, the plasma GIP concentrations increased more noticeably than plasma GLP-1 concentrations after eating WR compared with RR, consistent with this concept. Despite greater elevation of plasma concentrations of both glucose and GIP in response to WR ingestion, the net plasma insulin response was not significantly increased over RR.
There were some limitations in our study. We investigated only the acute effect of RR on the GER, glycaemia and glucose-regulating hormones. The effects of long-term consumption of RR should be studied, which may also be more relevant to the actions of the bioactive compounds found in this rice on glycaemia and insulin sensitivity. The power calculation of sample size in this study only refers to GER; thus, it was not powered to determine differences in the metabolites or hormone concentrations. The participants were not blinded from the test meals and the participant expectations may influence many outcome measures used in the study. A previous study found that the cognitive and sensory contributions had impacted on gastric emptying and postprandial endocrine responses including changes of insulin, GLP-1 and ghrelin which might be mediated via cephalic phase responses(Reference Cassady, Considine and Mattes52). Thus, further study might require performing in blinded fashion. Additionally, the energy and macronutrient contents of each rice were not exactly matched as we aimed to evaluate the total amount of rice regularly consumed per serving as it applies in everyday consumption. Any differences in these values between RR and WR were small and would not have been expected to greatly influence the GER or plasma glucose. Finally, the palatability of the test meals was not measured which it might have an association with glycaemic response of subjects as shown in a previous study(Reference Sawaya, Fuss and Dallal53). The previous study showed that the consumption of the palatable meal increased circulating glucose levels in subjects after 30, 60 and 120 min of consuming(Reference Sawaya, Fuss and Dallal53). Therefore, the results from our study could not be implicated to explain the association between the palatability of the test meals and the glycaemic response.
In conclusion, the ingestion of 100 g RR was associated with slower gastric emptying and a reduction in postprandial plasma glucose and GIP concentrations compared with 100 g WR, without significant differences in plasma insulin or GLP-1 concentrations. Further studies in larger groups and over a longer period are required to confirm the benefits of RR consumption, as well as the potential effects of its bioactive compounds, on glycaemic control. However, our findings support the consumption of RR in healthy individuals as being beneficial for controlling postprandial glycaemia.
Acknowledgements
The authors would like to thank Prof. Dr. Apichart Vanavichit, Head of the Rice Research Center, Kasetsart University, KamphaengSaen, Nakhon Pathom, Thailand, for providing the rice samples. The authors would like to offer sincere gratitude to the staff of the Nuclear Medicine Division, Radiology Department for scintigraphic testing, collecting plasma samples and processing of laboratory results.
This work was supported by the Siriraj Research Development Fund (Grant No. R016133007 to RC), Faculty of Medicine, Siriraj Hospital, Mahidol University.
All authors have approved the submitted version and have agreed both to be personally accountable for the author’s own contributions and to ensure that questions related to the accuracy or integrity of any part of the work. N. M. and R. C. participated in the conception and design of the work. B. K., N. M., K. P., N. K., T. D. and S. C. participated in the acquisition of data. N. M., B. K. and S. C. participated in the analysis and interpretation of the data. N. M. and R. C. contributed to writing the manuscript.
The authors declare no potential conflicts of interest.


