


Research interest in dietary aetiologies of chronic diseases has in the last few decades stimulated the development and validation of methods for dietary assessment for use in epidemiological studies(Reference Willett1). In children and adolescents, a limited number of dietary assessment instruments have been found to be reproducible and valid(Reference Rankin and Hanekom2). When children and adolescents are the target population in dietary surveys, different considerations of respondents and observers must be taken into account. The cognitive abilities required to self-report food intake include an adequately developed concept of time, a good memory and attention span, and knowledge of the names of foods(Reference Livingstone and Robson3). Studies on children’s recall of food intake indicate that the instruments are susceptible to considerable error(Reference Baxter, Thompson and Davis4–Reference Smith, Jobe and Mingay10), including under-reporting, over-reporting and the incorrect identification of foods(Reference Livingstone, Robson and Wallace11). From the age of 8 years, there is a rapid increase in the ability of children to self-report food intake(Reference Saravia, González-Zapata and Rendo-Urteaga12). However, while cognitive abilities should be fully developed by adolescence, issues of motivation and body image may hinder a willingness to report(Reference Livingstone and Robson3).
After further refinement, revision and evaluation during the 1980s and 1990s, FFQ became one of the most widely used tools of research into nutritional epidemiology(Reference Cade, Burley and Warm13), and many epidemiological studies have been conducted in several countries around the world using this dietary assessment method(Reference Riboli, Hunt and Slimani14–Reference Moreno, Gottrand and Huybrechts20). The underlying principle of the FFQ approach is that average long-term diet, for example, intake over weeks, months or years, is conceptually relevant exposure rather than intake over a few specific days(Reference Willett1,Reference Naska, Lagiou and Lagiou21) . Therefore, the purpose of the FFQ is not only to quantify food or nutrient intake but also to classify individuals according to their food intake. For the relative validation of FFQ, different reference standard methods have been used. They include other dietary assessment tools, such as 24-h records (24Hr), food records (FR), weight food records (WFR) or biomarkers, and the doubly labelled water (DLW) method, in the case of energy intake (EI)( Reference Willett1).
The 24Hr is used to describe the average dietary intake of groups of individuals; participants are asked to recall and describe in detail and in an open-ended manner about the foods and beverages consumed over 1 d, preferably the day before, in detail and depth. This method requires a trained interviewer to ask the respondent to remember in detail all the foods and beverages they consumed during the previous 24 h(Reference Naska, Lagiou and Lagiou21,Reference Wrieden, Peace and Armstrong22) ; usually, several 24Hr are used to capture within person variability.
The FR is a method that consists of a specially designed booklet, or a mobile app, in which individuals list every food and beverage consumed. This estimation is made using household measurements, such as cups or spoons, food photographs, or food models. FR can be completed over several days(Reference Wrieden, Peace and Armstrong22). The limitations of this method are that individuals may change their eating behaviour during the time the recording lasts, the method does not take into account the long-term variety of consumption, possible changes in food habits and participants’ burden, which can result in incomplete FR(Reference Willett1).
The WFR is similar to the FR method, except that the quantification of foods and beverages is by weight, taken and recorded by the participants rather than estimated(Reference Wrieden, Peace and Armstrong22). Another method to describe the dietary intake of individuals is the observation method , which consists of training observers to estimate the types and amounts of food and beverages commonly served to groups of persons(Reference Ball, Benjamin and Ward23).
Nutritional biomarkers may be used as indicators of dietary exposure; therefore, any biochemical characteristic associated with the exposure that can be measured objectively can be used as a nutritional marker. More commonly, compounds found in foods – and their metabolites – are used as biomarkers, for example, serum-25, hydroxy vitamin D, vitamin C, vitamin E, retinol, carotenoids, skin carotenoids, urinary N, Ca and K excretions(Reference Byers, Trieber and Gunter24–Reference Söderberg, Lind and Karlsland Åkeson29), although physical properties, such as stable isotope ratios, are also suitable(Reference Kuhnle30).
Measurement of total energy expenditure using the DLW method has proven to be a useful tool with which to test the validity of EI measurements, based on the premises that, in subjects who are in energy balance, total EI is equivalent to total energy expenditure. This approach is limited to the validation of total EI rather than specific macronutrient and micronutrient intake(Reference Kaskoun, Johnson and Goran31).
All these methods have advantages and disadvantages for assessing individual or populational dietary intake. In epidemiological studies, where the objective is to assess different aspects of the nutritional status of the population, researchers must normally choose one of these methods because of the financial and time costs(Reference Willett1).
To address the measurement error associated with dietary questionnaires, large-scale epidemiological investigations often integrate substudies for the validation and calibration of the questionnaires and/or to administer a combination of different assessment methods (e.g. administration of different questionnaires and assessment of biomarker levels)(Reference Rankin and Hanekom2,Reference Livingstone and Robson3,Reference Cade, Burley and Warm13,Reference Naska, Lagiou and Lagiou21,Reference Wrieden, Peace and Armstrong22,Reference Tabacchi, Amodio and Di Pasquale32) .
In children and adolescents, FFQ have been used in several studies in Latin America(Reference Saravia, González-Zapata and Rendo-Urteaga12,Reference Slater, Enes and López26,Reference Marcinkevage, Mayén and Zuleta33–Reference Rodriguez, Smith and Villamor37) and all over the world(Reference Fatihah, Ng and Hazwanie38–Reference Papadopoulou, Barboukis and Dalkiranis43), and some of them previously performed a relative validation of the specifically used tool.
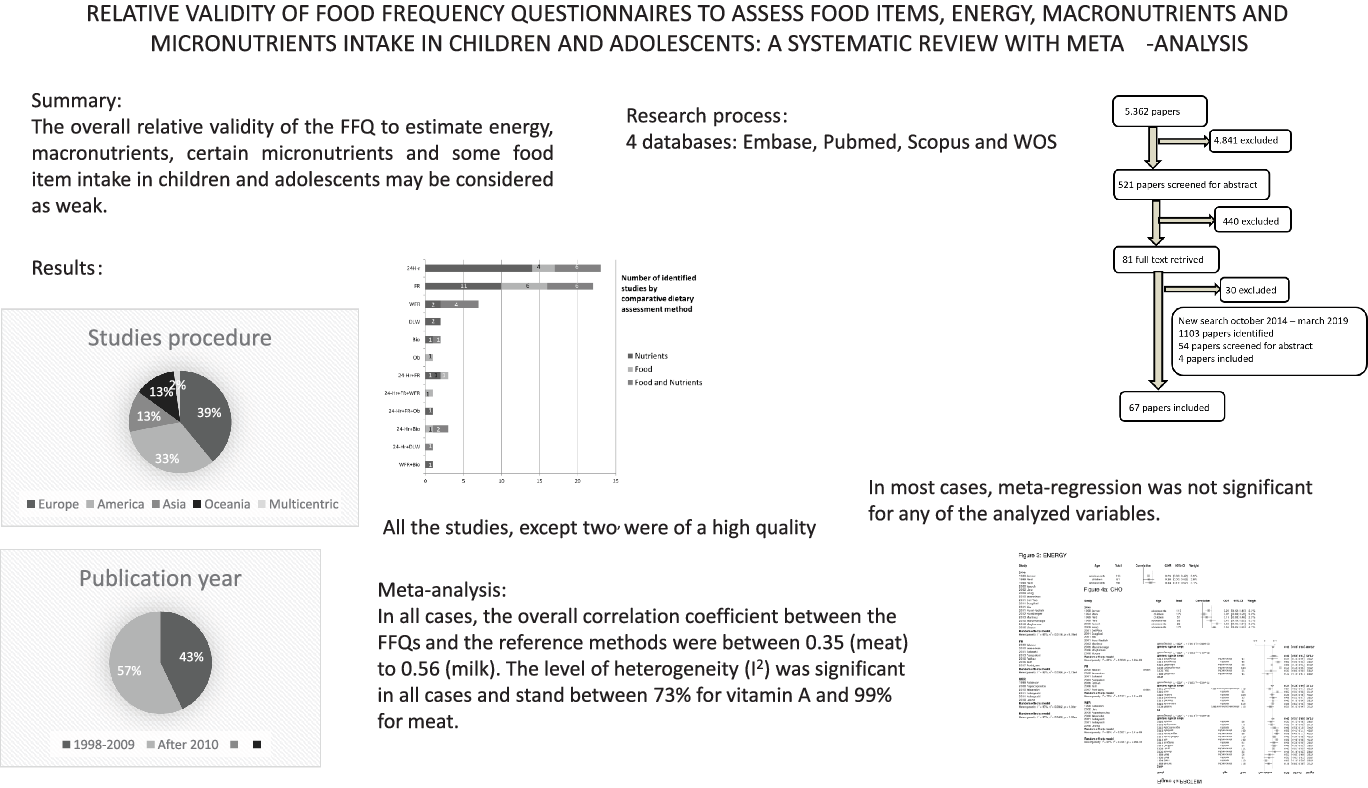
However, to our knowledge, no systematic review to date has compared the relative validity of FFQ in relation with reference methods in children and adolescents. Systematic reviews with meta-analysis have the strength of increased statistical power for primary outcomes, the ability to reach agreement when original studies yield conflicting findings, improving effect size estimates and answering questions not addressed in original trials(Reference Kelley and Kelley44). Therefore, the aim of the present study was to evaluate the relative validity of FFQ in assessing the dietary intake of children and adolescents, comparing the questionnaire with other forms of evaluating food consumption through a systematic review, considering energy, macronutrients (carbohydrates (CHO), protein, fat and fibre), certain micronutrients (Ca, Fe, Zn, vitamin A and vitamin C) and some food item (meat, milk, fruits and vegetables). We chose these foods and nutrients among others because of their relevance to children and adolescents nutrition and because they are more frequently studied.
Methods
This systematic review followed the protocol of Preferred Reporting Items for Systematic Reviews and Meta-Analyses(Reference Liberati, Altman and Tetzlaff45) and the methodology suggested by the Academy of Nutrition and Dietetics for the evidence analysis process in 2016(Reference Handu, Moloney and Wolfram46) is shown in Table 1 (Reference Kelley and Kelley44).
Table 1. Preferred Reporting Items for Systematic Reviews and Meta-Analyses checklist
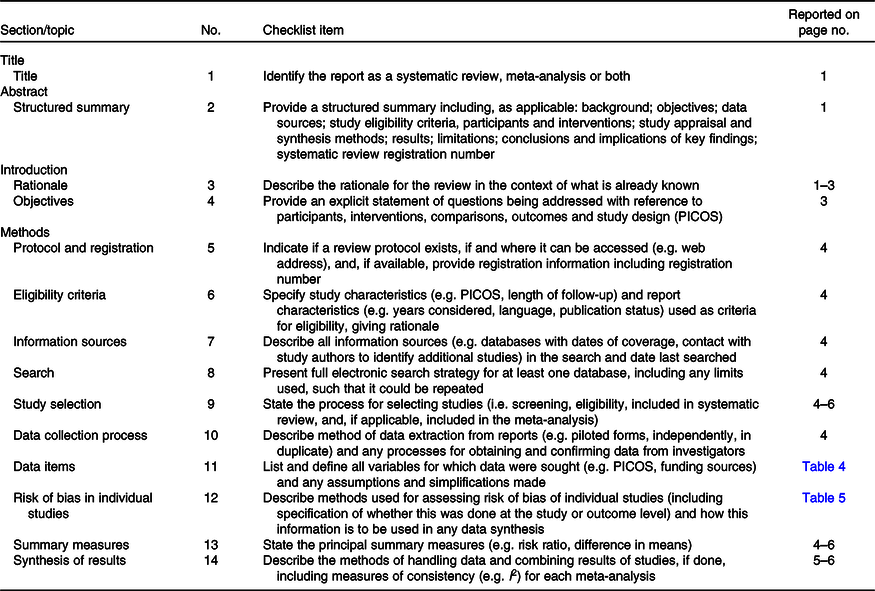
PICOS, population, intervention, comparator, outcome and setting.
The evidence analysis question was to compare the relative validity of the FFQ with reference methods of assessing energy, nutrients and/or food intake in healthy children and adolescents. The study protocol was registered in PROSPERO (http://www.crd.york.ac.uk/PROSPERO) under number CRD42016038706(Reference Kelley and Kelley44).
The PICOS (population, intervention, comparator, outcome and setting) criteria were used to perform the systematic review and are shown in Table 2.
Table 2. PICOS (population, intervention, comparator, outcome and setting) of the systematic review
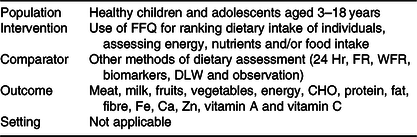
24 Hr, 24-h record; FR, food record; WFR, weight food record; DLW, doubly labelled water; CHO, carbohydrates.
Search strategy and eligibility criteria
The search strategy was undertaken to identify all literature in English, Spanish and Portuguese, published between 1988 and October 2014. In March 2019, a second search was conducted using the same databases and the same keywords to update the previous search. The reason to start in 1988 is because in 1989, Willett(Reference Willett1) published his book Epidemiological Nutrition with very exhaustive research and analysis regarding FFQ and made his proposal of a questionnaire that was then widely used for many researchers. Articles were retrieved from four electronic databases: Embase, PubMed, Scopus and Web of Science. Keywords and their combinations, using Boolean commands, were used to retrieve as many papers as possible from the databases comprehensively. Included keywords were validation studies, diet surveys, questionnaires, diet records, FFQ, usual food intake, nutrition assessment, diet, dietary patterns, biomarkers, reproducibility, validity, child and adolescent. All references were downloaded from the computerised bibliographic software Refworks 2.0, provided by the University of Zaragoza (Spain). A sample query for PubMed is included in Table 3.
Table 3. Example of the database search strategy, PubMed

The systematic search process is illustrated in Fig. 1. In the first search, 11 097 papers were identified and, after removing the duplicates, 5362 titles of articles were analysed by two independent reviewers and 4841 articles were excluded. The reviewers considered as relevant to this review those papers comparing the FFQ with other methods of dietary assessment and if they were conducted in healthy children and adolescents aged 3–18 years. Identified systematic review articles were excluded after searching the bibliography for included relevant papers. The reviewers screened 521 abstracts. At first, eighty-one papers were analysed due to their relevance in relation to the research question and fifty-one articles fulfilled the inclusion criteria of this revision. Reference lists of identified studies and related reviews were hand-searched for relevant articles. The most common reasons to exclude original research papers was that the studies did not compare the FFQ with other methods of assessment of dietary intake (nine articles), they were systematic reviews (nine articles), participants were not the population in the study, for example, children under 3 years old, (ten articles) and the investigation was not published as a journal article (two: one a chapter in a book and the other a conference abstract). In case of different opinions between the two researchers, the discrepancies were discussed until a consensus was reached. In March 2019, using the same methodology, sixteen new articles were added and sixty-seven articles were finally included in the study.
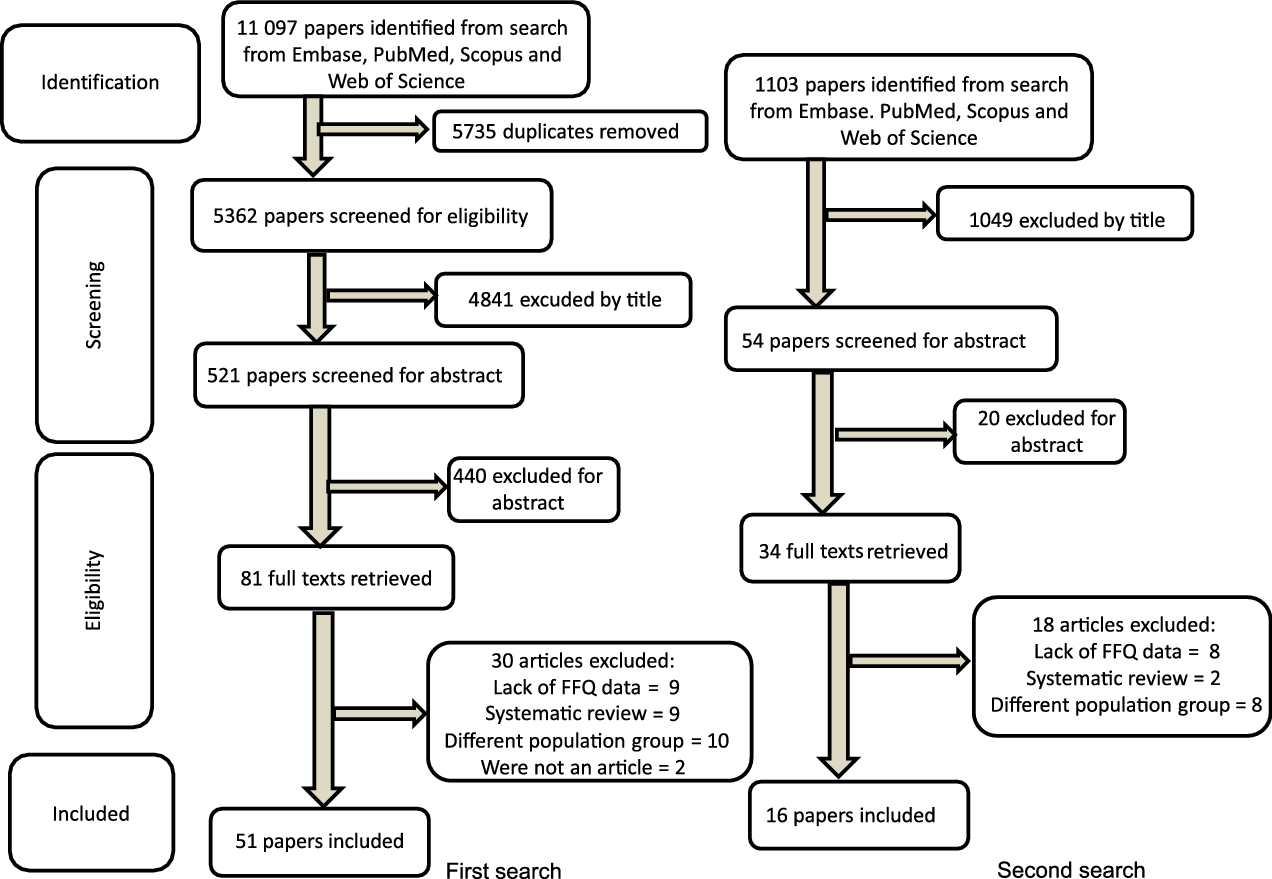
Fig. 1. Systematic research process of FFQ validity.
Data management and data extraction
From the selected articles, data were extracted into a table by the two independent reviewers. The summarised information was the reference standard method used to validate the FFQ, the aim and a brief description of the study, the characteristics of the population, a brief description of the statistical approach (correlation coefficients), and the results and conclusions of the study.
Quality assessment
All articles were independently assessed for quality by the two independent reviewers, using a standardised quality assessment checklist proposed by the Academy of Nutrition and Dietetics in 2012(47) to critically review research articles and grade the strength of evidence. All the papers qualified for this systematic review.
After a brief analysis of the results, it was decided to perform meta-analysis, including all those studies providing correlation coefficients (Pearson or Spearman) between the FFQ and the reference standard method. For the statistical tests, the α value was set at 0·05. Meta-analysis provides estimates of effect size(Reference Murad, Montori and Ioannidis48); the type of the effect size depends on the nature of the outcome (in this case, the magnitude of the association between methods). This facilitates the comparison of studies, irrespective of units of measurement or measurement scales. Meta-analysis provided a weighted average of the results of the individual studies in which the weight of the study depends on its precision. Meta-analysis was undertaken where the results could be quantitatively combined; they were performed using R Core Team (2017), a language and environment for statistical computing, R Foundation for Statistical Computing, Vienna, Austria(Reference Schwarzer, Mair and Hatzinger49). To confirm the correlation coefficient (r), Pearson correlation or Spearman’s rank, the cut-off points were defined using Cohen’s classification: less than 0·3, poor; 0·3–0·5, fair; 0·6–0·8, moderately strong; and at least 0·8, very strong(Reference Chan50,Reference Cohen51) .
Because of the high heterogeneity value (I 2) obtained in the meta-analysis, a meta-regression analysis was performed to assess the relationship between the FFQ and other reference methods for energy, macronutrients (CHO, protein, fat and fibre), micronutrients (Ca, Fe, Zn, vitamin A and vitamin C) and some food categories (meat, milk, vegetables and fruits)(Reference Schwarzer, Mair and Hatzinger49).
Finally, thirty-seven studies providing correlation coefficients, comparing the FFQ with another dietary assessment method (24Hr, FR and WFR) to estimate energy, CHO, protein, fat, fibre, Ca, Fe, Zn, vitamin A, vitamin C, meat, milk, fruit and vegetable intake were included in the meta-analysis(Reference Lietz, Barton and Longbottom25,Reference Vioque, Gimenez-Monzo and Navarrete-Muñoz28,Reference Söderberg, Lind and Karlsland Åkeson29,Reference Marcinkevage, Mayén and Zuleta33,Reference Del Pino and Friedman35,Reference Rodriguez, Smith and Villamor37,Reference Moghames, Hammami and Hwalla40,Reference Hong, Dibley and Sibbritt41,Reference Papadopoulou, Barboukis and Dalkiranis43,Reference Yum and Lee52–Reference Nyström, Henriksson and Alexandrou79) .
For biomarkers and DLW, meta-analysis was not performed owing to the limited number of studies and because they often did not provide correlation coefficients(Reference Byers, Trieber and Gunter24–Reference Söderberg, Lind and Karlsland Åkeson29,Reference Kaskoun, Johnson and Goran31,Reference Nyström, Henriksson and Alexandrou79–Reference Dutman, Stafleu and Kruizinga81) .
The model chosen was the random effect meta-analysis model, in which the effect sizes in the included studies are assumed to represent a random sample from a particular distribution of these effect sizes(Reference Borenstein, Hedges and Higgins82). A meta-regression analysis was performed to identify the probable source of heterogeneity.
Results
General description of studies included in the systematic review
Table 4 includes a summary of the main results from all the papers included in the systematic review(Reference Byers, Trieber and Gunter24–Reference Söderberg, Lind and Karlsland Åkeson29,Reference Kaskoun, Johnson and Goran31,Reference Marcinkevage, Mayén and Zuleta33–Reference Fatihah, Ng and Hazwanie38,Reference Moghames, Hammami and Hwalla40,Reference Hong, Dibley and Sibbritt41,Reference Papadopoulou, Barboukis and Dalkiranis43,Reference Yum and Lee52–Reference Julián-Almárcegui, Huybrechts and Gómez Bruton54,Reference Martinez and Estima56–Reference Kobayashi, Kamimura and Imai66,Reference Vereecken, Covents and Maes68–Reference Dutman, Stafleu and Kruizinga81,Reference Rahmawaty, Charlton and Lyons-Wall83–Reference Kunaratnam, Halaki and Ming104) . Finally, sixty-seven articles met the inclusion criteria for the systematic review. Twenty-six studies showed results obtained in European countries (Belgium, Germany, Greece, Italy, the Netherlands, Norway, Spain, Sweden, the UK and Multicentric Projects in Europe)(Reference Lietz, Barton and Longbottom25,Reference Vioque, Gimenez-Monzo and Navarrete-Muñoz28,Reference Söderberg, Lind and Karlsland Åkeson29,Reference Papadopoulou, Barboukis and Dalkiranis43,Reference Julián-Almárcegui, Huybrechts and Gómez Bruton54,Reference Bel-Serrat, Mouratidou and Pala57,Reference Pampaloni, Bartolini and Barbieri58,Reference Lillegaard, Overby and Andersen61,Reference Vereecken, De Bourdeaudhuij and Maes67,Reference Vereecken, Rossi and Giacchi71,Reference Robinson, Skelton and Barker75,Reference Nyström, Henriksson and Alexandrou79–Reference Dutman, Stafleu and Kruizinga81,Reference De Cock, Van Camp and Kolsteren84,Reference Huybrechts, Vereecken and De Bacquer88,Reference Huybrechts, De Backer and De Bacquer90,Reference Stiegler, Sausenthaler and Buyken91,Reference Huybrechts, De Bacquer and Matthys94–Reference Lambe, Kearney and Leclercrq98,Reference Samuelson, Bratteby and Enghardt100,Reference Bellú, Riva and Ortisi101) , twenty-two presented data from American countries (the USA, Brazil, Bolivia, Guatemala and Peru)(Reference Byers, Trieber and Gunter24,Reference Slater, Enes and López26,Reference Aguilar, Wengreen and Lefevre27,Reference Kaskoun, Johnson and Goran31,Reference Marcinkevage, Mayén and Zuleta33–Reference Rodriguez, Smith and Villamor37,Reference Martinez and Estima56,Reference Hunsberger, O’Malley and Block60,Reference Scagliusi, Garcia and Indiani62,Reference Jensen, Gustafson and Boushey72–Reference Field, Peterson and Gortmaker74,Reference Stein, Shea and Basch76,Reference Mulasi-Pokhriyal and Smith87,Reference Di Noia and Contento89,Reference Zemel, Carey and Paulhamus92,Reference Harnack, Lytle and Story93,Reference Crawford, Obarzanek and Morrison102,Reference Frank, Nicklas and Webber103) , nine studies were from Asian countries (Korea, Japan, Lebanon, Malaysia, China and Vietnam)(Reference Fatihah, Ng and Hazwanie38,Reference Moghames, Hammami and Hwalla40,Reference Hong, Dibley and Sibbritt41,Reference Yum and Lee52,Reference Nurul-Fadhilah, Teo and Foo63–Reference Kobayashi, Kamimura and Imai66,Reference Watanabe, Yamaoka and Yokotsuka69) , nine from Oceanian countries (Australia and New Zealand)(Reference Saeedi, Skeaff and Wong53,Reference Flood, Wen and Hardy59,Reference Watson, Collins and Sibbritt70,Reference Jenner, Neylon and Croft77,Reference Leong, Taylor and Haszard78,Reference Rahmawaty, Charlton and Lyons-Wall83,Reference Appannah, Pot and O’Sullivan86,Reference Taylor and Goulding99,Reference Kunaratnam, Halaki and Ming104) and one study included results from Colombia, Finland and the USA(Reference Saloheimo, González and Erkkola85).
Table 4. Description of the main findings of the systematic review

24Hr, 24-h record; CC, correlation coefficient; CCFFQ, Calcium Counts FFQ; CEHQ, Children's Eating Habits Questionnaire; CFFQ, children FFQ; CHO, carbohydrates; DP, dietary patterns; DLW, doubly labelled water; DQI, dietary quality index; EE, energy expenditure; F, food; FR, food record; F&V, fruits and vegetables; ICC, intraclass correlation coefficient; N, nutrient; RRS, resonance Raman spectroscopy; SFFQ, short FFQ; TEE, total energy expenditure; TEI, total energy intake; WDR, weighed diet record; WFR, weight food record; YANA-C, 24-h dietary recall instrument ‘Young Adolescents’ Nutrition Assessment on Computer.
Thirty-eight (57 %) of the studies were published after 2010, and twenty-nine (43 %) between 1989 and 2009.
In the included studies, the number of participants ranged from 22 to 10 309. As the systematic review included children and adolescents, to describe the studies, a decision was made to classify them into three groups: thirty-seven studies focused on children (2 to ≤12 years old)(Reference Byers, Trieber and Gunter24,Reference Vioque, Gimenez-Monzo and Navarrete-Muñoz28,Reference Söderberg, Lind and Karlsland Åkeson29,Reference Kaskoun, Johnson and Goran31,Reference Marcinkevage, Mayén and Zuleta33,Reference Del Pino and Friedman35,Reference Fatihah, Ng and Hazwanie38,Reference Moghames, Hammami and Hwalla40,Reference Saeedi, Skeaff and Wong53,Reference Bel-Serrat, Mouratidou and Pala57–Reference Flood, Wen and Hardy59,Reference Lillegaard, Overby and Andersen61,Reference Scagliusi, Garcia and Indiani62,Reference Sahashi, Tsuji and Wada65,Reference Kobayashi, Kamimura and Imai66,Reference Vereecken, Covents and Maes68,Reference Vereecken, Rossi and Giacchi71,Reference Field, Peterson and Gortmaker74,Reference Stein, Shea and Basch76–Reference Dutman, Stafleu and Kruizinga81,Reference Saloheimo, González and Erkkola85,Reference Huybrechts, Vereecken and De Bacquer88,Reference Huybrechts, De Backer and De Bacquer90–Reference Zemel, Carey and Paulhamus92,Reference Huybrechts, De Bacquer and Matthys94–Reference Andersen, Bere and Kolbjornsen96,Reference Taylor and Goulding99,Reference Bellú, Riva and Ortisi101,Reference Crawford, Obarzanek and Morrison102,Reference Kunaratnam, Halaki and Ming104) , seventeen studies were on adolescents (12–19 years old)(Reference Slater, Enes and López26,Reference Pérez-Cueto Eulert, Roberfroid and Kolsteren34,Reference Araujo, Yokoo and Pereira36,Reference Papadopoulou, Barboukis and Dalkiranis43,Reference Yum and Lee52,Reference Julián-Almárcegui, Huybrechts and Gómez Bruton54,Reference Martinez and Estima56,Reference Nurul-Fadhilah, Teo and Foo63,Reference Xia, Sun and Zhang64,Reference Vereecken, De Bourdeaudhuij and Maes67,Reference Robinson, Skelton and Barker75,Reference De Cock, Van Camp and Kolsteren84,Reference Appannah, Pot and O’Sullivan86,Reference Lambe, Kearney and Leclercrq98,Reference Samuelson, Bratteby and Enghardt100,Reference Frank, Nicklas and Webber103) and thirteen studies on both groups(Reference Lietz, Barton and Longbottom25,Reference Aguilar, Wengreen and Lefevre27,Reference Rodriguez, Smith and Villamor37,Reference Hong, Dibley and Sibbritt41,Reference Hunsberger, O’Malley and Block60,Reference Watson, Collins and Sibbritt70,Reference Jensen, Gustafson and Boushey72,Reference Yaroch, Resnicow and Davis73,Reference Rahmawaty, Charlton and Lyons-Wall83,Reference Mulasi-Pokhriyal and Smith87,Reference Di Noia and Contento89,Reference Harnack, Lytle and Story93,Reference Vereecken and Maes105) .
In twenty-five (37 %) studies, the FFQ respondents were the caregivers(Reference Byers, Trieber and Gunter24,Reference Vioque, Gimenez-Monzo and Navarrete-Muñoz28,Reference Söderberg, Lind and Karlsland Åkeson29,Reference Kaskoun, Johnson and Goran31,Reference Marcinkevage, Mayén and Zuleta33,Reference Del Pino and Friedman35,Reference Rodriguez, Smith and Villamor37,Reference Moghames, Hammami and Hwalla40,Reference Bel-Serrat, Mouratidou and Pala57,Reference Flood, Wen and Hardy59,Reference Scagliusi, Garcia and Indiani62,Reference Sahashi, Tsuji and Wada65,Reference Stein, Shea and Basch76,Reference Leong, Taylor and Haszard78–Reference Dutman, Stafleu and Kruizinga81,Reference Appannah, Pot and O’Sullivan86,Reference Huybrechts, Vereecken and De Bacquer88,Reference Huybrechts, De Backer and De Bacquer90,Reference Stiegler, Sausenthaler and Buyken91,Reference Huybrechts, De Bacquer and Matthys94,Reference Taylor and Goulding99,Reference Bellú, Riva and Ortisi101,Reference Kunaratnam, Halaki and Ming104) , thirty-five (55 %) were older children or adolescents(Reference Slater, Enes and López26,Reference Vioque, Gimenez-Monzo and Navarrete-Muñoz28,Reference Kuhnle30,Reference Tabacchi, Amodio and Di Pasquale32,Reference Pérez-Cueto Eulert, Roberfroid and Kolsteren34,Reference Araujo, Yokoo and Pereira36,Reference Rodriguez, Smith and Villamor37,Reference Kolodziejczyk, Merchant and Norman39–Reference Hong, Dibley and Sibbritt41,Reference Kelley and Kelley44,Reference Handu, Moloney and Wolfram46–Reference Ortega, Artero and Ruiz55,Reference Lillegaard, Overby and Andersen61,Reference Xia, Sun and Zhang64–Reference Kobayashi, Kamimura and Imai66,Reference Watanabe, Yamaoka and Yokotsuka69–Reference Vereecken, Rossi and Giacchi71,Reference Robinson, Skelton and Barker75,Reference Jenner, Neylon and Croft77–Reference Nyström, Henriksson and Alexandrou79,Reference Dutman, Stafleu and Kruizinga81,Reference Borenstein, Hedges and Higgins82,Reference Saloheimo, González and Erkkola85,Reference Appannah, Pot and O’Sullivan86,Reference Huybrechts, Vereecken and De Bacquer88) , and five (8 %) were caregivers and children or adolescents(Reference Aguilar, Wengreen and Lefevre27,Reference Fatihah, Ng and Hazwanie38,Reference Lillegaard, Overby and Andersen61,Reference Kobayashi, Kamimura and Imai66,Reference Zemel, Carey and Paulhamus92) .
Thirty-seven (55 %) of the FFQ were quantitative(Reference Byers, Trieber and Gunter24,Reference Lietz, Barton and Longbottom25,Reference Aguilar, Wengreen and Lefevre27,Reference Vioque, Gimenez-Monzo and Navarrete-Muñoz28,Reference Fatihah, Ng and Hazwanie38,Reference Hong, Dibley and Sibbritt41,Reference Julián-Almárcegui, Huybrechts and Gómez Bruton54,Reference Flood, Wen and Hardy59–Reference Lillegaard, Overby and Andersen61,Reference Nurul-Fadhilah, Teo and Foo63–Reference Kobayashi, Kamimura and Imai66,Reference Watanabe, Yamaoka and Yokotsuka69,Reference Vereecken, Rossi and Giacchi71,Reference Yaroch, Resnicow and Davis73,Reference Robinson, Skelton and Barker75,Reference Jenner, Neylon and Croft77–Reference Nyström, Henriksson and Alexandrou79,Reference Dutman, Stafleu and Kruizinga81,Reference De Cock, Van Camp and Kolsteren84,Reference Mulasi-Pokhriyal and Smith87,Reference Huybrechts, Vereecken and De Bacquer88,Reference Stiegler, Sausenthaler and Buyken91–Reference Harnack, Lytle and Story93,Reference Haraldsdóttir, Thórsdóttir and Vaz De Almeida95,Reference Taylor and Goulding99–Reference Frank, Nicklas and Webber103,Reference Vereecken and Maes105) , twenty-three (34 %) were semiquantitative(Reference Slater, Enes and López26,Reference Söderberg, Lind and Karlsland Åkeson29,Reference Kaskoun, Johnson and Goran31,Reference Marcinkevage, Mayén and Zuleta33–Reference Rodriguez, Smith and Villamor37,Reference Moghames, Hammami and Hwalla40,Reference Papadopoulou, Barboukis and Dalkiranis43,Reference Yum and Lee52,Reference Pampaloni, Bartolini and Barbieri58,Reference Watson, Collins and Sibbritt70,Reference Jensen, Gustafson and Boushey72,Reference Field, Peterson and Gortmaker74,Reference Stein, Shea and Basch76,Reference Huybrechts, Börnhorst and Pala80,Reference Rahmawaty, Charlton and Lyons-Wall83,Reference Appannah, Pot and O’Sullivan86,Reference Huybrechts, Vereecken and De Bacquer88,Reference Huybrechts, De Backer and De Bacquer90,Reference Huybrechts, De Bacquer and Matthys94,Reference Andersen, Bere and Kolbjornsen96) and seven (11 %) were qualitative(Reference Saeedi, Skeaff and Wong53,Reference Martinez and Estima56,Reference Bel-Serrat, Mouratidou and Pala57,Reference Scagliusi, Garcia and Indiani62,Reference Saloheimo, González and Erkkola85,Reference Di Noia and Contento89,Reference Lambe, Kearney and Leclercrq98) .
The number of food items in each FFQ ranged from 5 to 227, depending on the nutrient or nutrients being measured. The frequencies of the intake categories were variable, as two (3 %) of the studies reported to use eleven categories(Reference Pampaloni, Bartolini and Barbieri58,Reference Kobayashi, Kamimura and Imai66) ; three (4 %) reported to use ten categories(Reference Söderberg, Lind and Karlsland Åkeson29,Reference Leong, Taylor and Haszard78,Reference Andersen, Bere and Kolbjornsen96) ; five (7 %) studies used nine categories(Reference Vioque, Gimenez-Monzo and Navarrete-Muñoz28,Reference Kaskoun, Johnson and Goran31,Reference Rodriguez, Smith and Villamor37,Reference Di Noia and Contento89,Reference Stiegler, Sausenthaler and Buyken91) ; ten (15 %) studies used eight categories(Reference Araujo, Yokoo and Pereira36,Reference Fatihah, Ng and Hazwanie38,Reference Yum and Lee52,Reference Bel-Serrat, Mouratidou and Pala57,Reference Scagliusi, Garcia and Indiani62,Reference Sahashi, Tsuji and Wada65,Reference Vereecken, Covents and Maes68,Reference Haraldsdóttir, Thórsdóttir and Vaz De Almeida95,Reference Samuelson, Bratteby and Enghardt100) ; and ten (15 %) studies used seven categories(Reference Slater, Enes and López26,Reference Del Pino and Friedman35,Reference Papadopoulou, Barboukis and Dalkiranis43,Reference Saeedi, Skeaff and Wong53,Reference Martinez and Estima56,Reference Lillegaard, Overby and Andersen61,Reference Xia, Sun and Zhang64,Reference Vereecken, Rossi and Giacchi71,Reference Saloheimo, González and Erkkola85,97) . Nine (13 %) studies used six categories(Reference Watanabe, Yamaoka and Yokotsuka69,Reference Jenner, Neylon and Croft77,Reference Dutman, Stafleu and Kruizinga81,Reference De Cock, Van Camp and Kolsteren84,Reference Mulasi-Pokhriyal and Smith87,Reference Huybrechts, Vereecken and De Bacquer88,Reference Huybrechts, De Bacquer and Matthys94,Reference Lambe, Kearney and Leclercrq98,Reference Frank, Nicklas and Webber103) ; three (4 %) studies used five categories(Reference Nyström, Henriksson and Alexandrou79,Reference Appannah, Pot and O’Sullivan86,Reference Huybrechts, De Backer and De Bacquer90) ; two (3 %) studies used four categories(Reference Pérez-Cueto Eulert, Roberfroid and Kolsteren34,Reference Zemel, Carey and Paulhamus92) ; and two (3 %) studies used three categories(Reference Moghames, Hammami and Hwalla40,Reference Huybrechts, Vereecken and De Bacquer88) . In sixteen (24 %) of the studies, the used categories were not shown(Reference Byers, Trieber and Gunter24,Reference Lietz, Barton and Longbottom25,Reference Aguilar, Wengreen and Lefevre27,Reference Marcinkevage, Mayén and Zuleta33,Reference Hong, Dibley and Sibbritt41,Reference Julián-Almárcegui, Huybrechts and Gómez Bruton54,Reference Flood, Wen and Hardy59,Reference Hunsberger, O’Malley and Block60,Reference Nurul-Fadhilah, Teo and Foo63,Reference Field, Peterson and Gortmaker74–Reference Stein, Shea and Basch76,Reference Huybrechts, Börnhorst and Pala80,Reference Harnack, Lytle and Story93,Reference Kunaratnam, Halaki and Ming104,Reference Taylor, Lamparello and Kruczek106) and in five (7 %) of the studies the categories varied for each food item(Reference Watanabe, Yamaoka and Yokotsuka69,Reference Vereecken, Rossi and Giacchi71,Reference Borenstein, Hedges and Higgins82,Reference Samuelson, Bratteby and Enghardt100,Reference Bellú, Riva and Ortisi101) . Fifteen (22 %)(Reference Vioque, Gimenez-Monzo and Navarrete-Muñoz28,Reference Kaskoun, Johnson and Goran31,Reference Rodriguez, Smith and Villamor37,Reference Moghames, Hammami and Hwalla40,Reference Julián-Almárcegui, Huybrechts and Gómez Bruton54,Reference Martinez and Estima56,Reference Lillegaard, Overby and Andersen61,Reference Nurul-Fadhilah, Teo and Foo63,Reference Field, Peterson and Gortmaker74,Reference Appannah, Pot and O’Sullivan86,Reference Huybrechts, Vereecken and De Bacquer88,Reference Huybrechts, De Backer and De Bacquer90,Reference Stiegler, Sausenthaler and Buyken91,Reference Huybrechts, De Bacquer and Matthys94,Reference Taylor and Goulding99) studies used 1 year as the target period that the respondent was asked to recall; eight (12 %)(Reference Slater, Enes and López26,Reference Pérez-Cueto Eulert, Roberfroid and Kolsteren34,Reference Del Pino and Friedman35,Reference Moghames, Hammami and Hwalla40,Reference Xia, Sun and Zhang64,Reference Watanabe, Yamaoka and Yokotsuka69,Reference Robinson, Skelton and Barker75,Reference Borenstein, Hedges and Higgins82) studies used 6 months as the target period; three (4 %)(Reference Byers, Trieber and Gunter24,Reference Söderberg, Lind and Karlsland Åkeson29,Reference Andersen, Bere and Kolbjornsen96) used 3 months as the target period; one (1 %)(Reference Nyström, Henriksson and Alexandrou79) study used 2 months as the target period; fifteen (22 %)(Reference Fatihah, Ng and Hazwanie38,Reference Bel-Serrat, Mouratidou and Pala57,Reference Scagliusi, Garcia and Indiani62,Reference Kobayashi, Kamimura and Imai66,Reference Watanabe, Yamaoka and Yokotsuka69,Reference Jensen, Gustafson and Boushey72,Reference Robinson, Skelton and Barker75,Reference Leong, Taylor and Haszard78,Reference Huybrechts, Börnhorst and Pala80,Reference Dutman, Stafleu and Kruizinga81,Reference De Cock, Van Camp and Kolsteren84,Reference Di Noia and Contento89,Reference Zemel, Carey and Paulhamus92,Reference Harnack, Lytle and Story93,Reference Samuelson, Bratteby and Enghardt100) studies used 1 month as the target period; twelve (18 %)(Reference Aguilar, Wengreen and Lefevre27,Reference Marcinkevage, Mayén and Zuleta33,Reference Pérez-Cueto Eulert, Roberfroid and Kolsteren34,Reference Papadopoulou, Barboukis and Dalkiranis43,Reference Hunsberger, O’Malley and Block60,Reference Yaroch, Resnicow and Davis73,Reference Jenner, Neylon and Croft77,Reference Mulasi-Pokhriyal and Smith87,Reference Lambe, Kearney and Leclercrq98,Reference Crawford, Obarzanek and Morrison102,Reference Frank, Nicklas and Webber103,Reference Kunaratnam, Halaki and Ming104) studies used less than 1 month; and in thirteen (19 %)(Reference Lietz, Barton and Longbottom25,Reference Yum and Lee52,Reference Saeedi, Skeaff and Wong53,Reference Pampaloni, Bartolini and Barbieri58,Reference Flood, Wen and Hardy59,Reference Xia, Sun and Zhang64,Reference Vereecken, De Bourdeaudhuij and Maes67,Reference Vereecken, Covents and Maes68,Reference Vereecken, Rossi and Giacchi71,Reference Saloheimo, González and Erkkola85,Reference Haraldsdóttir, Thórsdóttir and Vaz De Almeida95,Reference Bellú, Riva and Ortisi101,Reference Vereecken and Maes105) studies, the target period was not shown.
Reference methods
The number of studies using the different relative validation approaches is reported in Fig. 2. Most studies (fifty-seven of sixty-seven) used a single dietary assessment method to compare the FFQ; eight studies combined two methods and two used three reference methods. The most widely used reference method was the 24Hr, twenty-three studies (35 %)(Reference Marcinkevage, Mayén and Zuleta33,Reference Del Pino and Friedman35,Reference Moghames, Hammami and Hwalla40,Reference Hong, Dibley and Sibbritt41,Reference Julián-Almárcegui, Huybrechts and Gómez Bruton54,Reference Martinez and Estima56,Reference Bel-Serrat, Mouratidou and Pala57,Reference Hunsberger, O’Malley and Block60,Reference Scagliusi, Garcia and Indiani62–Reference Xia, Sun and Zhang64,Reference Jensen, Gustafson and Boushey72–Reference Field, Peterson and Gortmaker74,Reference Stein, Shea and Basch76,Reference Jenner, Neylon and Croft77,Reference De Cock, Van Camp and Kolsteren84,Reference Mulasi-Pokhriyal and Smith87,Reference Stiegler, Sausenthaler and Buyken91,Reference Harnack, Lytle and Story93,Reference Bellú, Riva and Ortisi101,Reference Frank, Nicklas and Webber103,Reference Kunaratnam, Halaki and Ming104) ; followed by the FR, twenty-two studies (33 %)(Reference Marcinkevage, Mayén and Zuleta33,Reference Araujo, Yokoo and Pereira36,Reference Rodriguez, Smith and Villamor37,Reference Cohen51,Reference Yum and Lee52,Reference Bel-Serrat, Mouratidou and Pala57,Reference Pampaloni, Bartolini and Barbieri58,Reference Hunsberger, O’Malley and Block60,Reference Xia, Sun and Zhang64,Reference Vereecken, Covents and Maes68,Reference Watanabe, Yamaoka and Yokotsuka69,Reference Watson, Collins and Sibbritt70,Reference Borenstein, Hedges and Higgins82,Reference De Cock, Van Camp and Kolsteren84,Reference Saloheimo, González and Erkkola85,Reference Mulasi-Pokhriyal and Smith87,Reference Di Noia and Contento89,Reference Harnack, Lytle and Story93,97,Reference Lambe, Kearney and Leclercrq98,Reference Araujo, Veiga and Sichieri107) . Others methods were used in a minor numbers of studies (32 %)(Reference Byers, Trieber and Gunter24–Reference Söderberg, Lind and Karlsland Åkeson29,Reference Kaskoun, Johnson and Goran31,Reference Papadopoulou, Barboukis and Dalkiranis43,Reference Kobayashi, Kamimura and Imai66,Reference Watanabe, Yamaoka and Yokotsuka69,Reference Robinson, Skelton and Barker75,Reference Leong, Taylor and Haszard78–Reference Dutman, Stafleu and Kruizinga81,Reference Di Noia and Contento89,Reference Zemel, Carey and Paulhamus92,Reference Haraldsdóttir, Thórsdóttir and Vaz De Almeida95–97,Reference Samuelson, Bratteby and Enghardt100,Reference Crawford, Obarzanek and Morrison102) .
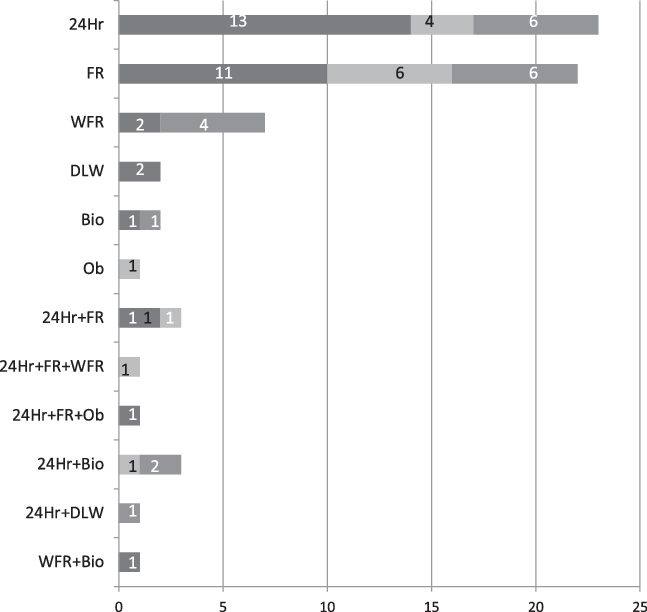
Fig. 2. Number of identified studies using the comparative dietary assessment method. ![]() , Nutrients;
, Nutrients; ![]() , food;
, food; ![]() , food and nutrients. 24Hr, 24-h record; FR, food record; WFR, weight food record; DLW, doubly labelled water; Bio, biomarkers; Ob, observation.
, food and nutrients. 24Hr, 24-h record; FR, food record; WFR, weight food record; DLW, doubly labelled water; Bio, biomarkers; Ob, observation.
Conclusions of the systematic review provided by authors of sixty-seven studies
In relation to the results obtained by the authors of the selected studies, using Cohen’s cut points(Reference Chan50,Reference Cohen51) , 2 % of the articles(Reference Slater, Enes and López26) concluded that the FFQ showed a very strong relative validity (>0·8) to assess food and nutrient intake in children and adolescents; 7 % of the studies(Reference Del Pino and Friedman35,Reference Martinez and Estima56,Reference Kobayashi, Kamimura and Imai66,Reference Jensen, Gustafson and Boushey72,Reference Dutman, Stafleu and Kruizinga81) concluded that the FFQ showed a moderately strong relative validity (0·6–0·8) to assess dietary intake in children and adolescents; 31 %(Reference Byers, Trieber and Gunter24,Reference Lietz, Barton and Longbottom25,Reference Araujo, Yokoo and Pereira36,Reference Fatihah, Ng and Hazwanie38,Reference Hong, Dibley and Sibbritt41,Reference Saeedi, Skeaff and Wong53,Reference Julián-Almárcegui, Huybrechts and Gómez Bruton54,Reference Bel-Serrat, Mouratidou and Pala57,Reference Lillegaard, Overby and Andersen61,Reference Scagliusi, Garcia and Indiani62,Reference Xia, Sun and Zhang64,Reference Sahashi, Tsuji and Wada65,Reference Vereecken, De Bourdeaudhuij and Maes67,Reference Watanabe, Yamaoka and Yokotsuka69,Reference Yaroch, Resnicow and Davis73,Reference Leong, Taylor and Haszard78,Reference Appannah, Pot and O’Sullivan86,Reference Di Noia and Contento89,Reference Harnack, Lytle and Story93,Reference Huybrechts, De Bacquer and Matthys94,Reference Kunaratnam, Halaki and Ming104) showed a fair relative validity (0·3–0·5) to assess intake and 4 %(Reference Vioque, Gimenez-Monzo and Navarrete-Muñoz28,Reference Stein, Shea and Basch76,Reference Andersen, Bere and Kolbjornsen96) stated that the FFQ had poor relative validity for dietary assessment in this population group. Of the studies, 20 %(Reference Rodriguez, Smith and Villamor37,Reference Papadopoulou, Barboukis and Dalkiranis43,Reference Yum and Lee52,Reference Pampaloni, Bartolini and Barbieri58–Reference Hunsberger, O’Malley and Block60,Reference Watson, Collins and Sibbritt70,Reference Vereecken, Rossi and Giacchi71,Reference Field, Peterson and Gortmaker74,Reference Huybrechts, Vereecken and De Bacquer88,Reference Huybrechts, De Backer and De Bacquer90,Reference Haraldsdóttir, Thórsdóttir and Vaz De Almeida95,Reference Vereecken and Maes105) obtained different values depending on the food or nutrient assessed and 36 %(Reference Aguilar, Wengreen and Lefevre27,Reference Söderberg, Lind and Karlsland Åkeson29,Reference Kaskoun, Johnson and Goran31–Reference Marcinkevage, Mayén and Zuleta33,Reference Kolodziejczyk, Merchant and Norman39,Reference Scagliusi, Garcia and Indiani62,Reference Vereecken, Covents and Maes68,Reference Field, Peterson and Gortmaker74,Reference Stein, Shea and Basch76,Reference Leong, Taylor and Haszard78,Reference Nyström, Henriksson and Alexandrou79,Reference Borenstein, Hedges and Higgins82–Reference De Cock, Van Camp and Kolsteren84,Reference Appannah, Pot and O’Sullivan86,Reference Huybrechts, De Backer and De Bacquer90,Reference Stiegler, Sausenthaler and Buyken91,97–Reference Crawford, Obarzanek and Morrison102) did not show results.
Summary of the results
Quality
Study quality was assessed using the standardised quality assessment checklist(47) proposed by the Academy of Nutrition and Dietetics in 2012. It was observed that all the studies, except two(Reference Papadopoulou, Barboukis and Dalkiranis43,Reference Bellú, Riva and Ortisi101) , were of a high quality (Table 5)(Reference Byers, Trieber and Gunter24–Reference Söderberg, Lind and Karlsland Åkeson29,Reference Kaskoun, Johnson and Goran31,Reference Marcinkevage, Mayén and Zuleta33–Reference Fatihah, Ng and Hazwanie38,Reference Moghames, Hammami and Hwalla40,Reference Hong, Dibley and Sibbritt41,Reference Papadopoulou, Barboukis and Dalkiranis43,Reference Yum and Lee52–Reference Julián-Almárcegui, Huybrechts and Gómez Bruton54,Reference Martinez and Estima56–Reference Kobayashi, Kamimura and Imai66,Reference Vereecken, Covents and Maes68–Reference Dutman, Stafleu and Kruizinga81,Reference Rahmawaty, Charlton and Lyons-Wall83–Reference Kunaratnam, Halaki and Ming104) . However, these two studies were included in the systematic review, as some of the checklist items did not apply to them; one was also included in the corresponding meta-analysis(Reference Papadopoulou, Barboukis and Dalkiranis43).
Table 5. Quality of studies that were included in the systematic review
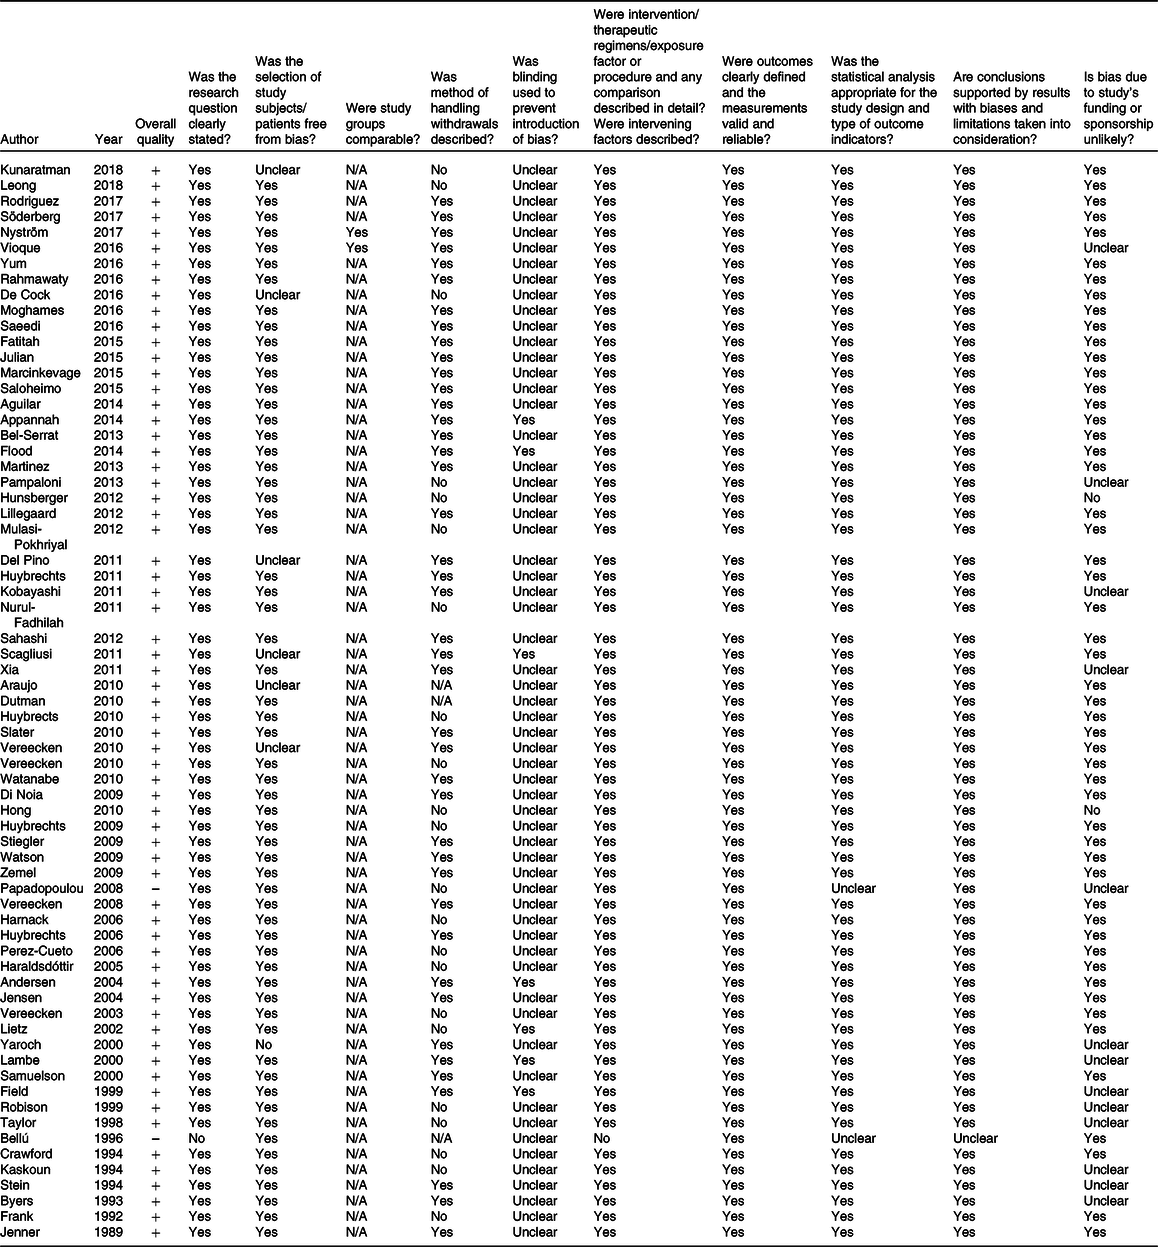
+, Positive quality; N/A, not applicable; –, negative quality.
The complete information extracted from the data analysis is available upon request from the corresponding author.
Meta-analysis
Meta-analysis was performed for energy, macronutrients and some micronutrients and food sources.
The meta-analysis performed included thirty-seven studies comparing the FFQ with another dietary assessment method (24Hr, FR and WFR) to estimate energy, CHO, protein, fat, fibre, Ca, Fe, Zn, vitamin A, vitamin C, meat, milk, fruit and vegetable intake(Reference Lietz, Barton and Longbottom25,Reference Vioque, Gimenez-Monzo and Navarrete-Muñoz28,Reference Söderberg, Lind and Karlsland Åkeson29,Reference Marcinkevage, Mayén and Zuleta33,Reference Del Pino and Friedman35,Reference Rodriguez, Smith and Villamor37,Reference Fatihah, Ng and Hazwanie38,Reference Moghames, Hammami and Hwalla40–Reference Papadopoulou, Barboukis and Dalkiranis43,Reference Yum and Lee52–Reference Julián-Almárcegui, Huybrechts and Gómez Bruton54,Reference Martinez and Estima56–Reference Sahashi, Tsuji and Wada65,Reference Vereecken, De Bourdeaudhuij and Maes67–Reference Nyström, Henriksson and Alexandrou79) .
Since we did not find statistical differences between younger children or caregivers and adolescents as respondents of the FFQ, the age of the category of the respondent was not taken in account for the meta-analysis.
Fig. 3 shows the results obtained for energy, Fig. 4(a–d) shows the results for CHO, protein, fat and fibre, Fig. 5(a–e) shows the results for Ca, Fe, Zn, vitamin A, and vitamin C, and Fig. 6(a–d) shows the results of the four food categories: meat, milk, fruits and vegetables.
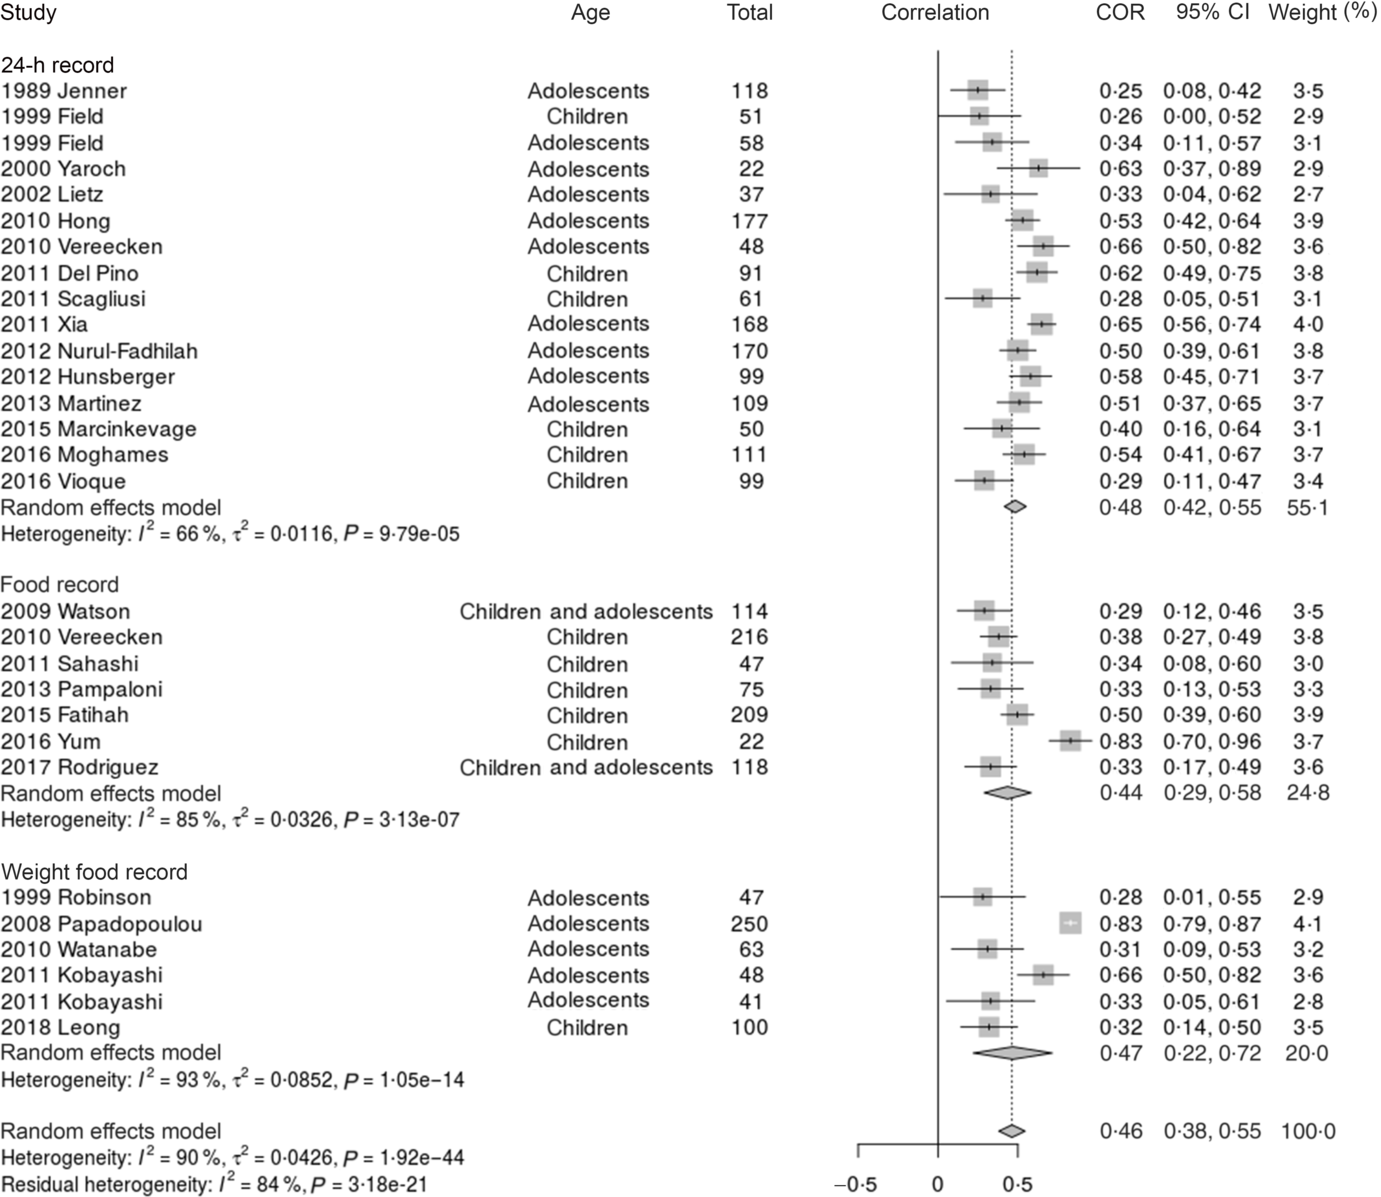
Fig. 3. Comparison of the FFQ with the 24-h record, the food record and the weight food record to estimate energy. COR, correlation.
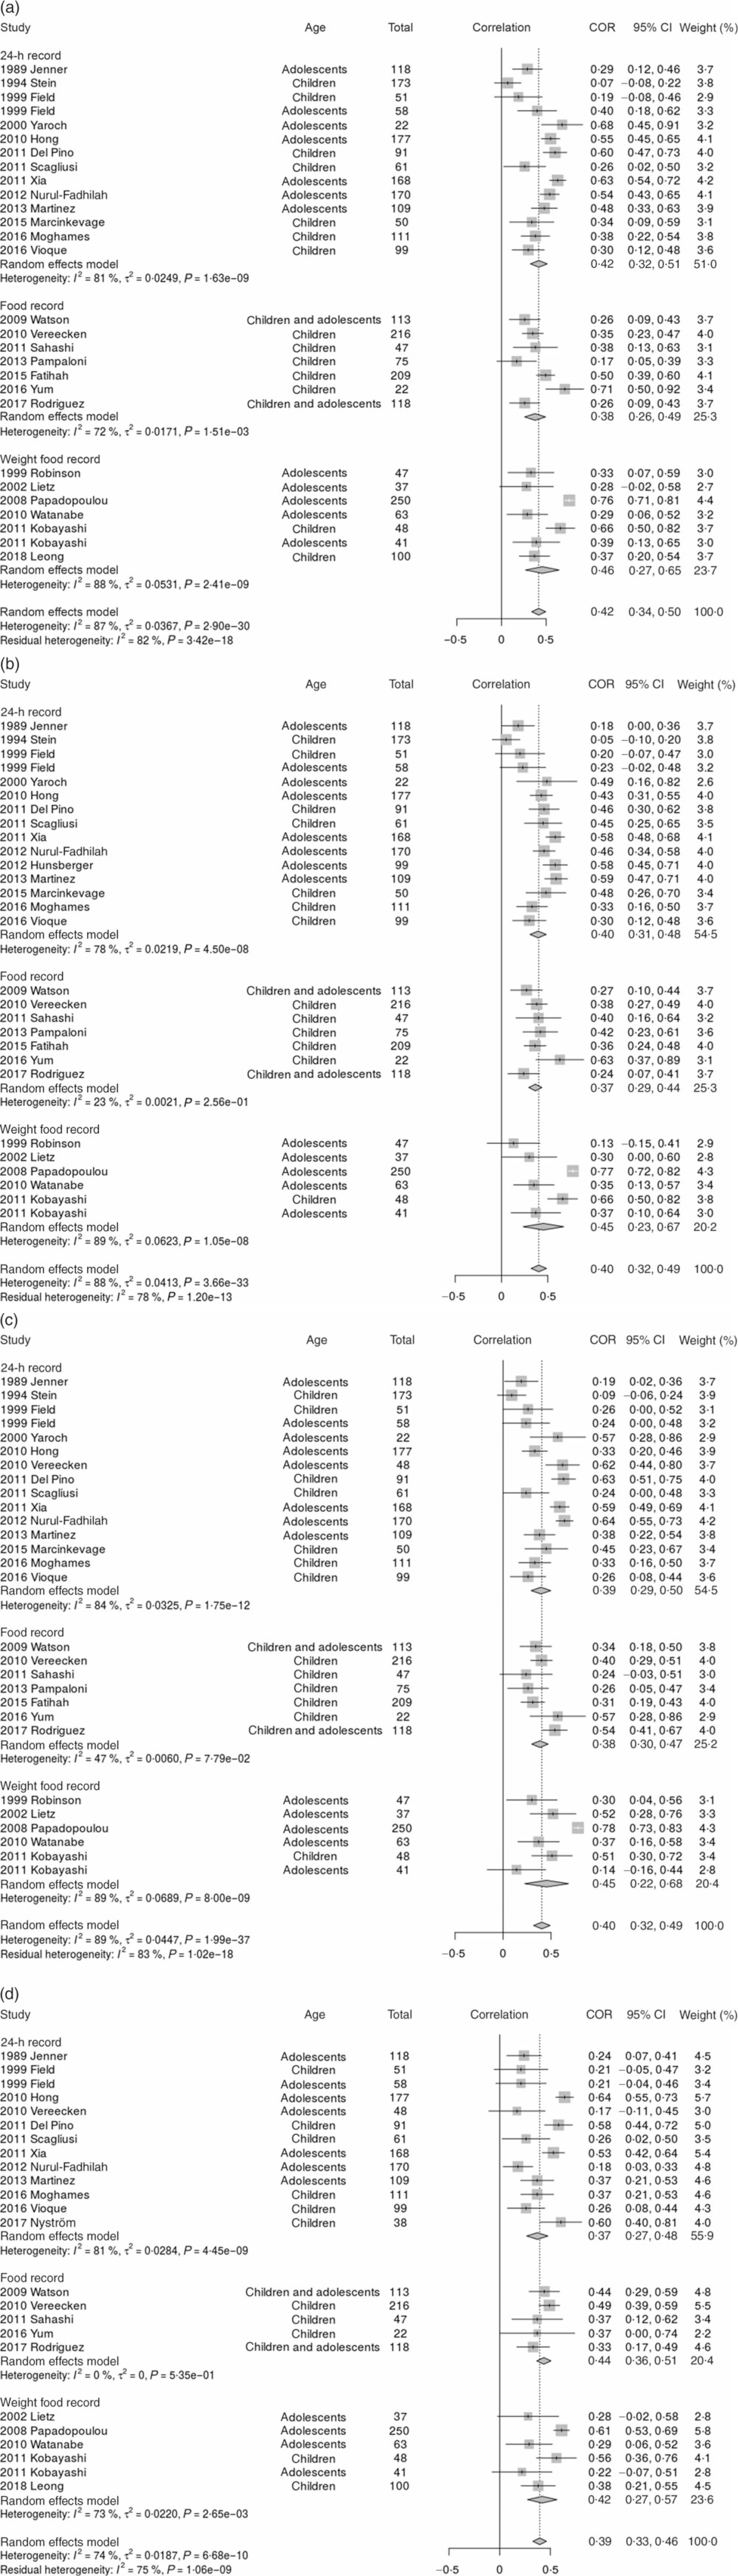
Fig. 4. (a) Comparison of the FFQ with the 24-h record, the food record and the weight food record to estimate carbohydrate. (b) Comparison of the FFQ with the 24-h record, the food record and the weight food record to estimate protein. (c) Comparison of the FFQ with the 24-h record, the food record and the weight food record to estimate fat. (d) Comparison of the FFQ with the 24-h record, the food record and the weight food record to estimate fibre. COR, correlation.

Fig. 5. (a) Comparison of the FFQ with the 24-h record, the food record and the weight food record to estimate calcium. (b) Comparison of the FFQ with the 24-h record, the food record and the weight food record to estimate iron. (c) Comparison of the FFQ with the 24-h record, the food record and the weight food record to estimate zinc. (d) Comparison of the FFQ with the 24-h record, the food record and the weight food record to estimate vitamin A. (e) Comparison of the FFQ with the 24-h record, the food record and the weight food record to estimate vitamin C.

Fig. 6. (a) Comparison of the FFQ with the 24-h record, the food record and the weight food record to estimate meat. (b) Comparison of the FFQ with the 24-h record, the food record and the weight food record to estimate milk. (c) Comparison of the FFQ with the 24-h record, the food record and the weight food record to estimate fruits. (d) Comparison of the FFQ with the 24-h record, the food record and the weight food record to estimate vegetables.
For most nutrients and food categories, the correlations were very similar whether the reference method was 24Hr, FR or WFR (although slightly better in the case of WFR), according to Figs. 3, 4(a–d), 5(a) and (b), and 6(b–d). The exceptions were Zn (with correlations of 0·42 for the 24Hr, 0·22 for the FR and 0·52 for the WFR), vitamin A (with correlations of 0·50 for the 24Hr, 0·27 for the FR and 0·50 for the WFR), vitamin C (with correlations of 0·42 for the 24Hr, 0·32 for the FR and 0·51 for the WFR) and meat (with correlations of 0·41 for the 24Hr, 0·24 for the FR and 0·44 for the WFR). For energy, Fig. 3 shows that the correlations were similar when the reference method was the 24Hr of 0·48, the FR of 0·44 and the WFR of 0·47. For milk, Fig. 6(b) shows that the correlations were similar when the reference method was the 24Hr of 0·58, the FR of 0·56 and the WFR of 0·57. For Fe, Fig. 5(b) shows that the correlations were similar when the reference method was the 24Hr of 0·45, the FR of 0·42 and the WFR of 0·44. For energy, milk and Fe, the method that yielded the highest correlations to validate the FFQ was the 24Hr (0·58 for milk, 0·48 for energy and 0·45 for Fe). For Ca, both FR and WFR had the same correlation coefficient of 0·52, which was like the correlation of 0·45 for the 24Hr, according to Fig. 5(a). For vitamin A, both 24Hr and WFR had similar correlation coefficient, which was 0·50.
In all cases, the overall correlation coefficients between the FFQ and the reference methods were between 0·35 (meat) and 0·56 (milk). The level of heterogeneity (I 2) was significant in all cases and stand between 73 % for vitamin A and 99 % for meat. This finding is consistent with the relative validity of the FFQ assessed with other methods described in the studies included in the meta-analysis.
Meta-regression
The study showed a high heterogeneity value (I 2) (values of I 2 over or equal to 75 %) for different variables obtained in the meta-analysis, so a search for outliers, sensitivity studies and meta-regression analysis was performed. In most cases, meta-regression was not significant for any of the analysed variables (publication year, publication world region, reference method, number of food item of the FFQ, period that was assessed with the FFQ and respondent of the FFQ).
Positive effects were found for Ca and protein with the variable publication year (Akaike’s information criterion = –23·669 for Ca and Akaike’s information criterion = –19·878 for protein). Negative effects were found for energy with the variable food item (Akaike’s information criterion = –23·103).
Discussion
To the best of our knowledge, this is the first systematic review and meta-analysis assessing the relative validity of FFQ to estimate energy, macronutrients, certain micronutrients and some food item intake in children and adolescents. In the meta-analysis reported in this article, the overall relative validity of energy, macronutrients (CHO, protein, fat and fibre), certain micronutrients (Ca, Fe, Zn, vitamin A and vitamin C) and some food categories (meat, milk, vegetables and fruits) intake estimation using the FFQ may be considered as weak (correlation coefficients between 0·35 and 0·56). However, three reference standard methods were used across studies. For most nutrients and food categories, the correlations were similar whether the reference method was 24Hr, FR or WFR.
It has been frequently said that there is no perfect measurement of dietary intake, with the implication that validation studies are not possible. The lack of a perfect standard is, however, not unique to dietary intake assessment method; all measurements entail uncertainty, although they differ in their magnitude. Thus, relative validation studies never compare an operational method with the absolute truth, but instead they compare one method with another method(Reference Willett1).
Relative validity of EI assessed with the FFQ when using the 24Hr, FR and WFR as the reference method can be considered as weak (correlation coefficients = 0·46). However, correlation coefficients cannot identify whether the FFQ is under- or over-estimating EI. Most of the studies assessing the relative validity of the FFQ to estimate EI report the difference in mean daily EI between methods but do not report the agreement or bias between them.
There are two studies assessing the validity of the FFQ against the DLW method(Reference Kaskoun, Johnson and Goran31,Reference Dutman, Stafleu and Kruizinga81) , which is considered the reference standard for studies validating EI; both studies produced different findings. Kaskoun et al. report that total EI assessed by a FFQ was significantly higher than total energy expenditure assessed with DLW (P > 0·001)(Reference Kaskoun, Johnson and Goran31), and Dutman et al. indicate that mean total EI, assessed with FFQ, did not differ significantly from total energy expenditure assessed with DLW (P > 0·15)(Reference Dutman, Stafleu and Kruizinga81).
The result of this meta-analysis showed a weak overall relative validity of energy, macronutrients, certain micronutrients and some food category intake estimation, using the FFQ (correlation coefficients between 0·35 and 0·56).
Strengths
In the search for evidence to answer the research questions, it is preferable to seek a systematic review, especially one that includes a meta-analysis. Single studies are responsible for being unrepresentative of the total evidence and might not be true. Systematic reviews include a wider range of subjects than any single study, potentially increasing confidence in the implementation of the outcome for the case in question. The meta-analysis of a set of tests includes a larger sample than a single study, leading to greater accuracy of estimates, which facilitates confident decision-making. This is especially pertinent to relative validation studies, as the sample sizes are often small. For this systematic review, we followed the Preferred Reporting Items for Systematic Reviews and Meta-Analyses protocol(Reference Liberati, Altman and Tetzlaff45) and the methodology suggested by the Academy of Nutrition and Dietetics, for the evidence analysis process, 2016(Reference Handu, Moloney and Wolfram46). Sixty-seven studies were found to assess relative validity of FFQ with other dietary assessment methods in children and adolescents and thirty-seven studies were included in the meta-analysis. Energy, but also macronutrients (CHO, protein, fat, and fibre), micronutrients (Ca, Fe, Zn, vitamin A and vitamin C) and some food items (meat, milk, fruits and vegetables) were analysed. Because of the high heterogeneity value (I 2) obtained in the meta-analysis, a meta-regression analysis was performed to assess the relationship between the FFQ and the other reference methods for energy, macronutrient (CHO, protein, fat and fibre), micronutrients (Ca, Fe, 11Zn, vitamin A and vitamin C) and some food categories (meat, milk, vegetables and fruits).
Despite of the weak performance of the FFQ, they are still recommended for epidemiological studies because of their low cost, they may be used in a self-administered format, they show the usual dietary intake over long periods of time, they can be used for many participants and they can compare dietary intake between different populations(Reference Willett1,Reference Saravia, González-Zapata and Rendo-Urteaga12,Reference Tabacchi, Amodio and Di Pasquale32,Reference Rendo-Urteaga, Saravia and Sadalla Collese108–Reference Tabacchi, Filippi and Amodio110) .
Limitations
When performing the systematic review, a lack of detailed information in the original articles included was identified. This jeopardised the inclusion of certain studies in the meta-analysis, as thirty out of sixty-seven were not statistically comparable.
In this systematic review in children and adolescents, only two studies validating EI with DLW were found and they obtained discrepant results. For biomarkers, seven studies validated the FFQ, but none of the studies could be compared with each other because they validated different micronutrients with differently measured biomarkers. Therefore, there is an urgent need to perform validation studies of EI using DLW as the reference standard and biomarkers (25-hydroxy vitamin D in plasma for vitamin D, blood samples for vitamin C, retinol and carotenoids, urine samples for Ca and K, among others) for macronutrients, micronutrients and foods. There is also a need to develop, validate and use modern tools (such as smartphones, mobile devices, applications or interactive software) to assess dietary intake.
Most of the studies only provided correlation coefficients as estimates of the relative validity of results obtained with the FFQ. However, correlation coefficients do not provide information on the potential misreporting of the FFQ. Other methods, such as the Bland–Altman plots, which assess the agreement between quantitative measurements across the range of intakes(Reference Cade, Thompson and Burley109), providing information on the agreement/bias of the results, should be used. This is also important in terms of identifying the relative validity of the method at individual or group level(Reference Börnhorst, Bel-Serrat and Pigeot111).
In meta-analysis, heterogeneity in results is expected because data from studies that are diverse usually encounter this limitation. It was suggested that there is not much sense in simply assessing heterogeneity, when what matters is the degree to which it affects the findings of the meta-analysis(Reference Hinnig, Mariath and Freaza112). As the heterogeneity in the performed meta-analysis was high, a meta-regression was performed.
Conclusion
The relative validity of the dietary assessment methods is a topic of current interest. FFQ are the preferred dietary assessment method in most epidemiological studies in children and adolescents mainly due to their low cost, ease of administration and the fact that they allow for people to be classified, considering a long period of food intake. However, all self-reporting methods of food intake are subject to errors and, therefore, validation studies, with the appropriate method, are required to assess the effect of measurement error and to avoid incorrect estimations wherever possible. From this systematic review, it can be concluded that, in children and adolescents, the FFQ has fair relative validity to assess dietary intake. The meta-analysis performed showed that overall relative validity of energy, macronutrients (CHO, protein, fat and fibre), some micronutrients (Ca, Fe, Zn, vitamin A and vitamin C) and some food item (milk, fruits and vegetables) intake estimation, using the FFQ, may be considered as weak.
Acknowledgements
L. S. was supported by a doctoral scholarship from the Carolina Foundation. I. I. is supported by RETICS founded by the PN I+D+I 2013-2016, ISCIII – Subdirección General de Evaluación y Fomento de la Investigación y el Fondo Europeo de Desarrollo Regional (FEDER), ref. RD16/0022. M. V. N.-F. received a PhD Student Internships Abroad scholarship from the National Council of Technological and Scientific Development (CNPq; proc. 200340/2015-8) and a Brazilian PhD Student scholarship from the São Paulo Research Foundation – FAPESP (proc. 2016/18436-8 and 2017/11732-3).
L. S. and L. A. M. were involved in the design and conducting of the study, the writing of the first draft paper, and critically reviewed the manuscript. L. S., M. L. M.-B. and I. I. were involved in the systematic review of the literature. G. P. and M. V. N.-F. were involved in the meta-analysis of the data. G. P. was involved in the meta-regression of the data. I. B. and B. S. critically reviewed the manuscript. All authors contributed to the writing and finally approved the submitted and published versions.
On behalf of all authors, the corresponding author states that there is no conflict of interest.


