Uric acid is the end product of purine metabolism. Increased production or reduced excretion of serum uric acid level causes hyperuricaemia (HUA) and gout(Reference Garrel, Verdy and PetitClerc1). Most patients with HUA are asymptomatic and do not receive treatment. HUA is the causative agent of gout(Reference Choi, Mount and Reginato2) and is an independent risk factor for cardiovascular events(Reference Hoieggen, Alderman and Kjeldsen3,Reference Holme, Aastveit and Hammar4) , hypertension(Reference Sundstrom, Sullivan and D’Agostino5), diabetes(Reference Bhole, Choi and Kim6), cancer(Reference Strasak, Rapp and Hilbe7) and renal disease(Reference Obermayr, Temml and Gutjahr8) and independently predicts myocardial infarction and premature death(Reference Fang and Alderman9). In recent decades, the prevalence of HUA has significantly increased in Western countries(Reference Uaratanawong, Suraamornkul and Angkeaw10). Economic growth and resulting lifestyle changes in China have rapidly increased the prevalence of HUA(Reference Liu, Zhang and Wang11,Reference Liu, Han and Wu12) . In particular, from 1980 to 2014, the prevalence of HUA increased from 1·4 % to 19·4 % in men and 1·3 % to 7·9 % in women(Reference Liu, Han and Wu12,Reference Chen, Du and Wang13) . Genetics, lifestyle, environment and diet are factors contributing to the development of HUA, and diet also plays a major role in the HUA management(Reference Singh, Reddy and Kundukulam14,Reference Zhang, Doherty and Bardin15) .
Seaweeds are an important dietary contributor in countries such as China, Japan, Korea and those in Southeast Asia. Historically, Chinese utilisation of seaweeds is one of the longest and most extensive of any country. In coastal northern China, the average household may consume seaweed two to three times a week and it is estimated that each year in China, 50 million kg of fresh and dried seaweed is used for food(Reference Abbott16). Epidemiological and experimental animal studies have suggested that seaweeds show hypocholesterolaemic, antithrombotic, antioxidant and antidiabetic effects and that seaweeds can reduce the prevalence of chronic diseases including obesity, coronary diseases, hyperlipidaemia, type 2 diabetes and cancer(Reference Iwai17–Reference Sharifuddin, Chin and Lim19). Seaweeds contain polysaccharides (20–76 % of dry weight), proteins (15–40 % of dry weight), mineral ions (36 % of dry weight) and n-3 fatty acids, usually EPA and DHA. Finally, one of the principal nutritional characteristics of seaweeds is their high antioxidant content, such as polyphenols and carotenoids(Reference Brown, Allsopp and Magee18,Reference Lordan, Ross and Stanton20,Reference Rajapakse and Kim21) . Previous studies have suggested that antioxidants significantly reduced xanthine oxidase activity and expression in liver, as well as decreased urate-anion transporter 1 expression, increased organic anion transporter 1 and 3 expressions, and thus inhibited the uric acid production and reabsorption and enhanced urate secretion(Reference Chen, Tan and Li22,Reference Coulibaly, Kiendrebeogo and Kehoe23) .
To date, studies on the contribution of dietary seaweeds to uric acid levels and HUA are limited. Additionally, current understanding of the health-promoting activities of seaweeds is derived mainly from in vitro studies and in vivo animal studies. Therefore, we designed a cross-sectional study to explore whether consumption of seaweeds is related to HUA in a large-scale adult population.
Materials and methods
Participants
Tianjin Chronic Low-grade Systemic Inflammation and Health cohort is a prospective dynamic cohort focusing on the relationship between chronic low-grade inflammation and the health status of a population living in Tianjin(Reference Sun, Wu, Zhang and Wang24), a city which is located in the North China, east of Bohai Sea, with approximately 15·59 million inhabitants. Participants who had received health examinations had completed questionnaires regarding their smoking and alcohol consumption habits and disease history over the course of January 2007 to December 2016. Moreover, a structured lifestyle questionnaire was administered to randomly selected subjects from this population since May 2013. The protocol of this study was approved by the Institutional Review Board of the Tianjin Medical University, and participants gave written informed consent prior to participation in the study.
This cross-sectional study used data from Tianjin Chronic Low-grade Systemic Inflammation and Health cohort ranging from 2013 to 2016. The participant selection process is described in Fig. 1. During the survey period, there were 37 988 subjects aged over 18 years who had received health examinations and handgrip strength test and participants were asked to answer questionnaires that included questions relating to their lifestyle and provided written informed consent for their data to be analysed. We excluded participants with incomplete measurement results and questionnaires (n 3707), or those with a history of CVD (n 1652) or cancer (n 264). As a result of these exclusions, the final cross-sectional study population comprised 32 365 subjects.
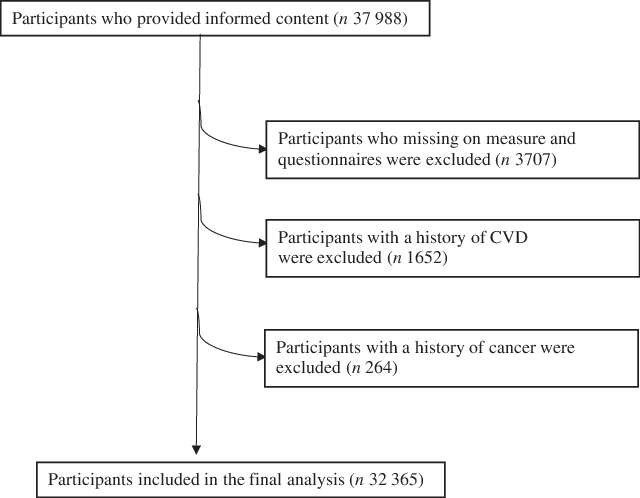
Fig. 1 Flow diagram showing the selection of the study population
Uric acid assessment
A fasting venous blood sample with fasting time longer than 8 h was collected from the antecubital vein, while subjects were in the sitting position. Serum uric acid levels were measured by an enzymatic colorimetric test using the Roche 912 analyzer (Roche Diagnostics); the lower limit of detection was 0·2 mg/dl. HUA was defined as uric acid levels >420 μmol/L in men and >350 μmol/L in women(Reference Li, Qin and Xie25).
Dietary assessment
Dietary intake was assessed using a FFQ with specified serving sizes that were described by natural portions or standard weight and volume measures of the servings commonly consumed in this study population(Reference Yu, Yu, Su and Zhang26). For the assessment of dietary intake, data were based on a validated eighty-one-item self-administered FFQ (including fruits, vegetables, animal food, seafood, sugared beverages, teas, refined grain and grain products, etc.). The participants were asked how often (almost never, <1 time/week, 1 time/week, 2–3 times/week, 4–6 times/week, 1 time/d and ≥2 times/d) they had eaten specific food items over the last month. The reproducibility and validity of the questionnaire were assessed in a random sample of 150 participants from our cohort using data from repeated measurements of the FFQ approximately 3 months apart and 4-d weighed diet records. The Spearman correlation coefficients between FFQ and weighed diet record were 0·49 for energy intake and 0·35–0·54 for nutrients (vitamin C, vitamin E, polyunsaturated fats, saturated fats, carbohydrate and Ca). Spearman’s rank correlation coefficients between two FFQ were 0·68 for energy intake, 0·62–0·79 for food items (fruits, vegetables, sweet foods and beverages) and 0·61 for seaweeds. Energy and nutrient intakes were calculated by using an ad hoc computer programme developed to analyse the FFQ.
The FFQ included an item about typical seaweed intake and contained seven frequency categories for seaweeds (Wakame, Konbu, Nori and more): almost never or rarely, <once per week, once per week, 2–3 times/week, 4–6 times/week, 1 time/d and ≥2 times/d. Consumption of seaweeds was calculated by multiplying portion sizes by the frequency at which each food item was consumed per d. To correct for potential measurement error, total seaweed consumption was adjusted for total energy intake according to the nutrient density method and expressed as g/1000 kcal per d(Reference Willett, Howe and Kushi27). For analysis, we summarised the categories of seaweeds in quantiles in the following way: <0·52 g/1000 kcal per d for level 1, 0·52–0·93 g/1000 kcal per d for level 2, 0·94–1·55 g/1000 kcal per d for level 3 and >1·55 g/1000 kcal per d for level 4 in males; and <0·47 g/1000 kcal per d for level 1, 0·47–0·87 g/1000 kcal per d for level 2, 0·88–1·52 g/1000 kcal per d for level 3 and >1·53 g/1000 kcal per d for level 4 in females.
The nutrient database was from the valid and reliable Chinese Food Composition Tables, and we analyse the questionnaire by using an ad hoc computer programme. By combining the information obtained from the FFQ with the Chinese Food Composition Tables, total energy intake for each participant was computed. Factor analysis (principal component analysis) was used to derive dietary patterns and to determine factor loadings for each of the food and beverages subgroups (in g/d). Evaluation of the eigenvalues and scree plot test was used in determining the number of retained factors. Varimax rotation was used to maintain uncorrelated factors and enhance interpretability. After evaluation of eigenvalues (>1·0) and the screen test, three factors were determined. Food items with a factor loading >|0·30| were the main contributors to dietary pattern and representative of the character of each pattern. Factors were named descriptively according to the food items showing high loading (absolute value) with respect to each dietary pattern as follows: ‘sweet food pattern (factor 1), healthy pattern (factor 2), and animal food pattern (factor 3)’. Similar dietary patterns were also observed in our previous study(Reference Xia, Wang and Yu28). For each of the dietary patterns, a higher score indicates stricter adherence to that dietary pattern.
Assessment of other variables
Levels of fasting blood glucose were measured by glucose oxidase method. As for lipids, TAG and total cholesterol were measured by enzymatic methods. LDL was measured by the polyvinyl sulphuric acid precipitation method, and HDL was measured by the chemical precipitation method using appropriate kits on a Cobas 8000 analyzer (Roche). Blood pressure (BP) was measured twice at the upper left arm using an automatic device (TM-2655P, A&D Company, Ltd) after 5 min of rest in a sitting position. The BP value was the mean of these two measurements. Waist circumference was measured at the umbilical level with participants standing and breathing normally. The metabolic syndrome was defined in accordance with the criteria of the American Heart Association scientific statements of 2009(Reference Alberti, Eckel and Grundy29). Participants were considered to have the metabolic syndrome when they presented three or more of the following components: (1) elevated waist circumference for Chinese individuals (≥85 cm in males; ≥80 cm in females), (2) elevated TAG (≥1·7 mmol/l), or drug treatment for elevated TAG, (3) reduced HDL (<1·0 mmol/l in males; <1·3 mmol/l in females) or drug treatment for reduced HDL, (4) elevated BP (systolic BP ≥ 130 mmHg and/or diastolic BP ≥ 85 mmHg) or antihypertensive drug treatment and (5) elevated fasting glucose (≥5·56 mmol/l) or drug treatment for elevated glucose.
The anthropometric variables (height and body weight) were recorded using a standard protocol. The BMI was calculated by dividing the weight in kg by the square of the height in metres. Physical activity (PA) was evaluated by using the short form of the International Physical Activity Questionnaire(Reference Qu and Li30). The questionnaire surveyed whether subjects had performed any type of activities during the previous week: walking, moderate activity (household activity, riding or child care), vigorous activity (running, swimming or other sports activities). Metabolic equivalent h/week was calculated using corresponding metabolic equivalent coefficients (3·3, 4·0 and 8·0) according to the following formula: metabolic equivalent coefficient of activity × duration (h) × frequency (d). Total PA levels were assessed by combining separate scores for different activities. The other information including demographical and socio-economic characteristics, physical health status, lifestyle and health-related factors were collected using the health status questionnaire.
Statistical analysis
All statistical analyses were performed by using the Statistical Analysis System 9.3 edition for Windows (SAS Institute Inc.). Males and females were analysed separately in this study because of the significant difference of prevalence of HUA and eating habits in each sex(Reference Steele, Dobson and Alexander31,Reference Dong, Zhang and Wang32) . The frequency of seaweeds consumption was used as independent variable in three categories, and HUA was used as dependent variable. Data were expressed as the mean (95 % CI) for continuous variables and percentages for categorical variables. Because the distribution of all continuous variables was non-normal, the natural logarithm was applied to normalise the data before ANOVA and multiple logistic regression analysis. The association between seaweeds consumption categories and prevalence of HUA was examined by multiple logistic regression analysis after adjustment for covariates: Model 1 was adjusted for age and BMI. Model 2 was additionally adjusted for smoking status, alcohol consumption status, socio-economic status (including education level, employment status and household income per month), PA and family or individual history of disease (hypertension, hyperlipidaemia, diabetes). Model 3 (full model) was additionally adjusted for total energy intake, sweet food pattern score, healthy pattern score and animal food pattern score. Multiple linear regression models, adjusting for the same covariates (models 1, 2 and 3), were also used to evaluate the association between serum uric acid level and intakes of seaweeds. To avoid potentially arbitrary categorisation, restricted cubic splines evaluated the likelihood of HUA in each participant according to the factors evaluated(Reference Desquilbet and Mariotti33). Non-linearity was tested using the likelihood ratio, comparing the model with only the linear term with the model with both linear and cubic spline terms. We specified three knot positions at the 5th, 50th and 90th percentiles of seaweeds consumption. The reference level was set to the lower value of seaweeds consumption. OR and 95 % CI were calculated. All P values for linear trends were calculated by using the categories of seaweeds consumption (almost never, <1 time/week, 1 time/week and ≥2–3 times/week). All tests were two-tailed, and P < 0·05 was defined as statistically significant.
Results
Participant characteristics delineated by sex are summarised in Table 1. A total of 32 365 participants (17 328 men and 15 037 women) were enrolled in the cross-sectional study, and the prevalence of HUA was 14·10 % (21·17 % in men and 5·93 % in women). Compared with females, males had a higher BMI, total cholesterol, TAG, LDL, systolic BP, diastolic BP and fasting blood glucose. They were also more likely to engage in PA, consumed more total energy and had higher sweet food pattern score and animal food pattern score. In addition, males were more likely to be smokers and drinkers. Compared with females, males were more highly educated, were more likely to be managers, had a higher income and had a higher prevalence of hypertension, hyperlipidaemia and diabetes.
Table 1. Participant characteristics by sex (Odds ratios and 95 % confidence intervals; percentages, n 32 365) (Percentages; Odds ratio and 95 % confidence intervals)
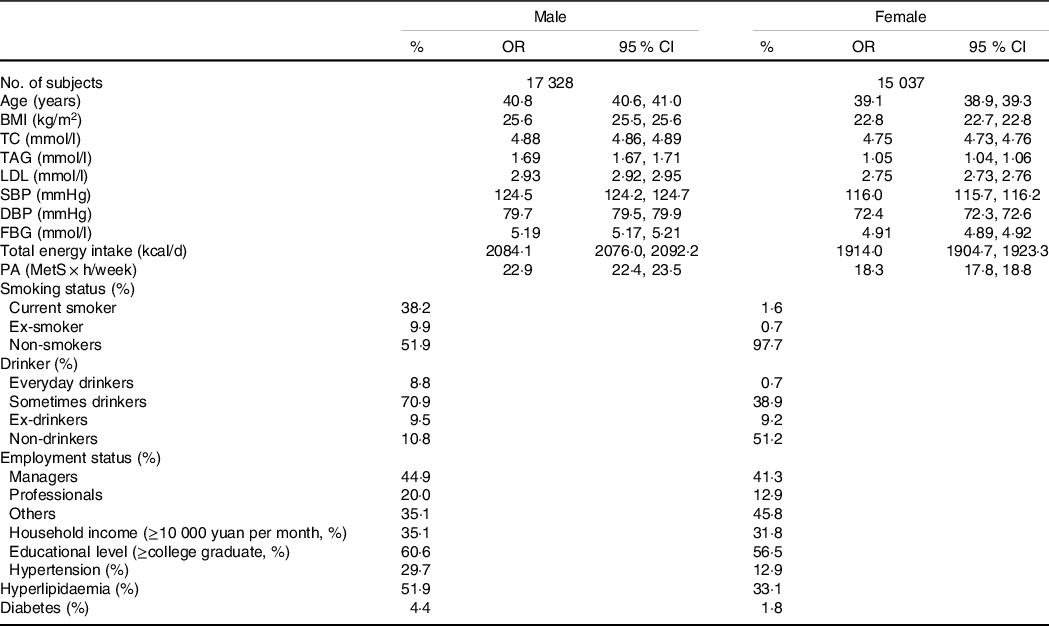
TC, total cholesterol; SBP, systolic blood pressure; DBP, diastolic blood pressure; FBG, fasting blood glucose; PA, physical activity; MetS, metabolic syndrome.
The relationship between the categories of seaweeds consumption (g/1000 kcal per d) and HUA is presented in Table 2. In males, the prevalence of HUA decreases across the increased consumption of seaweeds in all models. The OR (95 % CI) for HUA across seaweeds consumption categories in the final multivariate models were 1·00 (reference), 0·91 (95 % CI 0·81, 1·02) for level 2 (P = 0·24); 0·90 (95 % CI 0·81, 1·01) for level 3 (P = 0·19); 0·86 (95 % CI 0·78, 0·97) for level 4 (P = 0·02), and significant relationships were observed between the highest category of seaweeds consumption and HUA. In females, the OR (95 % CI) for HUA across seaweeds consumption categories in the final multivariate models were 1·00 (reference), 0·91 (95 % CI 0·73, 1·10) for level 2 (P = 0·35); 0·82 (95 % CI 0·67, 1·00) for level 3 (P = 0·06); 0·84 (95 % CI 0·68, 1·03) for level 4 (P = 0·09).
Table 2. Adjusted associations of energy-adjusted seaweeds consumption with hyperuricaemia (Odds ratio and 95 % confidence intervals, percentages, n 32 365)*
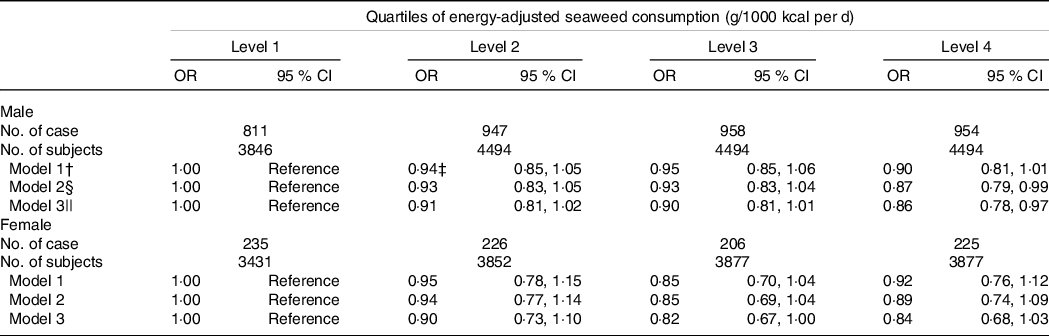
* Obtained by using multiple logistic regression analysis.
† Adjusted for age and BMI.
‡ OR (95 % CI) (all such values).
§ Additionally adjusted for smoking status, alcohol consumption status, education level, employment status, household incomes, physical activity, hypertension, hyperlipidaemia and diabetes.
|| Additionally adjusted for total energy intake and dietary patterns.
Multiple linear regression models were used to confirm the association between seaweeds consumption and serum uric acid level (Table 3). After adjusting for multiple confounding factors, significant associations between seaweeds consumption and serum uric acid level in males (standard regression coefficient = –0·017, P = 0·02) were observed. However, we found no significant association in females (standard regression coefficient = –0·01, P = 0·11).
Table 3 Adjusted associations of energy-adjusted seaweeds consumption with serum uric acid levels (n 32 265) (β-coefficients and standard errors)
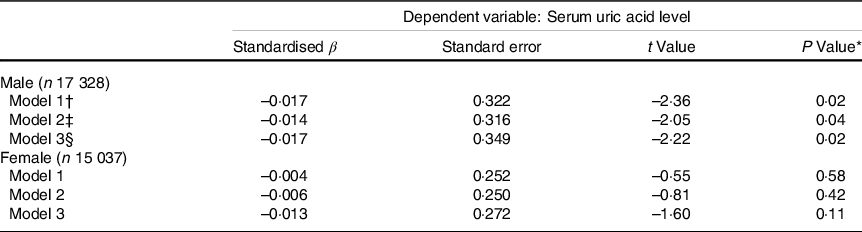
* Multiple linear regression model.
† Adjusted for age and BMI.
‡ Additionally adjusted for smoking status, alcohol consumption status, education level, employment status, household incomes, physical activity, hypertension, hyperlipidaemia and diabetes.
§ Additionally adjusted for total energy intake and dietary patterns.
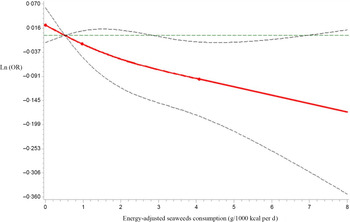
Next, we analysed seaweeds consumption as a continuous variable using restricted cubic spline models to further confirm the relationship between seaweeds consumption and HUA by sex. As shown in Figure 2, as the seaweeds consumption increased, Ln(OR) for HUA displayed decreasing trends in males (P for the non-linear association = 0·60, P for overall association = 0·05). However, no significant trends in correlations between seaweeds consumption and HUA were observed in females (P for the non-linear association = 0·16, P for overall association = 0·37, Fig. 3)

Fig. 2 Restricted cubic spline models representing the associations of seaweeds consumption (g/1000 kcal per d) with OR for prevalence of hyperuricaemia (HUA) in males, after adjusting for age, BMI, smoking status, alcohol consumption status, education level, employment status, household incomes, physical activity, hypertension, hyperlipidaemia, diabetes, total energy intake and dietary patterns (seaweeds intake was not included in the calculation). The reference value for seaweeds consumption (g/1000 kcal per d) was 0·52 g/1000 kcal per d. The three knots were set at 5th, 50th and 95th percentiles. Estimation; ![]() Lower_CL;
Lower_CL; ![]() Upper_CL;
Upper_CL; ![]() knots
knots
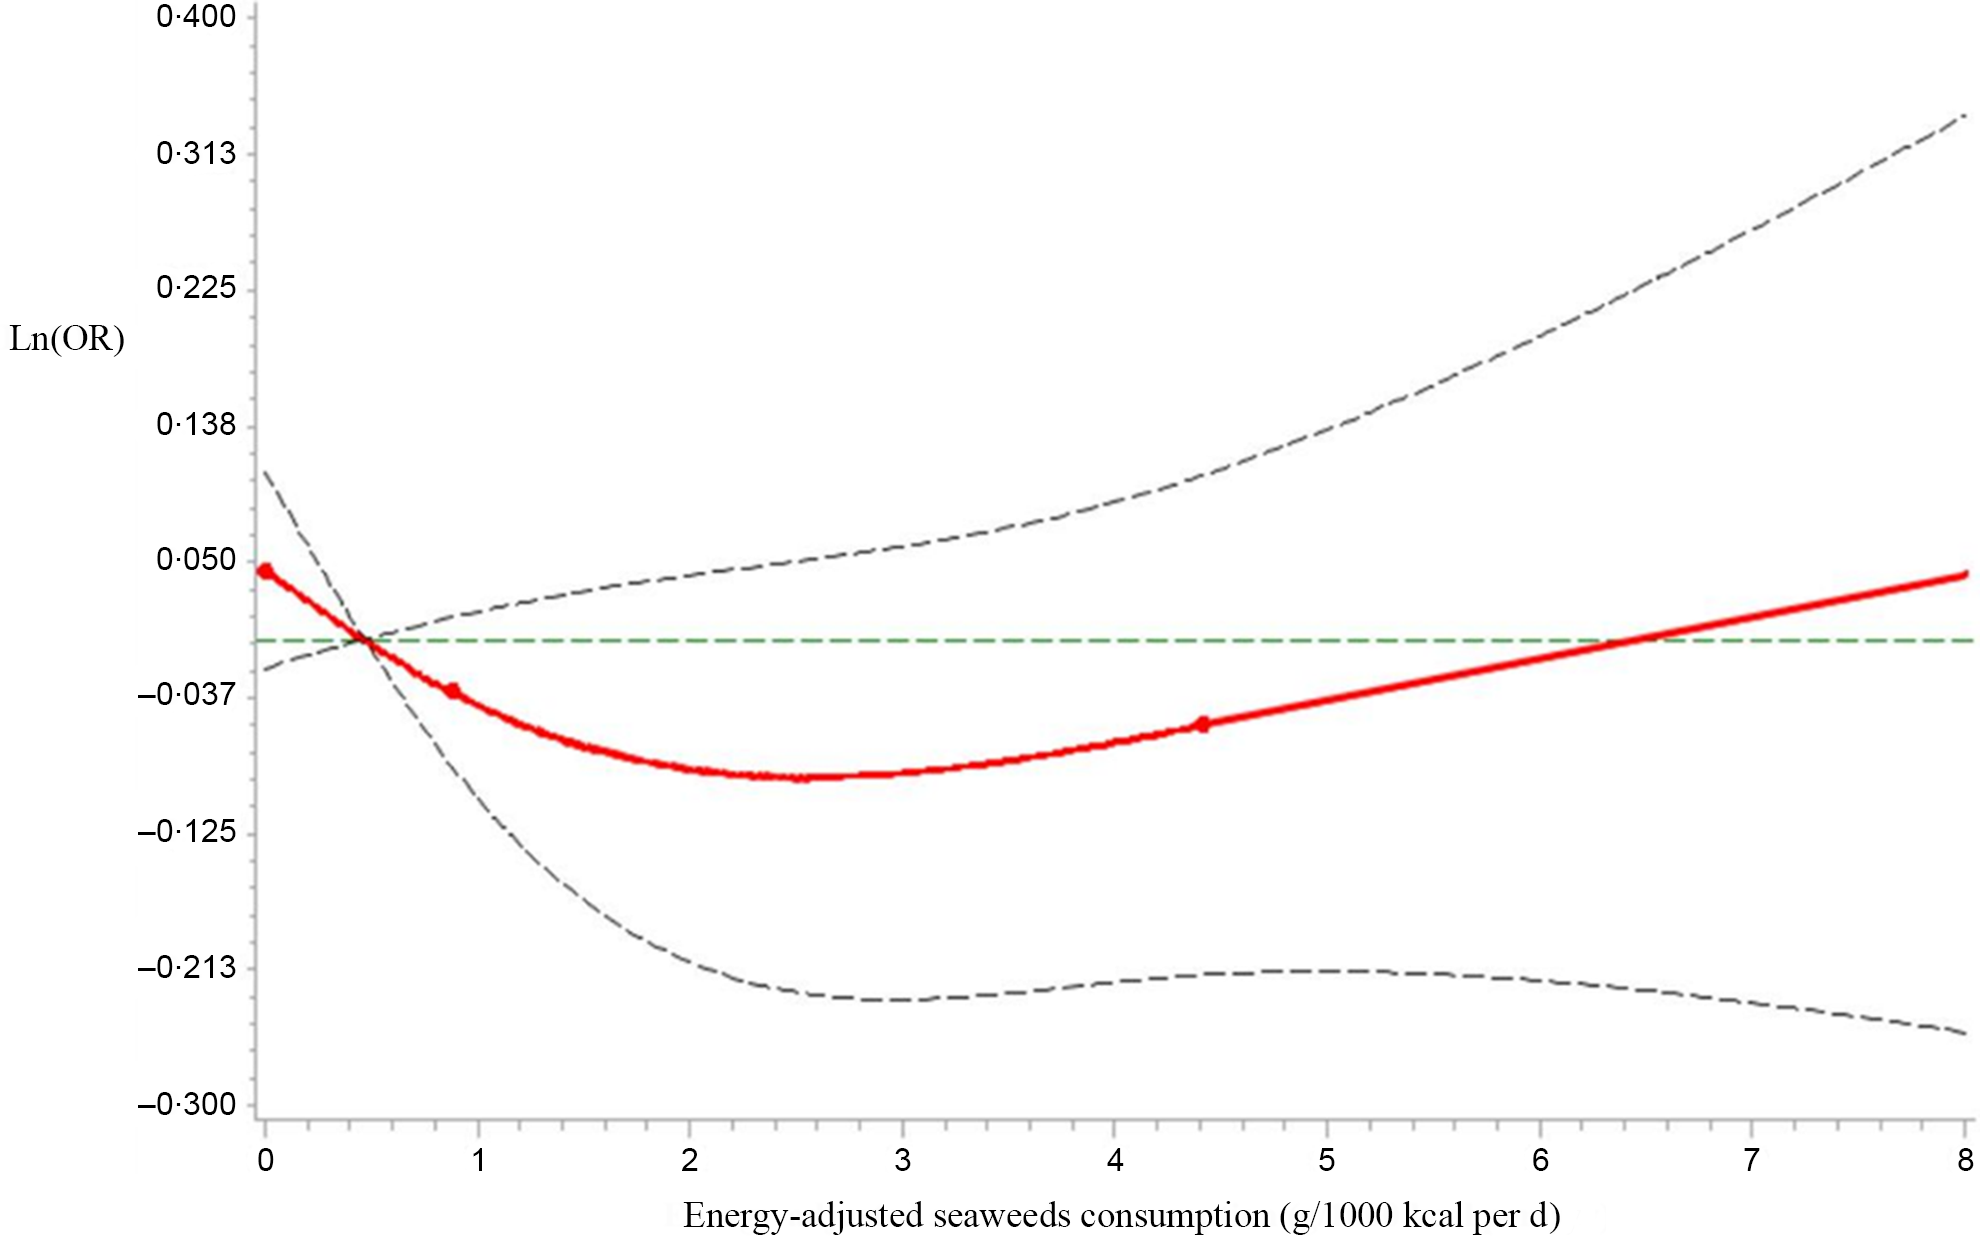
Fig. 3 Restricted cubic spline models representing the associations of seaweeds consumption (g/1000 kcal per d) with OR for prevalence of hyperuricaemia (HUA) in males, after adjusting for age, BMI, smoking status, alcohol consumption status, education level, employment status, household incomes, physical activity, hypertension, hyperlipidaemia, diabetes, total energy intake and dietary patterns (seaweeds intake was not included in the calculation). The reference value for seaweeds consumption (g/1000 kcal per d) was 0·47 g/1000 kcal per d. The three knots were set at 5th, 50th and 95th percentiles. Estimation; ![]() Lower_CL;
Lower_CL; ![]() Upper_CL;
Upper_CL; ![]() knots
knots
Discussion
While previous studies have underlined the beneficial effects of seaweeds consumption on human health, to the best of our knowledge, no study has assessed the effect of seaweeds consumption on HUA in humans. The present study was the first to discover that higher seaweeds consumption was significantly related to lower prevalence of HUA in males. This effect was not observed in females.
We adjusted for multiple potentially confounding factors in our analysis. First, since studies have shown that HUA is related to age(Reference Ryckwaert, Dry and Paolaggi34) and BMI(Reference Dalbeth, Phipps-Green and House35), we adjusted for these two variables. Second, sociodemographic factors, lifestyle factors, chronic diseases and nutritional status(Reference McAdams-DeMarco, Law and Maynard36,Reference Raja, Kumar and Aahooja37) can also influence the relationship between seaweeds and HUA; thus, we subsequently adjusted for smoking status, alcohol consumption status, education level, employment status, household incomes, PA, hypertension, hyperlipidaemia, diabetes and total energy intake. However, the adjustment for these factors did not change the significant relationship between seaweeds consumption and HUA. Finally, to avoid dietary factors influencing the results, we additionally adjusted for dietary pattern. After all adjustments were made, the observed association between seaweeds consumption frequency and HUA was not confounded by covariates.
Although the exact mechanisms of seaweeds consumption in HUA have not been elucidated, biologically active ingredients in seaweeds might be the candidates for this negative relationship in males. Ingredients of seaweeds contain proteins, polysaccharides, dietary fibre, polyphenols and various micronutrients, such as antioxidants(Reference Lordan, Ross and Stanton38). First, the kidney is crucial for the uric acid excretion, about 2/3 of uric acid is excreted via urination in the kidney, decreased renal function aggravates uric acid excretion impairment(Reference Liu, Sun and Zhang39). Seaweed polysaccharides have been shown to have good repair and protective effect on kidney cells and a significant effect on promoting the excretion of uric acid(Reference Jia, Wu and Li40). Second, one of the principal nutritional characteristics of seaweeds is high polyphenol antioxidant content(Reference Lordan, Ross and Stanton38). Polyphenols may prevent uric acid disorder through the following mechanisms: (i) inhibit xanthine oxidase and reduce serum or liver uric acid synthesis(Reference Mittal, Phillips and Loveday41), (ii) increase excretion of uric acid and prevent kidney reabsorption(Reference Zhang, Su and Luo42) and (iii) ameliorate uric acid excretion via the intestine(Reference Kamatani, Matsuda and Okada43). Third, evidence suggested that natural carotenoid extracted from the plants ameliorated inflammation in kidneys and lowered uric acid levels by reducing the levels of TNF-α and IL-1β (Reference Ma, Zhang and Tian44). Further studies will be required to clarify the exact mechanisms of seaweeds consumption in HUA.
The present study first assessed the relationship between seaweeds consumption and HUA in a large-scale adult population. Furthermore, we controlled for various potential confounders, such as age, BMI, smoking status, alcohol consumption status, education level, employment status, household incomes, PA, hypertension, hyperlipidaemia, diabetes, total energy intake and dietary pattern.
In this study, since sex-specific differences were observed in HUA(Reference Peichl45), we analysed the relationship between seaweeds consumption and HUA by sex. Our results showed a negative relationship between seaweeds consumption and HUA in males but not in females (see Table 2). Although detailed molecular mechanisms remain unclear, seaweeds are found to associate with decreased plasma oestradiol level(Reference Skibola46). Because the effects of oestradiol on uric acid were different for males and females(Reference Yahyaoui, Esteva and Haro-Mora47), the seaweeds consumption-inducing oestradiol may partly explain the differences in the correlation between seaweeds consumption and HUA in males and females.
Some limitations merit further discussion. First, the relationship between seaweeds consumption and HUA comes from a cross-sectional design, which does not allow for causal relationships, since the temporal relationships of these events cannot be determined, and further longitudinal studies will be needed for confirmation. Second, even though many potential confounders have been taken into consideration, there are still other factors which might confound the association between seaweeds and HUA, which have not been fully captured. Third, potential recall bias exists, which occurs when subjects fail to recall the frequency in which they completed the FFQ, and this recall bias could affect the results.
Conclusion
In conclusion, this study revealed that a higher consumption of seaweeds can reduce the prevalence of HUA in males but not in females in a large-scale adult population. This finding suggested that the consumption of seaweeds may have a potentially beneficial effect on reducing the prevalence of HUA. A prospective study or randomised trials are required to clarify the causality.
Acknowledgements
The authors gratefully acknowledge all the people that have made this study.
This study was supported by grants from the National Natural Science Foundation of China (no. 91746205, 81941024, 81872611, and 81673166).
The authors’ responsibilities were as follows: T. Z. and Y. W. analysed the data and wrote the paper. T. Z., Y. W., Y. G., G. M., Q. Z., L. L., H. W., S. Z., X. W., S. S., X. W., M. Z., H. J., Q. J., K. S. and Y. W. conducted research. K. N. designed the research and had primary responsibility for final content. All authors had full access to all the data in the study and read and approved the final manuscript.
None of the authors has any potential conflict of interest.