


Hypertension is a condition when the circulated blood creates persistent level of high blood pressure (BP) on artery walls. Usually, having such a condition at the early ages of life is ignored because no health condition or illness comes to notice. In long term, this condition may catalyse the development of several non-communicable diseases(Reference Vasan, Massaro and Wilson1). Elevated blood pressure (EBP) or hypertension is a modifiable risk factor for CVD related to high healthcare costs, morbidity and mortality worldwide(Reference Kearney, Whelton and Reynolds2–Reference Mills, Stefanescu and He4). Hypertension, unlike most diseases, has no immediate symptom and dubbed as the ‘silent killer’(Reference Chockalingam5). It is estimated that 1·13 billion adults worldwide were diagnosed with hypertension in 2015, with men outnumbering women(Reference Zhou, Bentham and Di Cesare6). The global prevalence of hypertension is predicted to reach 1·56 billion adults by 2025(Reference Kearney, Whelton and Reynolds2). However, hypertension control among young adults is almost 1·4 times less prevalent compared with middle-aged and older (>40 years) people(Reference Go, Mozaffarian and Roger7–Reference Johnson, Thorpe and Bartels9). Adults in low- and middle-income countries have a higher prevalence of hypertension than adults in high-income countries(Reference Zhou, Bentham and Di Cesare6).
Bangladesh, a South Asian low-middle-income country, has experienced a substantial hypertension burden among young adults(10). Evidence from a meta-analysis of observational studies reveals that high BMI is a risk factor of EBP or hypertension(Reference Jayedi, Rashidy-Pour and Khorshidi11). Previous research in Bangladesh has found that having a high BMI (or being overweight/obese) is linked to having high BP or being hypertensive in adults(Reference Abdul, Chowdhury and Uddin12–Reference Iqbal, Ahsan and Jamil14). However, these associations have been studied primarily in adult populations, and thus, studies on the influence of high BMI (or overweight/obesity) on BP among young adults globally and in Bangladesh are limited. The scarcity of available data, particularly in Bangladesh, has resulted in a limited number of studies among young adults.
The age range of young adults varies across jurisdictions. This study considered young adults between the ages of 18 and 24 years in accordance with the National Center for Education Statistics in the USA(Reference Aud, Kewalramani and Frohlich15). Young adults (aged 10–24 years) represent a significant proportion of Bangladesh’s population, about 29 million, or 17·4 % of Bangladesh’s total population of 166·4 million(16). Despite this, Bangladesh historically lacks national-level data on young adults’ biomedical parameters, including the level of BP. The Bangladesh Demographic and Health Survey (BDHS) 2017–2018 reports that about 4·6 % (18–19 years of age) and 7·9 % (20–24 years of age) of females, as well as 10·5 % (18–19 years of age) and 12·9 % (20–24 years of age) of males, have hypertension(10). Another survey reports that 8·8 % of young adults (15–24 years of age of both sexes) have hypertension(17). In BDHS 2017–2018, the prevalence of overweight/obesity account for ever-married women was 11·6 % (15–19 years of age) and 27·4 % (20–29 years of age), while men account for 6·9 % (18–19 years of age) and 13·3 % (20–29 years of age)(10). The overweight/obesity prevalence among young adults (aged 18–24 years) is 15·9 %, according to another survey(17). However, a direct association between BMI and BP for this cohort at a national level in Bangladesh remains to be investigated, which has public health policy implications.
Some regional studies in Bangladesh have found a link between high BMI (or overweight/obesity) and EBP (or hypertension). A study of 322 young adults (20–49 years) from 6 hospitals in Mymensingh and Dhaka division reported obesity as a risk factor for hypertension(Reference Paul, Karmoker and Sen18). A positive correlation between BMI and BP has been reported in a study of 184 university students (aged 18–21 years) in Dhaka(Reference Ali, Mahmood and Manirujjaman19). Another study on the effect of drinking water salinity on BP in young adults (aged 15–24 years) of coastal Bangladesh has used BMI as a control variable in the analytic model but has not reported the estimate of BMI and BP association(Reference Talukder, Rutherford and Phung20).
Though these studies in Bangladesh have provided information on the BMI–BP association in young people in Bangladesh, they were limited by geography and population-level conclusion. Furthermore, the difference between men and women in this complex relationship remains untested. Sex differences can be attributed to biological, social and behavioural factors(Reference Ghosh, Mukhopadhyay and Barik21). Most studies on the Bangladeshi adult population revealed that females are more prone to high BP or hypertension than males(Reference Abdul, Chowdhury and Uddin12,Reference Hanif, Shamim and Hossain22,Reference Tareque, Koshio and Tiedt23) . This may not be the case for young people, since a recent study found that young male adults have a higher prevalence of hypertension than young female adults(10). Therefore, the contrast between sexes in BMI and BP relationship requires attention.
To address these research gaps, the present study investigates the relationship between BMI and BP metrics (systolic BP (SBP), diastolic BP (DBP) and BP class (optimal, normal/high normal and elevated)) among young adults (aged 18–24 years) in Bangladesh. Another aim is to explore sex differences in BMI and BP metrics relationships in young Bangladeshi adults. This study further evaluates the relationship between overweight/obesity and BP metrics and investigates the changes in the relationships as a result of different cut-offs (WHO and Asia-Pacific) to define overweight/obesity. Asian populations may have lower overweight/obesity cut-off values than the WHO cut-off (BMI ≥ 25 kg/m2), which may have implications for public health action points(24).
Methods
Data source and study participants
The data were taken from the BDHS, carried out by NIPORT, with technical assistance from ICF International in the USA in 2017–2018(10). This cross-sectional survey collected nationally representative data on several primary sociodemographic and health-related measures. Briefly, this survey was based on a two-stage stratified sample of households(10). The first stage of sampling chose census enumeration areas (EA) using probability proportional to EA size, and the second stage of sampling selected a systematic sample of households within each EA. BP testing was conducted on all adults (aged ≥ 18 years) in a subsample of one-fourth of the households per EA. The survey report, as referenced, includes a detailed description of the sampling design, response rates and techniques used to measure anthropometry and BP(10). An analytic sample of 2181 young adults aged 18–24 years was extracted from total survey sample for formal analysis in this study. A flow chart of analytic sample selection is shown in Fig. 1.
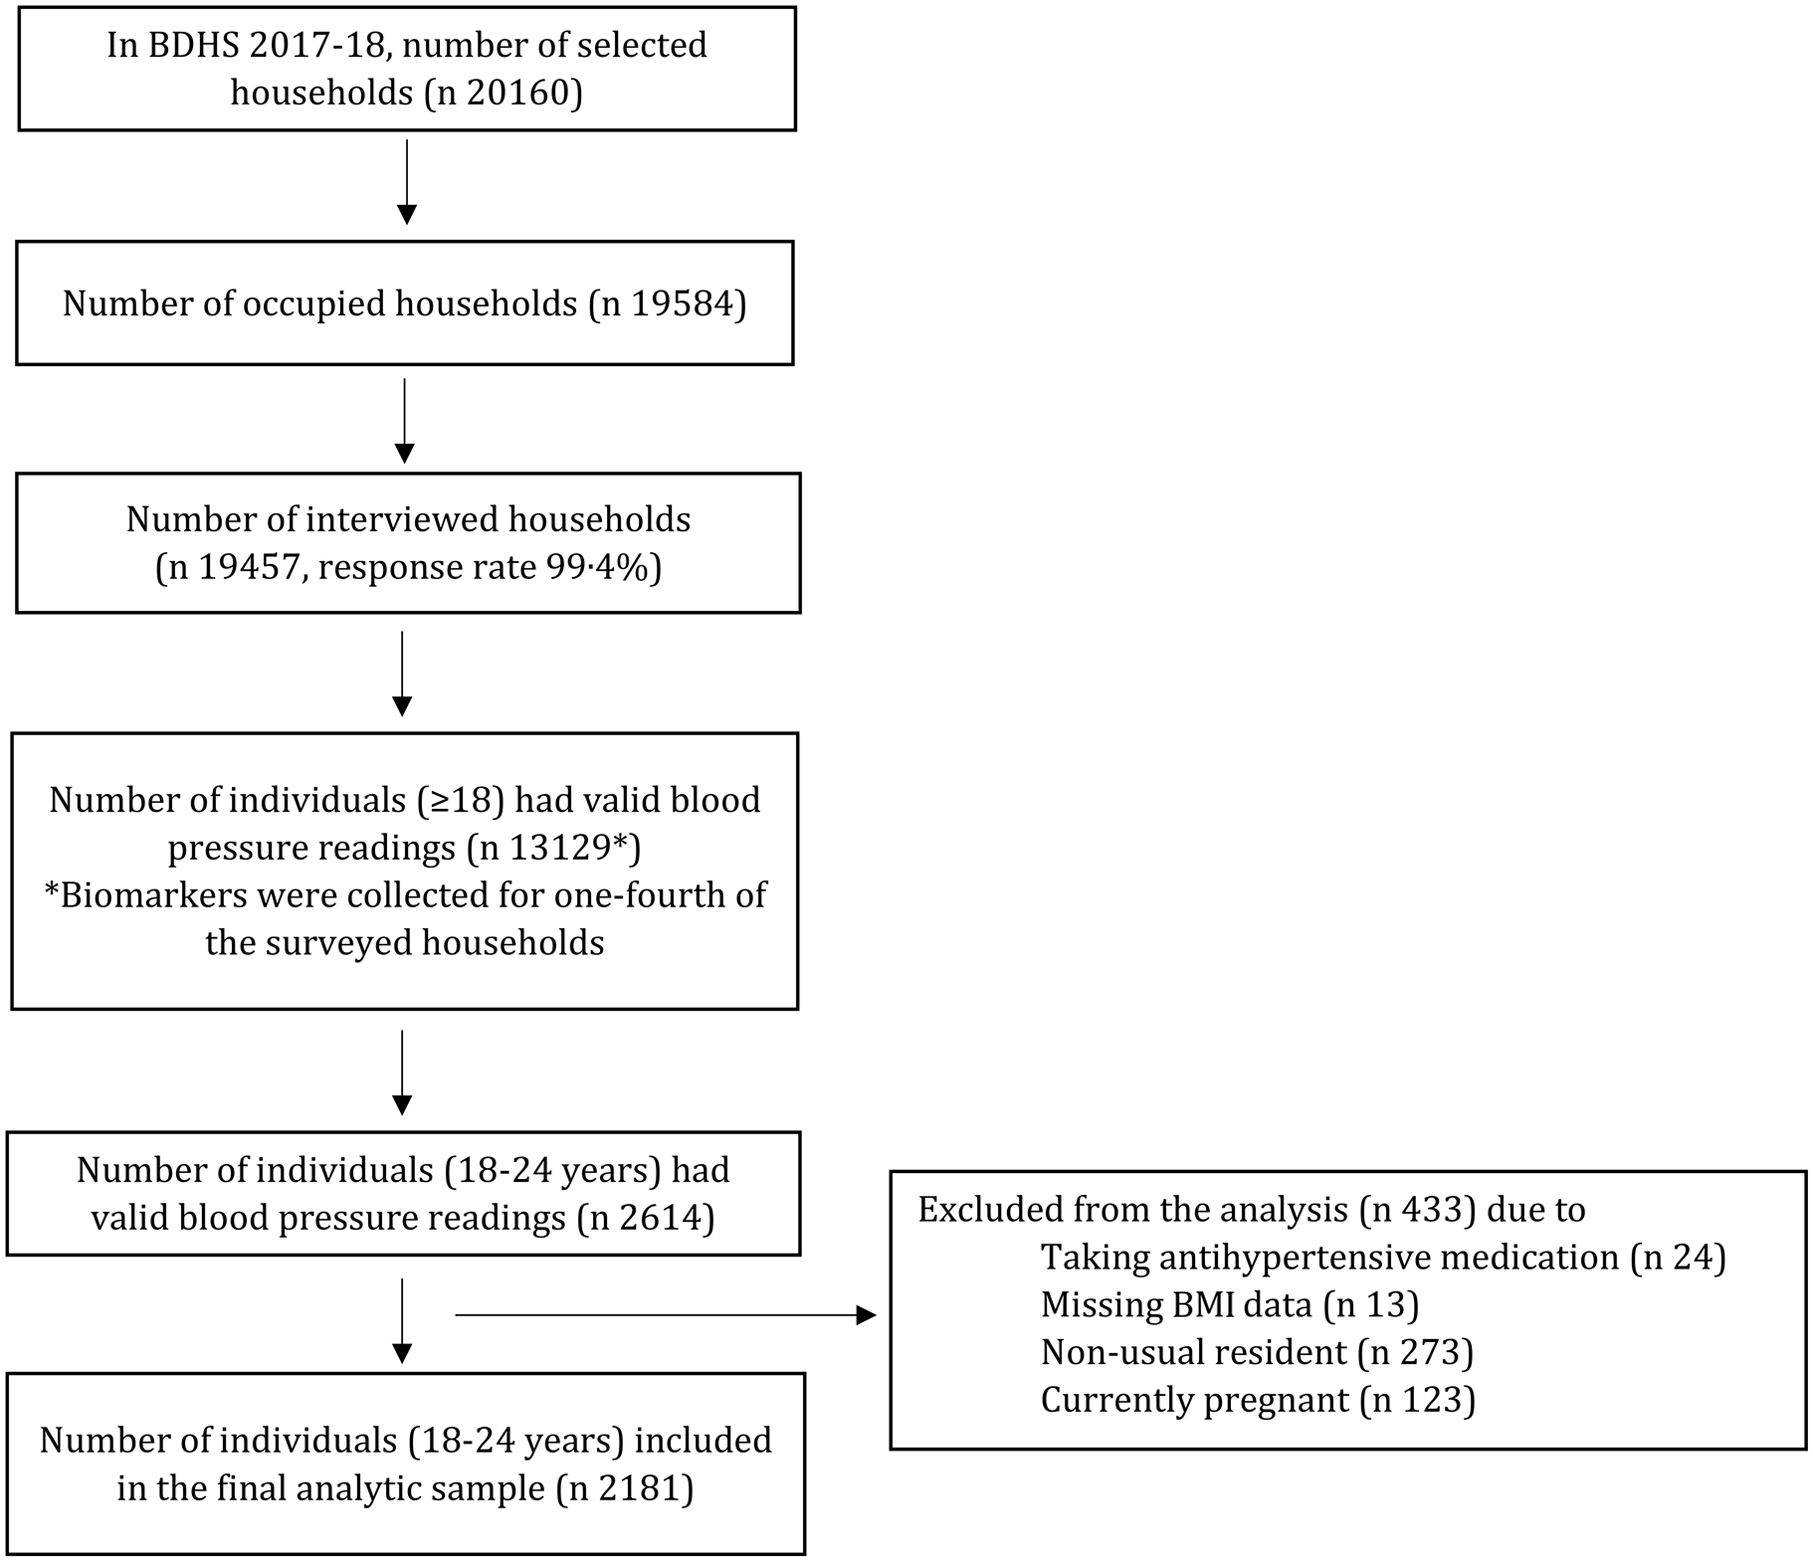
Fig. 1. Flow chart of the selection of analytic sample for this study from the Bangladesh Demographic and Health Survey, 2017–2018.
Ethical approval
The Bangladesh Medical Research Council Ethical Review Committee and the Institutional Review Board of ICF International, USA, both reviewed and approved the BDHS 2017–18 protocol. Survey respondents gave their written informed consents before the survey interview, anthropometric and biomarker measurements. The authors were given permission to use the secondary data by the DHS Program.
Measures
This study considered three outcome variables: SBP, DBP and BP class. In BDHS 2017–18, BP (mmHg) measurements were taken from consenting individuals using a standard technique during the survey interviews. A detailed description is available in the survey report(10). For respondents, BP was categorised as follows to create BP class: optimal (<120/80 mmHg), normal/high normal (120/80–140/90 mmHg) and elevated (≥140/90 mmHg).
The predictor variables of interest were BMI and BMI class. The BMI (kg/m2) was computed by dividing body weight (kg) by height squared (m2). Individuals’ height and weight were measured in this survey by trained personnel using standardised tools and procedures(10). BMI class was defined based on the WHO standard (underweight: BMI < 18·5 kg/m2, normal: 18·5–25 kg/m2 and overweight/obesity: (≥ 25 kg/m2)) and Asia-Pacific standard (underweight: BMI < 18·5 kg/m2, normal: 18·5–23 kg/m2 and overweight/obesity: (≥ 23 kg/m2))(24). The WHO and Asia-Pacific standards were used to assess any disparity in the associations due to different cut-offs.
A set of variables was considered as covariates in this study: age (years), sex (male and female), educational status (no or preschool, primary, secondary and higher), current working status (yes and no), household size (i.e. number of household members), household wealth index (poorest, poorer, middle, richer and richest), place of residence (urban and rural) and administrative division (Barishal, Chattogram, Dhaka, Khulna, Mymensingh, Rajshahi, Rangpur and Sylhet). The wealth index was constructed by data custodians using data collected in the survey about respondents’ household assets (e.g. television, bicycle and car) and housing features (e.g. drinking water, toilet facilities and flooring materials)(10). Based on these data, principal component analysis was used to calculate a wealth score that was assigned to each household. This score was categorised into quintiles: poorest (1st quintile), poorer (2nd quintile), middle (3rd quintile), richer (4th quintile) and richest (5th quintile)(10). A country-specific definition was used to classify the place of residence of individuals into urban and rural(10). Bangladesh was divided into eight administrative divisions (Barishal, Chattogram, Dhaka, Khulna, Mymensingh, Rajshahi, Rangpur and Sylhet), and the survey focused on residential administrative division of individuals(10).
Analytical strategy
The descriptive analysis evaluated the distribution of the sample and assessed the primary associations. The research question ‘does BMI or BMI class predict young adults’ BP or BP class?’ was investigated using multivariable analysis. For continuous outcomes such as SBP and DBP, linear regression models were used to assess the influences of BMI or BMI class, and for a categorised outcome such as BP class, multinomial logistic regression model was applied. These models were adjusted for age, sex, education status, working status, household size, household wealth index, place of residence and administrative division. Stratified analyses by sex (male and female) were performed to assess the relationship between BMI and BP metrics using similar models. In stratified analyses, all variables except sex (i.e. stratification variable) were controlled for. Relationships between overweight/obesity and BP metrics were investigated using same models and adjusted for the same set of variables. A further analysis was undertaken to see if there was any difference in the relationships between overweight/obesity and BP measures due to differences in the definition of overweight/obesity using both the WHO and Asian cut-offs. Descriptive and regression analyses were adjusted for complex survey design features and sampling weights. We used individual sampling weight that was calculated by the survey authority (detailed described elsewhere(10)) and included in the final data set. Results of models were presented as follows: β (linear regression) or adjusted OR (multinomial logistic regression), 95 % CI and P-values. Statistical software R (version 4.0.3) was used to perform all analytical activities(25).
Results
The average age of selected participants was 20·6 years, and 62·2 % of them was females (Table 1). Most participants had attained secondary education (41·9 %) and were not working (55·0 %). Females had a higher proportion of secondary or higher education than males, but the proportion of not working females was nearly double that of males. The average BMI of the respondents was 21·2 kg/m2 (male 20·8 kg/m2 and female 21·5 kg/m2), where the proportion of overweight and obese was 14·1 % according to WHO cut-off (27·4 % according to Asian cut-off). The overweight and obese were more prevalent in females compared with males. The average SBP and DBP were about 113·5 mmHg (male 118·8 mmHg and female 110·3 mmHg) and 76·2 mmHg (male 77·2 mmHg and female 75·6 mmHg), respectively. About 8 % of the participants had EBP, with males having nearly twice the prevalence of females. The median household size was five persons. About 16·6 % (male 15·9 % and female 17·0 %) of the respondents resided in poorest households where about 22·4 % (male 22·8 % and female 22·2 %) respondents resided in richest households. Of those selected, 70·1 % were from rural areas (male 69·0 % and female 70·7 %), and 27·2 % were from the Dhaka division (male 27·8 % and female 26·8 %).
Table 1. Descriptive statistics of the analytic sample
(Percentages; mean values and standard deviations)
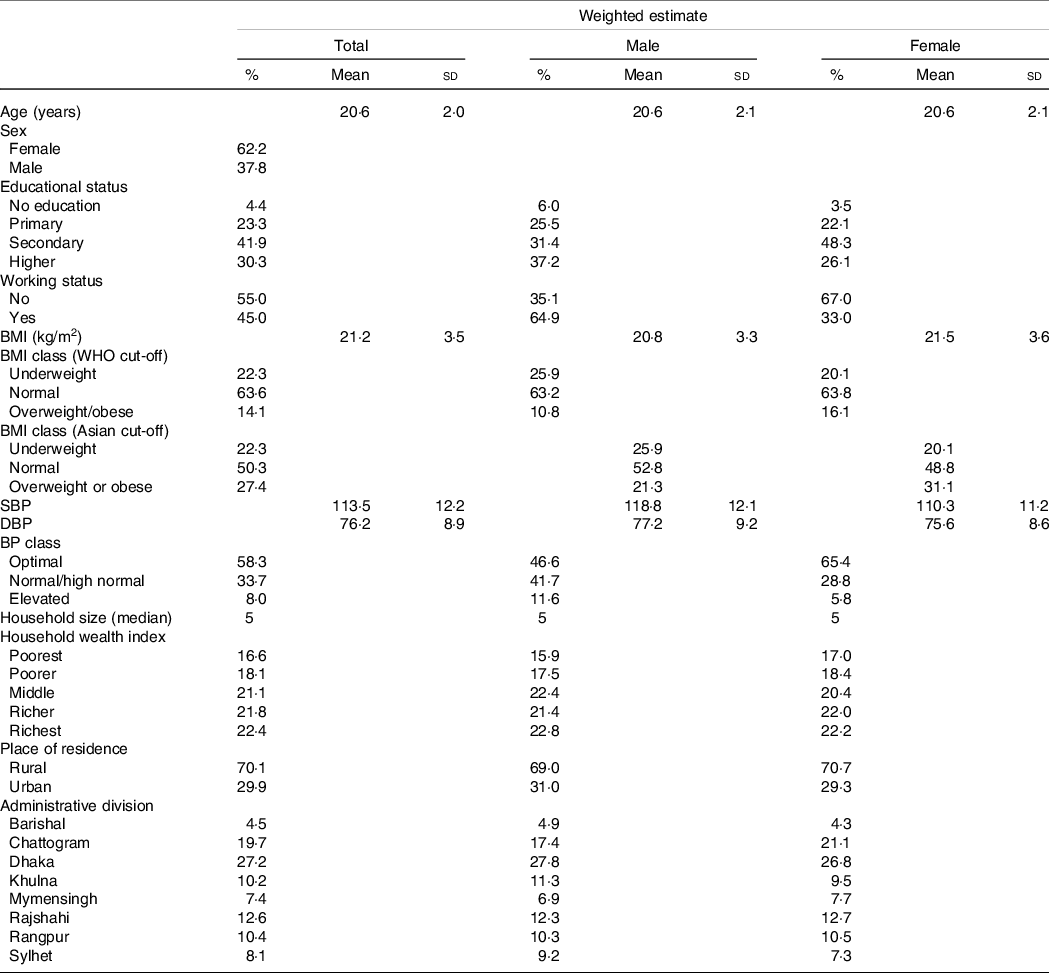
BP, blood pressure; SBP: systolic blood pressure; DBP: diastolic blood pressure.
Table 2 presents the results of multivariable linear and multinomial logistic regression analyses to assess the association between BMI and BP metrics. Higher BMI was associated with greater SBP (β 0·83; 95 % CI 0·67, 0·99, P-value < 0·001), DBP (β 0·66; 95 % CI 0·54, 0·74, P-value < 0·001) and greater odds of having EBP (adjusted OR 1·24; 95 % CI 1·17, 1·31, P-value < 0·001). In addition, young adult males had significantly higher SBP, DBP and higher odds of having EBP than young adult females (results not shown); therefore, this study performed a stratified analysis by sex. This analysis shows that greater BMI was associated with greater SBP and DBP and greater odds of having EBP among males and females. However, males had a stronger association than females. For example, a unit increase in BMI was associated with 32 % higher odds of having EBP in males and 19 % higher odds of having EBP in females.
Table 2. Association of BMI with blood pressure metrics (full and stratified by sex) among young adults (aged 18–24 years) in Bangladesh
(Coefficient values and 95 % confidence intervals)

SBP, systolic blood pressure; DBP, diastolic blood pressure; AOR, adjusted OR.
* Models were adjusted for age, sex, educational status, working status, household size, household wealth index, place of residence and administrative division.
† Models were adjusted for age, educational status, working status, household size, household wealth index, place of residence and administrative division.
Table 3 presents the results of multivariable linear and multinomial logistic regression analyses to assess the association between BMI class (WHO and Asian cut-off) and BP metrics. Relative to normal-weight young adults, overweight/obese young adults had greater SBP, DBP and greater odds of having EBP. However, the strength of associations had been reduced for the Asian cut-off (≥ 23 kg/m2) for overweight/obesity when compared with the WHO cut-off (≥ 25 kg/m2). The odds of having EBP was 4.37 times higher among overweight/obese (according to the WHO cut-off) individuals, and 4.23 times higher among overweight/obese (according to the Asian cut-off) individuals, as compared with individuals with normal body weight.
Table 3. Association of BMI class (WHO and Asian cut-offs) with blood pressure metrics among young adults (aged 18–24 years) in Bangladesh*
(Coefficient values and 95 % confidence intervals)
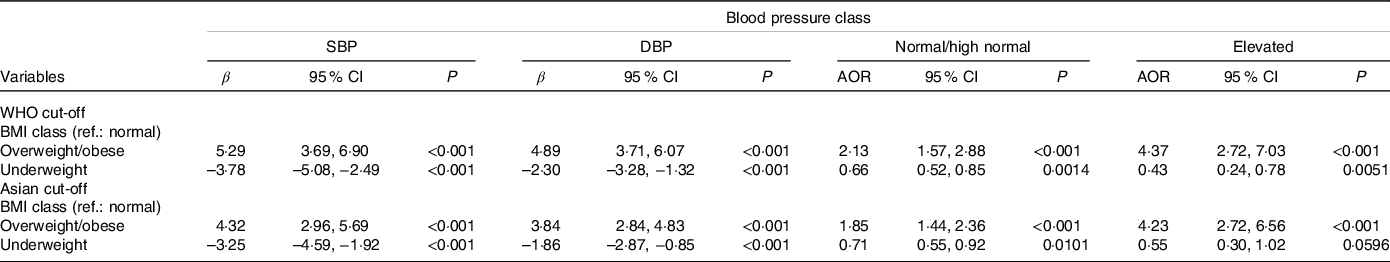
SBP, systolic blood pressure; DBP, diastolic blood pressure; AOR, adjusted OR.
* All models were adjusted for age, sex, educational status, working status, household size, household wealth index, place of residence and administrative division.
Discussion
To the best of authors’ knowledge, this is the first study to report the national-level association between BMI and BP in young adults (aged 18–24 years) in Bangladesh. The key finding was that higher BMI was related to higher SBP, DBP and the odds of having EBP. Additionally, individuals who were either overweight/obese had higher SBP, DBP and higher odds of having EBP than normal-weight individuals. The stratified analysis by sex revealed that higher BMI was associated with higher SBP, DBP and the odds of having EBP in both males and females; however, the associations were more pronounced in males than females. These results suggest that maintaining a suitable body weight in young people may serve as an efficient strategy for reducing the future burden of hypertension and associated CVD.
Associations between BMI (and overweight/obesity) and BP among young adults in Bangladesh are supported by the findings from earlier studies(Reference Wade, Chiesa and Hughes26–Reference Zhang and Wang28). Lifestyle factors can explain EBP in young adults with a high BMI. Fast-food or energy-dense food consumption, sedentary behaviour, physical activity and sleep duration are lifestyle variables contributing to a high BMI and overweight/obesity, which are commonly observed in urban Bangladesh(Reference Banna, Brazendale and Hasan29,Reference Al Muktadir, Islam and Amin30) . Other factors, such as a lack of outdoor recreational opportunities (e.g. a park or a playground), safety concerns and societal obstacles, may make it difficult for young people of all backgrounds to engage in regular physical activity(Reference Biswas, Rahman and Khanam31). Bangladesh has experienced fast urbanisation and westernisation(Reference Biswas, Kabir and Khan32), which has resulted in changes in lifestyles, particularly in young adults, potentially increasing the risk of becoming overweight/obese and influencing hypertension.
Aside from these lifestyle factors, the physiological mechanisms through which a rise in BMI raises BP or increases the risk of hypertension are complex and well documented. The underlying mechanism through which hypertension develops may be the complex interplays between metabolic and neurohormonal pathways(Reference Kolanowski33–Reference Hsueh and Buchanan37). Increases in BMI may influence insulin resistance, the renin–angiotensin–aldosterone system and sympathetic tone, all of which may lead to high BP in overweight and obese people(Reference Hsueh and Buchanan37). Thus, weight management should be considered key prevention for hypertension preventive regimen.
The relationship between overweight/obesity and BP could be heterogeneous regarding definitions used for overweight/obesity, and thus, both the WHO and Asian standard categorisations were used in this study. Results showed that regardless of the cut-offs used to define overweight/obesity, there were significant relationships between overweight/obesity and BP metrics, and directions of associations were consistent. A further analysis was performed to address the cut-off discrepancy. This is particularly important because some literature discussed the differences in BMI cut-offs varying across geography, race and culture might require evaluating the original hypothesis of how BMI impacts EBP(Reference Hossain, Adhikary and Chowdhury13,Reference Colin Bell38,Reference Stevens, Cai and Jones39) . The emphasis on lifestyle maintenance is often focused on adults or the old with co-morbidities; however, the young adult population is just as important. Particularly in Bangladesh, where rapid urbanisation, village to urban migration and ever-decreasing greenspaces coupled with a rise in unhealthy diets directly impact the youth(Reference Biswas, Kabir and Khan32,Reference Biswas, Kabir and Khan40,Reference Ruilope, Nunes Filho and Nadruz41) . The intricate association of environment with physiological and lifestyle factors could be an avenue for preventive strategies against EBP among youths.
The results displayed that the magnitude of EBP was more likely to be increased in young males compared to young females. As the survey did not collect lifestyle of other physiological data, the reason for such difference between sexes cannot be determined. However, we can hypothesise a few possibilities. With the rise of sedentary behaviour and the consumption of out-of-home meals, and irregular meals, Bangladeshi male young adults, who are more outgoing than young female adults, are more likely to have higher BP. Young males are more likely to be habituated to smoking or consumption of alcohol than females in the societal context of Bangladesh. Although it contradicts previous research among adults (≥ 18 years of age) where it was found that adult females were more likely than adult males to be hypertensive(Reference Iqbal, Ahsan and Jamil14), the contradiction advocated the importance of age and how groups should be targeted for hypertension prevention. It is also to be noted that the present study had more females (62·2 %) in the sample than males (37·8 %), and despite having a greater education rate, females were less exposed to working outside. This supports the connotation that males are exposed to smoking or alcohol consumption as well as unhealthy out-of-home diets. This calls for more research to assess the underlying mechanism regarding lifestyle and awareness factors among young adults.
The findings indicate that hypertension screening should begin at early adulthood, which can be accomplished through community, educational institute and healthcare institute-based initiatives. Young adults require education on the importance of physical activity, maintaining a healthy weight, eating healthy foods, limiting salt intake and exercising self-control when using technological devices and social media. Given the limited literature on hypertension in young adults and the effects of body weight on hypertension, early screening might help build a national-level data bank and help Bangladesh set policies to guard against non-communicable diseases.
There were a few shortcomings in the study. First, reverse causality bias could be present owing to the cross-sectional nature of the study design. Second, a few contributing factors of high BP were missing in the survey, such as physical activity, sedentary behaviour and dietary information. Third, the observational study left no scope for casual interpretation. Finally, sociocultural changes and their influences require a better understanding through qualitative information.
Conclusion
In Bangladesh, a high proportion of young adults had high BP and were overweight/obese. Increased BMI as well as overweight/obesity were linked to an EBP. Associations were consistent across males and females; however, stronger effects were noticed among males than females. Our findings suggest that maintaining a healthy weight, even in young adults, could be a critical factor in reducing BP and preventing hypertension. Prevention methods may include encouraging a healthy lifestyle, enhancing awareness, screening for overweight/obesity and monitoring BP. These could be tested as interventions in future studies.
Acknowledgements
The authors would like to acknowledge NIPORT, Mitra & Associates, and ICF International’s contributions to conducting the survey.
The authors received no funding from an external source.
J. R. K. conceptualised the study and contributed to compiling data, synthesising the analysis plan, performing formal analyses, interpreting the results and writing the manuscript. R. K. B. and M. I. contributed to synthesising the analysis plan and writing the manuscript. All authors approved the final version of the manuscript.
The authors declare they have no actual or potential competing interests.


