


Livestock industries around the world face the partially contradictory objectives of increasing production of meat and milk to match growing demand, while also reducing environmental impact and greenhouse gas emissions( Reference Gill, Smith and Wilkinson 1 ), all within a resource-constrained setting. In particular, there is pressure to reduce N excretions because of new environmental legislation( Reference Powell, MacLeod and Vellinga 2 ). Improvements in feed efficiency are essential for the beef farmer because of increasing costs of production; feed is the largest variable cost and an important determinant of profitability in beef production( Reference Ashfield, Crosson and Wallace 3 ). Identification of, and genetic selection for, feed-efficient cattle is an important approach to achieve these multiple objectives( Reference Herd, Oddy and Richardson 4 ). Improvements in feed efficiency have already been successful in other species; for example, there was a 20 % increase in feed efficiency in poultry between 1996 and 2003( Reference Case, Wood and Miller 5 ).
Feed conversion ratio, defined as the ratio of feed intake:live-weight gain( Reference Archer, Richardson and Herd 6 ), and feed conversion efficiency (FCE), defined as the units of output per unit of feed( Reference Crews 7 ), are traditional measures of feed efficiency commonly used in assessing beef cattle. Residual feed intake (RFI), defined as the difference between an animal's measured feed intake and expected intake based on its weight and average daily gain, is an alternative method of measuring feed efficiency in beef cattle, and is independent of growth rate and live weight( Reference Koch, Swiger and Chambers 8 ).
Incorporation of feed efficiency measurements into cattle breeding strategies has been slow( Reference Herd, Oddy and Richardson 4 ). Feed efficiency is costly and laborious to measure, even with automated systems. It is necessary to record feed intake and growth over at least 70 d in order to have accurate estimates of efficiency( Reference Herd, Archer and Arthur 9 ), and it is not possible to easily apply this approach to grazing animals( Reference Archer, Arthur and Herd 10 ). There is also uncertainty about the composition of body reserves and live-weight change, as well as nutrient requirements for pregnancy which make these measurements even more difficult, especially with pregnant and (or) lactating animals( Reference Dewhurst, Moorby and Dhanoa 11 ).
More recently, there has been an increased interest in longer-term strategies of genetic and genomic selection for feed efficiency or its components such as digestive efficiency, metabolic efficiency or animal activity( Reference Moore, Mujibi and Sherman 12 ). Success in identifying genetic and genomic associations with complex traits such as feed efficiency depends on being able to measure the phenotype in large numbers of animals representing a broad cross-section of genetic variation( Reference Robinson and Oddy 13 ). A number of studies have sought biochemical markers for feed efficiency (measured as RFI( Reference Richardson, Herd and Archer 14 – Reference Lawrence, Kenny and Earley 16 )) in response to these difficulties. Unfortunately, these markers have only been poorly correlated with feed efficiency measurements. These relationships may have been influenced by physiological factors including dietary intake, digestibility, metabolism of nutrients, physical activity and thermoregulation( Reference Herd and Arthur 17 ), and external factors such as environment and health( Reference Arthur, Archer and Herd 18 ). Identification of phenotypic markers can also be used to aid in constructing diets to match the energy requirements of cattle and compare the efficiency of nutrient use for different diets.
We have investigated an alternative marker for feed efficiency based on the phenomenon of N isotopic fractionation( Reference Macko, Fogel-Estep and Engel 19 ) that occurs during a number of metabolic pathways. N isotopic fractionation occurs when the incorporation of the natural isotopes 14N and 15N into products is slightly different from their ratio in precursors because of differences in the mass of small compounds containing either 14N or 15N. As a result of N isotopic fractionation, urine is depleted in 15N relative to the diet, while animal proteins are enriched( Reference Minagawa and Wada 20 – Reference Poupin, Bos and Mariotti 22 ). In particular, enrichment of tissue protein occurs during transamination and deamination reactions in the conversion of excess dietary protein into urea( Reference Balter, Simon and Fouillet 23 ), protein turnover and recycling( Reference Poupin, Bos and Mariotti 22 , Reference Martinez del Rio and Carleton 24 ) and rumen metabolism( Reference Wattiaux and Reed 25 ). The magnitude of fractionation depends on the efficiency of assimilation( Reference Martinez del Rio and Carleton 24 ) and metabolic rate( Reference Smith, Millar and Longstaffe 26 ) and varies between tissue type and metabolic pools( Reference De Niro and Epstein 27 , Reference Caut, Angulo and Courchamp 28 ). N fractionation has been a useful predictor of N partitioning in non-ruminants, e.g. measurements in plasma protein from rats( Reference Sick, Roos and Saggau 29 ) and hair protein from horses, cattle and goats( Reference Sponheimer, Robinson and Ayliffe 30 ). There have also been previous reports of the use of N isotopes to investigate the effects of changing dietary protein in beef cattle( Reference Sponheimer, Robinson and Ayliffe 30 ), the mechanisms of fractionation in ruminal microbes( Reference Wattiaux and Reed 25 ) and for predicting nitrogen-use efficiency (NUE) in dairy cattle( Reference Cheng, Kim and Merry 31 ).
N-use efficiency, defined as the efficiency of converting feed N into animal protein N, is an important component of overall feed efficiency( Reference Wheadon, Edwards and Dewhurst 32 ), as muscle protein is the most valuable component of the carcass in beef cattle. Since body composition was not measured in the present study, we have related N isotopic fractionation to overall FCE. We expect a strong relationship between NUE and FCE, particularly when offering the same diet. The adjustments involved in calculating RFI and other more complex measures of feed efficiency make them less likely to be related to N isotopic fractionation than simple measures of input/output such as FCE investigated in this work.
The objective of the present study was to investigate the relationship between N isotopic fractionation, measured in plasma, and estimates of FCE in growing beef heifers. We also investigated the repeatability of N isotopic fractionation over a 3-month period and hypothesised that there would be no change in the relationship between N isotopic fractionation and FCE over time.
Materials and methods
Animals and their management
All animal procedures performed in the present study were conducted under experimental licence from the Irish Department of Health and Children in accordance with the Cruelty to Animals Act 1876 and the European Communities (Amendment of Cruelty to Animals Act 1876) Regulation 2002 and 2005. The present study used plasma samples from eighty-four beef heifers (sixty-two Simmental and twenty-two Simmental × Holstein-Friesian) sampled on one occasion towards the end of a period of recording FCE. A subset of twenty heifers from the same population (fifteen Simmental and five Simmental × Holstein-Friesian) was sampled over four time points spaced across the FCE recording period. Further details of the original study have been described by Lawrence et al. ( Reference Lawrence, Kenny and Earley 16 ). The heifers were on average 299 (sd 48·3) d old and weighed 311 (sd 48·8) kg at the start of the experiment. They were housed in pens of four to six animals (lying area 2·87 m2/animal) in a shed with slatted floors and adapted to their diet for 3 weeks before a 12-week recording period. Heifers were individually offered grass silage ad libitum and were fed 2 kg/d concentrates (at 08.00 hours) through Calan gates (American Calan, Inc.). Daily feed intakes were recorded and animals were weighed at 3-week intervals.
Sample collection and analysis
Blood samples were obtained by jugular venepuncture from all animals on day 79, and from the subset of twenty animals on days 16, 37, 58 and 79 of the experimental period. The former samples were collected into 4 ml evacuated tubes containing sodium citrate (Greiner Vacuette; Cruinn Diagnostics), while samples from the subset of twenty animals were collected separately into 9 ml evacuated tubes containing lithium heparin (Greiner Vacuette; Cruinn Diagnostics). Blood samples were then centrifuged (2500 g , 20 min, 4°C), and whole plasma was stored at − 20°C until analysis.
Grass silage and concentrate offered was sampled three and two times weekly, and composited weekly and fortnightly, respectively. These were analysed according to the methods described by Owens et al. ( Reference Owens, McGee and Boland 33 ) with the exception that the DM content of the grass silage was determined after drying at 40°C for 48 h. Samples of the concentrates and grass silage (n 20; all in duplicate), as well as plasma samples, measured in whole plasma (n 164 plus 10 % duplicates) were analysed for 15N content by isotope-ratio MS (Iso-Analytical Limited). N-15 results are expressed in δ units relative to standard air (δ15N, ‰). N isotopic fractionation, the difference between δ15N for plasma and δ15N for the diet, is termed Δδ15N, or simply Δ15N. Average diet δ15N was calculated for each animal by weighting δ15N for silage and δ15N for concentrate based on N intake (g/d) of each diet component.
Statistical analysis
RFI was calculated as the difference between actual DM intake (DMI) and expected DMI using regression models to predict DMI( Reference Lawrence, Kenny and Earley 16 ). The relationships between plasma δ15N, Δ15N, FCE, RFI and W 0·75 were described using linear regression (GenStat release 10.1; Lawes Agricultural Trust (Rothamsted Experimental Station), 2007) using breed as a factor in the model. ANOVA was used to establish the effect of breed and sire on N isotopic fractionation and feed efficiency. Pearson's correlations were used to show the relationship of N isotopic fractionation between time points, and a REML repeated-measures model was used to analyse changes in the relationship between FCE and N isotopic fractionation over time.
Results
A total of eighty-six heifers commenced the experiment, but values were excluded from one sick animal and one extreme outlier (confirmed using Cook's test). These exclusions had no effect on the relationships identified. The average chemical composition of the grass silage and concentrates across the experiment is described in Table 1. Across the whole population, average DMI was 5·82 (sd 0·74) kg/d, silage DMI averaged 4·1 (sd 0·74) kg/d and concentrate intake was 1·72 kg/d, so that the forage proportion of total DMI averaged 0·70 (sd 0·038) g/g. Mean mid-test live weight was 333 (sd 47·6) kg, average daily gain was 0·53 (sd 0·183) kg, FCE (g live-weight gain/g DMI) was 0·09 (sd 0·028) and average RFI was 0 (sd 0·428). For the subset of twenty heifers, the average DMI was 5·82 (sd 0·59) kg/d, silage DMI averaged 4·1 (sd 0·59) kg/d and concentrate was 1·72 kg/d, so forage proportion of the total DMI averaged 0·70 (sd 0·031) g/g. Mean mid-test live weight was 339 (sd 53·7) kg, average daily gain was 0·55 (sd 0·164) kg, average FCE was 0·10 (sd 0·030) and RFI was − 0·079 (sd 0·472).
Table 1 Average chemical composition of feed samples collected over the experimental period
ND, not determined; DMD, DM digestibility; DOMD, digestible organic matter in total DM; OMD, organic matter digestibility; NDF, neutral-detergent fibre.
* Measured in vitro.
† Measured in vitro.
‡ Measured in vitro.
Although feed samples were drawn from the same batches, there was a slight variation in δ15N values, so the average values were used in calculating Δ15N. The average δ15N values of the concentrates and grass silage were 3·20 (sd 0·189) and 5·74 (sd 0·103) ‰, and the weighted value for the whole diet was 4·96 (sd 0·082) ‰ for the subset of twenty animals and 4·95 (sd 0·098) ‰ for all the eighty-four animals. Plasma δ15N for each of the four time points averaged 8·85 (sd 0·43), 8·80 (sd 0·40), 8·84 (sd 0·41) and 8·69 (sd 0·48), respectively, ranging from a 3·04 to 5·11 unit enrichment relative to the diet. The average δ15N of plasma for all the eighty-four animals at day 79 was 8·53 (sd 0·364) ‰, ranging from a 3·51 to 5·14 unit enrichment relative to the diet.
Although there was a small range in overall diet δ15N (a consequence of the differences in the forage:concentrate ratio consumed), there was no significant relationship between diet δ15N and plasma δ15N for the whole population or any of the repeated time points for the subset of heifers. Linear regression analysis using data from all animals at day 79, as well as for the subset of twenty animals at each of the four time points, showed a significant negative relationship between plasma δ15N and FCE in each case (Table 2). N isotopic fractionation (Δ15N) was also negatively related to FCE for all the sample time points (Fig. 1(a)–(e), equations 1–5). The subset showed stronger relationships than those observed for the whole population:
 $$Day\ 79\ ( n = 84):\ \Delta ^{15}N = 4\cdot 216\ (se\ 0\cdot 101) - 7\cdot 36\ (se\ 1\cdot 10)\times FCE\ (g/g). $$
Table 2 Coefficients of determination (r 2) or coefficients of multiple determination (R 2) for the relationships between feed conversion efficiency (g live-weight gain/kg DM intake) and plasma δ15N, Δ15N (plasma δ15N−diet δ15N) and mid-test W 0·75, with average standard errors*
* All relationships were significant at the P< 0·001 level.
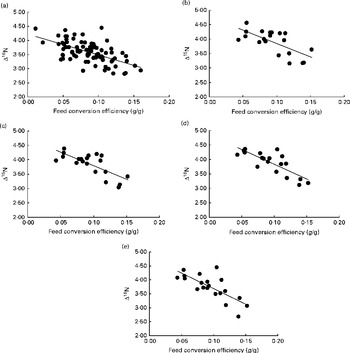
Fig. 1 Relationship between nitrogen isotopic fractionation (Δ15N; the difference between plasma δ15N and diet δ15N) and feed conversion efficiency (g live-weight gain/g DM intake) for (a) all animals at day 79 (n 84; R 2 0·35) and (b)–(e) a subset of twenty animals at days 16 (n 20; R 2 0·47), 37 (n 20; R 2 0·56), 58 (n 20; R 2 0·64) and 79 (n 20; R 2 0·56).
 $$Day\ 16\ ( n = 20):\ \Delta ^{15}N = 4\cdot 781\ (se\ 0\cdot 231) - 9\cdot 33\ (se\ 2\cdot 32)\times FCE\ (g/g). $$
 $$Day\ 37\ ( n = 20):\ \Delta ^{15}N = 4\cdot 743\ (se\ 0\cdot 197) - 9\cdot 49\ (se\ 1\cdot 98)\times FCE\ (g/g). $$
 $$Day\ 58\ ( n = 20):\ \Delta ^{15}N = 4\cdot 854\ (se\ 0\cdot 179) - 10\cdot 25\ (se\ 1\cdot 80)\times FCE\ (g/g). $$
 $$Day\ 79\ ( n = 20):\Delta ^{15}N = 4\cdot 789\ (se\ 0\cdot 232) - 11\cdot 11\ (se\ 2\cdot 33)\times FCE\ (g/g). $$
There was no significant difference between the slopes on different days (P= 0·848). Plasma δ15N measurements from the same animals in the subset were significantly correlated over adjacent time points (P< 0·001 correlation between all days; average r 0·96), and the degree of correlation for individuals decreased with greater time separation between samplings (e.g. r 0·84 between the twenty animals on the first and last sampling dates).
There was no significant relationship between FCE and DMI (r 2 0·06; P= 0·16). There was a weak (r 2 0·10), but significant (P= 0·002), negative relationship between FCE and mid-test metabolic weight (W 0·75). Nonetheless, adding W 0·75 in a multiple regression analysis explained an additional and highly significant part of the variation in plasma δ15N and Δ15N across all time points (Table 2). There was no significant relationship either between plasma δ15N and RFI (P= 0·21; r 2 0·07), or between Δ15N and RFI (P= 0·82; r 2 0).
There was a significant difference in FCE between breeds in the present study (P< 0·001). Pure Simmental heifers had lower FCE (0·076 (sd 0·003)) than Holstein-Friesian × Simmental heifers (0·119 (sd 0·004)). Simmental heifers also had significantly higher plasma δ15N (P< 0·001) and Δ15N (P< 0·001) than Holstein Friesian × Simmental cross heifers (8·63 (sd 0·04) and 8·22 (sd 0·06); 4·38 (sd 0·04) and 3·92 (sd 0·06), respectively). Despite significant differences in FCE and N isotopes between breeds, there was no significant effect on the relationship between FCE and δ15N or Δ15N. FCE (g/g) also differed across sire groups (P< 0·001), ranging from 0·06 (sd 0·010) to 0·13 (sd 0·001). There were fifteen sires for the larger group and three sires for the subset group. Plasma δ15N and, as a result, plasma δ15N − diet δ15N were significantly different between the sire groups (P< 0·001 and P< 0·001). Plasma δ15N and Δ15N ranged from 8·17 (sd 0·12) to 8·97 (sd 0·11) and 3·81 (sd 0·11) to 4·69 (sd 0·10) for different sire groups, respectively. Plasma δ15N and Δ15N tended to be higher in sire groups with lower FCE. FCE and average daily gain were slightly higher for the subset of twenty heifers compared with the whole population (P< 0·001 and P< 0·001, respectively).
Discussion
NUE in cattle can be improved by increasing N retention in muscle at a similar intake, by reducing N intake at a similar N retention, or by a combination of both. Live-weight gain is the main driver for N retention in growing animals, and as muscle protein is the most valuable component of the carcass in beef cattle, it is essential to identify animals with higher NUE which will aid in lowering the impact of detrimental N emissions to the environment( Reference Gill, Smith and Wilkinson 1 ). Phenotypic markers such as N isotopic fractionation used in the present study have potential to be used to measure feed efficiency in cattle where diet composition or intake cannot be recorded. This will accelerate collection of feed efficiency data for large numbers of animals in breeding programmes.
Comparison of nitrogen isotopic fractionation with earlier studies
N isotopic fractionation (Δ15N) between whole plasma and the diet overall averaged 3·74 in the present study (range 3·04–5·11 ‰), which is lower than the range measured previously with growing or mature ruminants (3·80–6·94 ‰ for treatment means; Table 3). The plasma urea fraction is generally depleted in δ15N compared with both the diet and the plasma protein fraction( Reference Poupin, Bos and Mariotti 22 ). N fractionation can be measured in the plasma protein or urea N fraction of plasma; however, in the present study, whole plasma was used because the urea fraction contains less than 1 % of the N in plasma, so the effect on results in the present study would be negligible. For the same reason, we calculate that the fact that the highest Δ15N in the literature (Table 3) was for plasma protein is purely coincidental. There was only a weak relationship (r 2 0·1) between plasma urea N and FCE in the present study, which taken together with the low level of urea N relative to protein N in plasma suggests that the urea fraction of plasma would not affect the relationship between FCE and plasma δ15N.
Table 3 Literature values for nitrogen isotopic fractionation in ruminants (Δ15N; δ15N in blood minus δ15N in the diet)
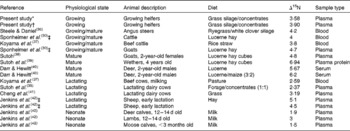
* Whole population (n 84).
† Subset heifers averaged over time (n 20).
‡ Unpublished results cited by Robbins et al. ( Reference Robbins, Felicetti and Sponheimer 43 ).
While most previous studies provided only limited descriptions of the animals, many involved mature animals that would have ceased growing and so use dietary N relatively inefficiently, resulting in a high level of isotopic fractionation (Δ15N). Lower Δ15N were observed in studies with suckling young and in most, but not all, studies with lactating ruminants. It would be expected that these more productive animals would be using N more efficiently, partitioning a higher proportion of N to muscle or milk protein and less to urea.
Repeatability of nitrogen isotopic fractionation measurements
In the present study, we demonstrated a consistent and repeatable strong relationship between N isotopic fractionation and FCE that will be useful for application of the approach in animal breeding. The correlation between plasma δ15N at the different time points was also usefully strong. It appears that FCE remained constant over the measurement period and Δ15N values remained stable despite the natural variation in growth rate that may have been increased because of heifers entering puberty at different stages during the experiment( Reference Ciccioli, Charles-Edwards and Floyd 34 ).
Relationship of nitrogen isotopic fractionation with feed conversion efficiency
N isotopic fractionation (Δ15N) was a good indicator of FCE in the present study, and it seems likely that this relationship was driven by the partitioning of N between live-weight gain and excretion in the urine. The negative relationship between Δ15N and FCE is consistent with the increased Δ15N when cattle and goats were fed diets containing higher protein levels( Reference Sponheimer, Robinson and Ayliffe 30 ). The relationship between Δ15N and FCE was probably stronger for the subset of twenty animals because they were more homogeneous (lower sd for live weight) and genetically more similar. Plasma δ15N differed between the breed and sire groups, providing preliminary evidence that it will be possible to use this approach to select for beef cattle with higher FCE. N isotopic fractionation only explained 1 % of the variance of RFI. As expected, N isotopic fractionation was more related to simple measures of input and output (i.e. FCE) than complex measures of efficiency such as RFI.
Since the composition of live-weight gain was not measured in the present study, it is likely that some of the unexplained variation in the relationships between plasma δ15N or Δ15N and FCE results from the variation in the relationship between NUE and FCE. The inclusion of W 0·75 accounted for some of the variation in the relationship between Δ15N and FCE (Table 2) because the N content of live-weight gain declines as animals grow( 35 ). Average values for the protein content of live-weight gain are 6·3 % lower for 450 kg cattle in comparison with 250 kg cattle( 35 ), implying a reduction in NUE at the same FCE. Fractionation of N isotopes in the rumen could explain additional variation( Reference Wattiaux and Reed 25 , Reference Steele and Daniel 36 ), though the strong relationships with FCE and use of a consistent diet suggest that any effect would have been small.
N isotopic fractionation (Δ15N) explained more variation in FCE than single blood metabolites or hormones that were used to predict RFI in earlier studies. In these animals, Lawrence et al. ( Reference Lawrence, Kenny and Earley 16 ) found no significant relationships between blood metabolites and RFI, except for creatinine. Kelly et al. ( Reference Kelly, McGee and Crews 15 ) reported weak relationships between feed conversion ratio and plasma leptin (r 2 0·23), urea (r 2 0·18) and NEFA (r 2 0·10) in heifers, while Richardson et al. ( Reference Richardson, Herd and Archer 14 ) found weak relationships between feed conversion ratio and plasma glucose (r 2 0·21), aspartate aminotransferase (r 2 0·20) and albumin (r 2 0·23) in steers.
The partitioning of N between protein (muscle tissue or milk) and urea is affected by protein supply and protein quality( Reference Poupin, Bos and Mariotti 22 , Reference Sick, Roos and Saggau 29 ), and both aspects have been used to explain differences in N isotopic fractionation. The first effect suggests that as dietary protein supply increases, an increasing proportion of N is directed to urine, so that fractionation increases. The second effect emphasises increased fractionation as a result of decreased protein quality and consequent increased losses as urinary N. In the present study, animals received the same diet, so the effects must be mainly due to the between-animal variation in feed utilisation. The between-animal variation in N partitioning depends on the ability of individual animals to utilise protein, which will depend on their genetic make-up and management history. There was a weak relationship between plasma urea N and FCE in the present study and a low level of urea N relative to protein N in plasma, which suggests that the urea fraction of plasma would not affect the relationship between FCE and plasma δ15N. N fractionation in the present study was able to predict the animal variation associated with FCE.
Conclusion
We have demonstrated a highly significant negative relationship between N isotopic fractionation between plasma and the diet (Δ15N) and feed efficiency in growing beef heifers. This N isotopic fractionation effect changed only slowly over time, which would be useful for application in cattle breeding. N isotopic fractionation may be useful in evaluating feed efficiency without measuring feed intake, and even diet composition, provided that animals are fed with identical diets, and be used to compare the nutrient-use efficiency of different feeds.
Acknowledgements
The authors acknowledge the skilled technical assistance of J. Larkin and E. Mulligan.
The present study was financially supported by the European Union (Marie Curie International Reintegration Grant FP7-PEOPLE-IRG-2008-239241) and as part of the Department of Agriculture, Food and the Marine grant in aid to Teagasc. The funders had no role in the design, analysis or writing of this article.
The authors' responsibilities were as follows: N. M. W., M. M., G. R. E. and R. J. D. were involved in the design of the study, data analysis and preparation of the manuscript; N. M. W. conducted additional laboratory analysis and prepared the first draft of the manuscript. All authors read and approved the final manuscript.
None of the authors has any conflict of interest.


