


Initially, the gluten-free diet (GFD) is a medical response for people with coeliac disease (CD), a systemic autoimmune disorder for which GFD is the only available effective treatment. This diet involves excluding foods that contain the protein gluten, including wheat barley and rye. Its prevalence is estimated at 0·8 % in Western countries(Reference Singh, Arora and Strand1). However, in the last decade, the adherence to a GFD has considerably increased, outside a diagnosis of CD(Reference Aziz, Lewis and Hadjivassiliou2–Reference Choung, Unalp-Arida and Ruhl5). Indeed, many studies have reported that people who avoid gluten today are mostly healthy people(Reference Aziz, Lewis and Hadjivassiliou2,Reference Gaesser and Angadi6–Reference DiGiacomo, Tennyson and Green16) . The two main motives reported for avoiding gluten among subjects without CD are that gluten may trigger intestinal and/or extraintestinal symptoms and it is considered better for health. The first group referred to non-coeliac gluten sensitivity population also considered as population suffering from gluten-related disorders(Reference Catassi, Bai and Bonaz17). This disorder is characterised by symptoms related to gluten, but no biomarkers have been identified and the diagnosis is mainly based on self-declaration. For these people, following a GFD is beneficial and reduces their symptoms. For the second group, media and celebrities, as well as high-level athletes, contribute to the popularity of gluten avoidance by claiming its possible health benefits, including weight loss(Reference Gaesser and Angadi6,Reference Gaesser and Angadi7,Reference Lis, Stellingwerff and Shing18) . Indeed, studies investigating motives related to gluten avoidance have shown that one-quarter to one-third of avoiders put forward the belief of a health benefit(Reference Reilly9–Reference Lu, Zhang and Luoto11). However, so far, there is no scientific consensus that gluten avoidance would be beneficial for the general population(Reference Gaesser and Angadi6,Reference Marcason19) . In the meantime, the market of gluten-free food has considerably grown: +28 % between 2004 and 2011(Reference Sapone, Bai and Ciacci20), +34 % between 2009 and 2014 in the USA(Reference Igbinedion, Ansari and Vasikaran21) and +10·4 % between 2014 and 2019 in Europe(Reference Elli, Branchi and Tomba22). In addition, gluten-free product offer is particularly important in specialised organic stores which generally offer a broader range of alternative products(Reference Lee, Ng and Zivin23). One may ask whether gluten avoidance is associated with other considered healthy food choices, in particular organic food consumption. It is important to identify their behaviours to be able to clearly determine their impact on health. In previous studies, including ours(Reference Perrin, Allès and Buscail24,Reference Christoph, Larson and Hootman25) , it has been shown that individuals avoiding gluten adopt an overall healthier food profile with greater consumption of fruits and vegetables, and fewer sweetened beverages. Christoph et al.(Reference Christoph, Larson and Hootman25) also reported that individuals considering organic products healthy were also four times more likely to consider gluten-free food healthy, like those who favour unprocessed products (six times more). However, in the present study, organic and unprocessed products were evaluated using a unique question concerning the importance for participants to eat organic (or unprocessed) food, with four modalities of answers.
In addition, the role of organic food on health is not well documented and definition greatly varied in the literature. Some authors used more or less accurate question about frequencies, while other quantitatively estimated organic food consumption. Their consumption reduces exposure to pesticides, and some studies show better nutritional intake, but often their consumption is accompanied by other healthy behaviours such as physical activity(Reference Brantsæter, Ydersbond and Hoppin26). However, organic foods are considered as healthy, and some places of purchase are the same(Reference Hercberg, Castetbon and Czernichow27); thus, we hypothesise that gluten avoiders may also be organic food consumers.
The aim of the present study was therefore to compare the consumption of organic products (as a whole and by food group) in individuals (partially or totally) avoiding gluten or not, and their places of food purchases of organic food.
Materials and methods
Study population
Participants are adult volunteers from the NutriNet-Santé study, a web-based observational prospective open cohort study launched in May 2009 in France. This study aims to investigate the relationship between nutrition and health, as well as the determinants of dietary patterns and nutritional status. The design and methodology of the NutriNet-Santé study have been previously described in detail elsewhere(Reference Hagströmer, Oja and Sjöström28). At inclusion in the cohort and yearly thereafter, participants completed a set of self-administered questionnaires on dietary intake, health and anthropometric, sociodemographic and lifestyle characteristics. Participants were also regularly invited to complete optional complementary questionnaires.
Ethics
The NutriNet-Santé study is conducted according to the guidelines from the Declaration of Helsinki and was approved by the ethics committee of the French Institute for Health and Medical Research (IRB Inserm no. 0000388FWA00005831) and by the National Commission on Informatics and Liberty (CNIL no. 908450 and no. 909216). All subjects signed an electronic informed consent. This study is registered in ClinicalTrials.gov (NCT03335644).
Data collection
Definition of participants with gluten-free diet
Between September and December 2016, participants were asked to complete an optional questionnaire inquiring food exclusions and their underlying motives. The questionnaire included three parts relating to the exclusion of eighty-three types of foods, specific diets and their motivations, and allergies. In this questionnaire, the following question was asked: ‘Do you exclude products containing wheat/barley/rye/oats (gluten) from your diet?’ and the possible responses were ‘yes totally/yes partially/no’. Three groups were defined: total avoiders, partial avoiders or non-avoiders.
Participants reporting a CD were excluded from the present study. Participants were considered to have a CD if they answered within the framework of the food exclusion questionnaire, ‘yes’ to the question ‘Do you have a celiac disease?’ and if they reported a medical diagnosis or other type of ‘diagnosis’ on questions ‘Diagnosed by a general practitioner, a specialist, a dietician?’ or when they reported a CD in whichever yearly health questionnaire.
Sociodemographic and lifestyle data
At baseline and yearly thereafter, sociodemographic, anthropometric and lifestyle characteristics were collected. These characteristics included sex, age, height, weight, education level, occupational category, monthly income, smoking status and physical activity (measured by the International Physical Activity Questionnaire(Reference Craig, Marshall and Sjöström29,Reference Touvier, Méjean and Kesse-Guyot30) ). The baseline questionnaires were pilot-tested and compared against traditional assessment methods(Reference Vergnaud, Touvier and Méjean31,Reference Lassale, Péneau and Touvier32) as well as clinical measurement for anthropometric data(33). The monthly income per household unit was calculated by dividing monthly income by consumption units (CU) where the first adult in the household represents 1 CU, other persons older than 14 years represent 0·5 CU and other persons younger than 14 years represent 0·3 CU, following national statistics methodology and guidelines of the French National Institute of Statistics and Economics Studies(34). BMI (in kg/m2) was calculated as the ratio of weight:squared height and then classified following the WHO guidelines.
Dietary data and organic food consumption
An optional organic semi-quantitative FFQ (Org-FFQ) was proposed to the cohort participants (June–December 2014). This questionnaire is originally based on an original validated FFQ(Reference Kesse-Guyot, Castetbon and Touvier35) and has been described elsewhere(Reference Baudry, Méjean and Allès36). Participants were asked to report their frequency of consumption and portion sizes over the past year for 264 food and beverage items. The portion sizes for each food consumed were estimated according to standard measurements (e.g. home containers, grams displayed on the package or photographs available via the interactive interface). These photographs came from a validated picture booklet(Reference Le Moullec, Deheeger and Preziosi37). The frequency of consumption referred to usual consumption over the past year on an increasing scale including yearly, monthly, weekly or daily units, as suitable. Participants had to provide only one answer and selected an average portion size using validated photographs. Then, consumptions were translated as daily quantity.
From the 264 food items, thirty-three food/beverage groups were designed on a nutritional basis.
To estimate the level of organic food consumption in the diet, participants indicated for each item how often the consumption was organic through a five-point ordinal scale ranging from ‘never’ to ‘always’. The modalities were weighted as follows: 0, 0·25, 0·50, 0·75 and 1(Reference Baudry, Méjean and Allès36). From the whole diet, we calculated the average daily intake (in g/d). The contribution of organic food consumption in the diet was then calculated by dividing the total organic food intake (g/d) by the total food intake (g/d), excluding water. This ratio was multiplied by 100 to obtain the contribution of organic food consumption as a percentage of weight. Nutrient intakes were estimated using a published nutrient database(Reference Arnault, Caillot and Castetbon38). Only participants with a plausible energy intake were included in the analyses; the over-reporters and under-reporters were excluded. They were identified by a ratio of energy intake:energy requirement, estimated with the Schofield equations according to sex, age and BMI(Reference Schofield39). Energy requirement, accounting for physical activity level, was compared with energy intake. The ratio between energy intake and energy requirement was calculated, and participants with ratios below or above cut-offs previously identified (below 0·35 or above 1·93) were excluded. To assess the adherence to the nutrient-based French recommendations, the probability of adequate nutrient intake (PANDiet) was computed(Reference Verger, Mariotti and Holmes40). This 100-point score represents the average of two sub-scores: the adequacy sub-score estimating the proportion of adequacy for twenty-one items for which the usual intake should be above a reference value, multiplied by 100, and the moderation sub-score corresponding to the proportion of adequacy for six items for which the usual intake should not exceed a reference value, multiplied by 100.
Place of food purchase
Place of purchase for each organic food was collected from an optional questionnaire on consumer attitudes and motives (July 2014–January 2015). Places of purchase were grouped into five classes: hard discount, grocery stores, shopping centres, markets and organic stores. Participants had to select a place of purchase for each food group (across a maximum of thirty food groups). Then, for each place, the proportion of purchase has been calculated: the number of responses for each place was summed and divided by the number of total responses. Next, the purchase place with the highest proportion was considered as the main place of purchase. Since this questionnaire was optional, analyses were performed on a sub-sample (n 16 885). A total of 1002 persons had multiple places with the same proportion of purchase. For these participants, we considered shopping centres as the main place (the most frequented place in the overall sample).
Statistical analysis
Sociodemographic, lifestyle characteristics and places of purchase were described (using means, standard deviations or percentages) among total gluten avoiders, partial gluten avoiders and gluten non-avoiders. P values referred to χ 2 test or one-way ANOVA test, depending on the type of variable.
Macronutrients were assessed by computing the percentage of energy intake from carbohydrates, lipids and proteins. Micronutrient intakes were adjusted for energy intake using the residual method(Reference Willett and Stampfer41). Consumption of thirty-three food groups, macronutrients and micronutrients intake was reported as mean values and 95 % CI using an ANCOVA, adjusted for age and sex, and for food groups for daily energy intake. Micronutrient intakes were adjusted for energy intake using the residual method(Reference Willett and Stampfer41). Contribution of organic foods to each food group (ratios with their standard deviations) is also provided and was adjusted for age, sex and total consumption of food group.
The proportion of total organic food consumption was categorised into quintiles to assess the association between the type of diet and organic food consumption. With regard to gluten-free avoiding, three categories were considered: (1) overall GFD that included all individuals avoiding gluten whether or not they followed any other diets, (2) GFD only that included only participants who avoided gluten but did not follow any other diet and (3) participants who followed both gluten-free and lactose-free diets. A multivariable polytomic logistic regression model was performed. Adjusted OR with their 95 % CI are presented. The model was adjusted for age, sex, education level (no diploma or primary studies/secondary studies/higher educational level), occupational category (nine classes), income level (<1200 € per CU/1200–2300 € per CU/>2300 € per CU), smoking status (never smoker/former smoker/occasional smoker/regular smoker), physical activity (low, moderate and high) and total daily energy intake without alcohol.
Two multivariable polytomic logistic regression models were also performed to assess the association between gluten avoidance and place of purchase of organic foods. The first model was adjusted for sociodemographic confounding factors, namely age, sex, education level, occupational category, income level, smoking status and physical activity. The second model was further adjusted for organic food consumption to more clearly determine the role of gluten avoidance in the choice of place of purchase. Sensitivity analyses were performed using multivariable logistic regression models focusing on place of purchase. In order to ensure that the choice of the main place of purchase for people who had more than one did not influence the model (shopping centres in principal analysis), we also performed the same set of analysis using markets as the main place of purchase for these individuals.
Two-sided tests and a P value <0·0001 were used for statistical significance, given the high number of statistical tests performed and the large sample size. All statistical analyses were performed using SAS software (version 9.4, SAS Institute Inc.).
Results
Sample selection
Of the initial 121 266 participants who received the optional questionnaire on food exclusions, a total of 34 781 completed it. Within this sample, we excluded participants who reported a diagnosed CD, with missing sociodemographic data and living overseas, and those who did not completed the Org-FFQ. The final sample available for analysis included 23 468 individuals (Fig. 1) including 499 total gluten avoiders, 2023 partial avoiders and 20 946 non-avoiders. The percentage of participants avoiding gluten in this study was 10·75 %, 2·13 % of whom totally excluded gluten.
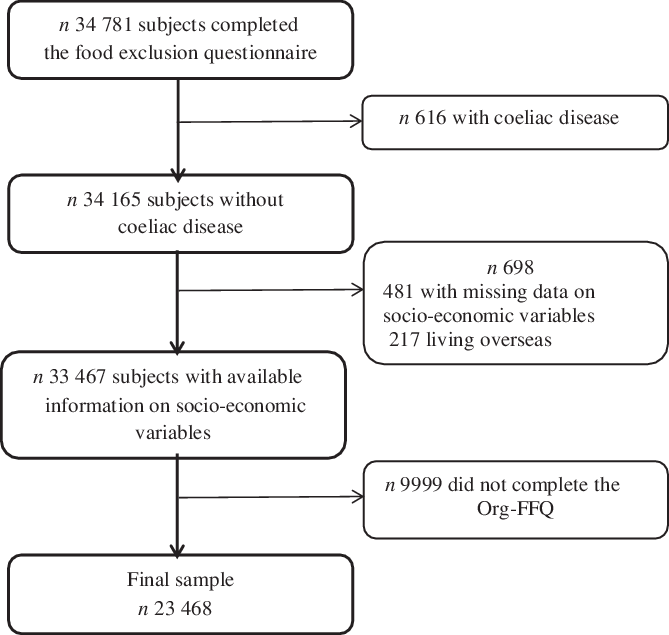
Fig. 1. Flow chart of the study. Org-FFQ, organic semi-quantitative FFQ.
Sociodemographic and individual characteristics
Table 1 presents sociodemographic and lifestyle characteristics of the participants according to the gluten avoidance, as well as for the whole sample. Participants avoiding gluten were more likely to be women, between 55 and 64 years old, single, non-employed, physically active, to have lower monthly income per household unit, to be low alcohol consumers and to present less obesity. No difference regarding education level and smoking status was observed across the gluten avoidance groups.
Table 1. Sociodemographic and lifestyle characteristics according to gluten avoidance
(Percentages; mean values and standard deviations)
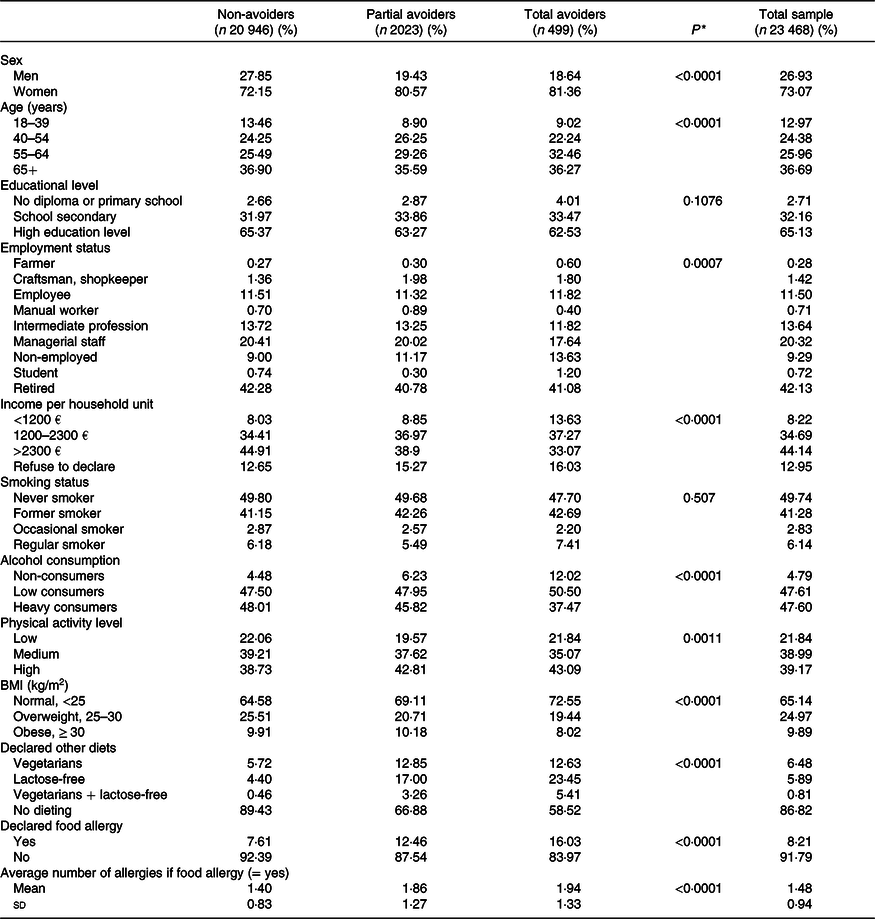
* P values are based on the χ 2 test or the one-way ANOVA test as appropriate.
Partial and total avoiders showed some differences: partial avoiders were more frequently in the age group between 40 and 64 years. Total avoiders were less likely to be managerial staff or to belong to an intermediate profession than partial and non-avoiders. Partial avoiders did not have a lower income per household unit, but they were in the middle class.
Participants avoiding gluten were more likely to report having allergies. The percentage of individuals self-reporting allergies increased along with the avoidance of gluten in the diet. Gluten avoiders were also more likely to adhere to another specific diet, especially lactose-free diet, but also the vegetarian diets or both.
Nutritional characteristics
Table 2 presents nutrient intake across gluten avoidance groups. First, total energy intake decreased as gluten is avoided. Individuals avoiding gluten also exhibited a lower overall protein intake but a higher proportion of vegetable protein relative to total intake, a higher PUFA and MUFA intake as well as a lower SFA intake. As regards, nutrient levels increased or decreased along with the avoidance of gluten. Intake of total carbohydrates and complex carbohydrates was lower among individuals avoiding gluten, while sugars and fibre intake was higher. Partial avoiders had an intake of simple sugars lower than total avoiders, but similar to non-avoiders. Regarding micronutrients, gluten avoiders exhibited healthier nutritional profiles with, for instance, higher intake of C, D, E vitamins and folate. For minerals, people avoiding gluten also exhibited a higher intake of Mg, K, Cu and Fe. On the other hand, they showed a lower intake of Ca, Na, P, Zn and haem-Fe. As for macronutrients, a gradient was observed from total avoiders to non-avoiders or from non-avoiders to total avoiders, as appropriate, except for Mg, Fe and haem-Fe. Intake of Mg, Fe and haem-Fe was no different between total and partial avoiders. Concerning the adherence to the French nutritional references, gluten avoiders exhibited healthier dietary patterns with a higher PANDiet score (total avoiders > partial avoiders > non-avoiders, P < 0·0001).
Table 2. Nutritional intake profiles among total, partial and non-avoiders
(Mean values and 95 % confidence intervals)
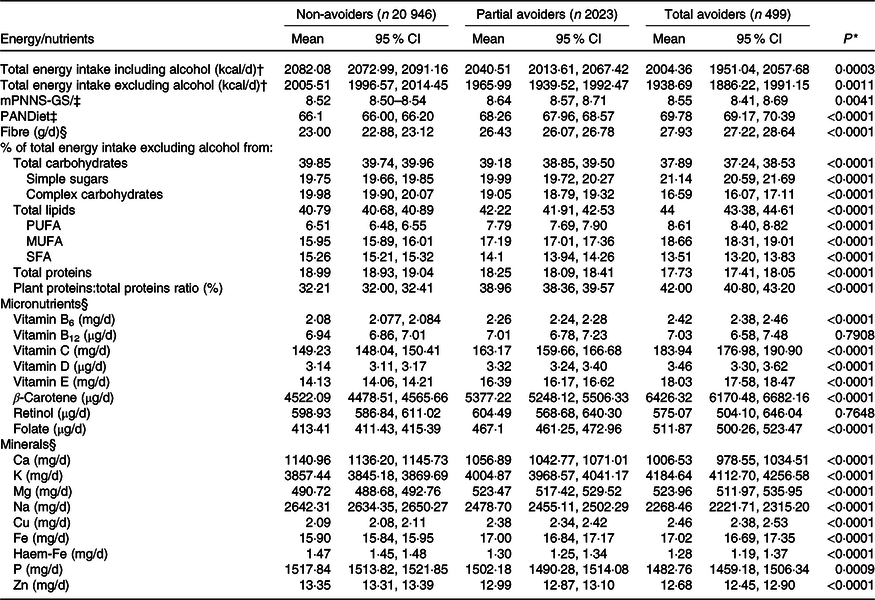
mPNNS-GS, Modified French Programme National Nutrition Santé-Guideline Score; PANDiet, probability of adequate nutrient intake.
* P values are based on ANCOVA test adjusted for age and sex.
† To convert kcal to kJ, multiply by 4·184.
‡ P values are based on ANCOVA test adjusted for total energy intake (without alcohol), age and sex.
§ Adjusted for total energy intake (without alcohol) using the residual method.
Food intakes and level of organic food consumption
Individuals avoiding gluten (partial or total) showed a higher consumption of foods mostly consumed as unprocessed (vegetables, fruits, legumes, fish, eggs, nuts and oils) and a lower consumption of fatty and/or sweet processed foods (processed meat, cookies, sweet, fast food, dressing and butter and sweet beverages) compared with non-avoiders (Table 3). They also exhibited a lower consumption of meat and dairy products and higher consumption of their substitutes than non-avoiders. Specifically, partial avoiders had a higher consumption of whole starchy food and soups, and lower consumption of fruit juices. However, snacks products were largely consumed by individuals avoiding gluten (1·5–2 times more).
Table 3. Comparisons of mean intakes of food groups (in g/d) and contribution of organic food according to gluten avoidance*
(Mean values and 95 % confidence intervals)
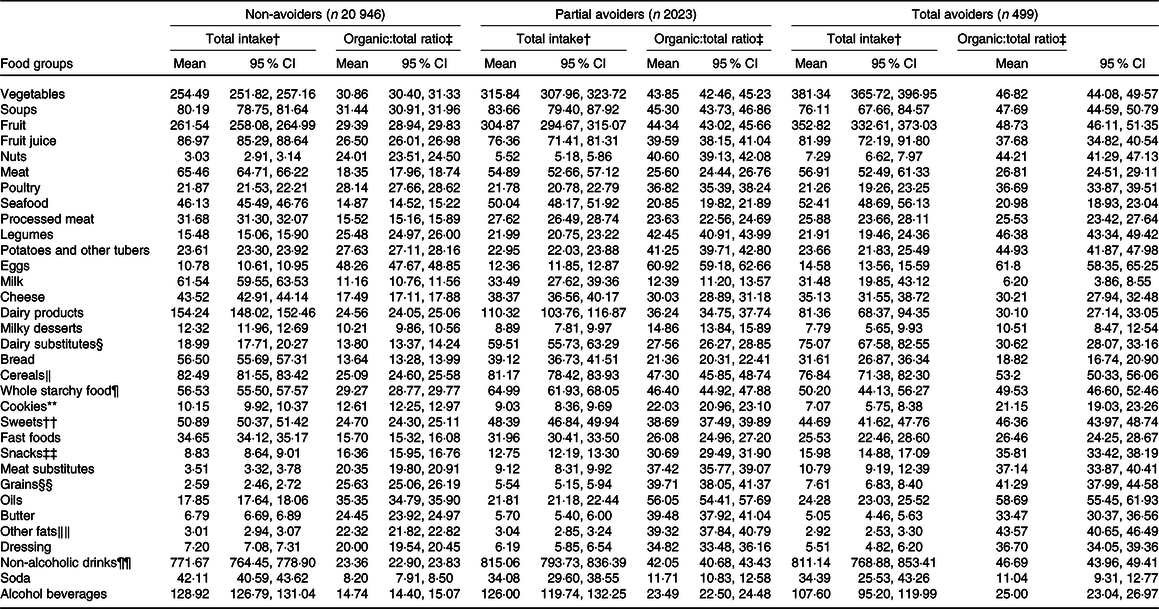
* All P values <0·0001.
† P values are based on ANCOVA test adjusted for total energy intake, age and sex.
‡ P values are based on ANCOVA test adjusted for age, sex and consumption of food group.
§ Including soya yogurt, plant-based cheese, vegan fresh cheese and soya milk.
‖ Including pasta, white rice, muesli, semolina and cereals.
¶ Including whole bread, whole-grain rice and whole-grain pasta.
** Including pastries, brioche and biscuits.
†† Including jam, honey, sugar, sweeteners, confectionery, chocolate and chocolate spread bars, cakes, brownies, pancakes and ice cream.
‡‡ Including chips, popcorn, salted aperitif cakes, peanuts, almonds and pistachio nuts.
§§ Including sprouted seeds, bran and wheat germs.
‖‖ Including mayonnaise, fresh cream and fresh plant cream.
¶¶ Including coffee, tea, chicory, hot chocolate and water.
The proportion of organic food in the diet was significantly higher among people avoiding gluten. Overall, 48·50 % of total avoiders and 40·04 % of partial avoiders consumed more than 50 % of products coming from organic production in their diet, compared with 17·38 % of non-avoiders (data not tabulated).
Individuals avoiding gluten consumed a higher proportion of organic foods for most food groups compared with non-avoiders except for dairy products. Partial avoiders differed from total avoiders by a higher proportion of organic food for dairy products, bread and butter. Among gluten avoiders (total or partial), food groups for which the contribution of organic food exceeded 40 % for both groups were eggs, fruits, vegetables, legumes, nuts, potatoes, whole starchy food, cereals, oils and non-alcoholic drinks (coffee, tea, chocolate, except soda).
Table 4 shows the association between exclusion diets and consumption of organic foods. Compared with non-avoidance, gluten avoidance was positively associated with a higher consumption of organic foods (adjusted ORQ5 v. Q1 = 4·81 (95 % CI 4·09, 5·67) for partial gluten avoidance and adjusted ORQ5 v. Q1 = 4·95 (95 % CI 3·70, 6·63) for total gluten avoidance). Combining gluten avoidance and lactose-free diets was also strongly associated with the consumption of organic products (adjusted ORQ5 v. Q1 = 9·22 (95 % CI 6·24, 13·64)).
Table 4. Multinomial logistic regression analysis showing the association between consumption of organic foods and diet practices*
(Adjusted odds ratios (aOR) and 95 % confidence intervals)
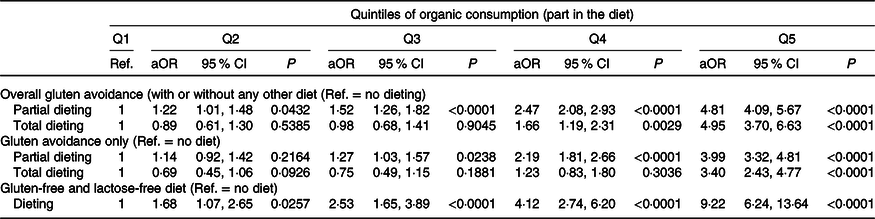
Ref., reference.
* Model adjusted for age, sex, education level, occupational category, income, physical activity, smoking status, alcohol and total energy intake without alcohol.
Place of purchase of individuals avoiding gluten
Gluten avoiders purchased more often organic foods in specialised organic stores compared with non-avoiders (48 % of total avoiders, 42 % of partial avoiders and 21 % of non-avoiders) (Fig. 2). In non-avoiders, supermarkets were the main place of purchase (53 %), followed by markets (23 %).
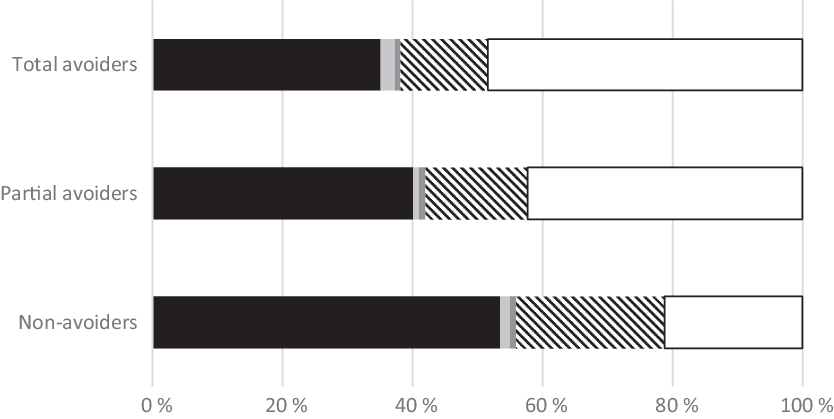
Fig. 2. Frequency of places of purchase of organic food according to gluten avoidance. ![]() , Supermarkets;
, Supermarkets; ![]() , hard discount;
, hard discount; ![]() , grocery stores;
, grocery stores; ![]() , markets;
, markets; ![]() , organic stores.
, organic stores.
Adjusted models for sociodemographic factors between gluten avoidance and organic food place of purchase showed that individuals purchasing mostly in organic stores were more likely to avoid gluten (organic stores v. supermarkets: OR = 2·64 (95 % CI 2·35, 2·97) for partial gluten avoiders, and OR = 3·47 (95 % CI 2·78, 4·34) for total gluten avoiders) (Table 5). A positive association was also observed between total gluten avoiders and organic food purchase in hard discount. Other food purchase place showed no association with gluten avoidance.
Table 5. Multinomial logistic regression analysis showing the association between place of purchase and gluten avoidance
(Odds ratios and 95 % confidence intervals)
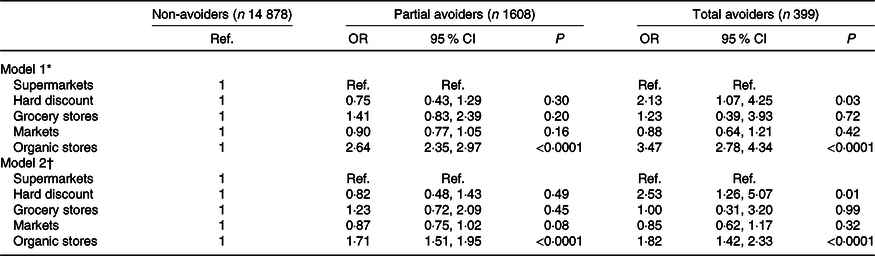
Ref., reference.
* Model 1 adjusted for age, sex, education level, occupational category, income, physical activity and smoking status.
† Model 2 adjusted for age, sex, education level, occupational category, income, physical activity, smoking status and consumption of organic food.
Further adjustment for total organic food consumption showed similar but attenuated association for organic stores. In contrast, the relationship between total gluten avoidance and purchase in hard discount slightly increased. Sensitivity analyses, replacing markets by shopping centres as the reference on 1002 exaequo data, showed similar results for the two models (online Supplementary Table S1).
Discussion
The present study is one of the first to consider the association between the contribution of organic food in the diet among a large sample of individuals and the avoidance of gluten using detailed dietary data. We found a marked positive association between gluten avoidance and contribution of organic food to the diet. A gradient was also observed with total avoiders consuming more of organic food than partial avoiders. This contribution was higher for all types of products, except milk and dairy products. These results appear consistent with the motives reported by individuals avoiding gluten, including health: individuals without CD who avoid gluten are concerned by health and adopt this behaviour considered healthier(Reference Gaesser and Angadi6,Reference Gaesser and Angadi7,Reference Reilly9–Reference Lu, Zhang and Luoto11) . In our previous study, gluten avoiders reported as main motives are physical well-being (26 and 39 % for total and partial avoiders) and belief of a long-term health impact (22 and 28 %, respectively) and the total avoiders also reported allergy and/or intolerance (20 %)(Reference Perrin, Allès and Buscail24). It seems that gluten avoidance, like the consumption of organic food(Reference Ellison, Duff and Wang42–Reference Magnusson, Arvola and Hursti44), belongs to a global attitude for a healthy diet.
Sociodemographic profiles of gluten avoiders
Our study is concordant with previous works showing that gluten avoiders were more likely to be women(Reference Aziz, Lewis and Hadjivassiliou2,Reference Reilly9,Reference Cabrera-Chávez, Granda-Restrepo and Arámburo-Gálvez12,Reference Cabrera-Chávez, Dezar and Islas-Zamorano13,Reference Ontiveros, Rodríguez-Bellegarrigue and Galicia-Rodríguez15,Reference DiGiacomo, Tennyson and Green16,Reference Christoph, Larson and Hootman25) and to report multiple food intolerances and allergies(Reference Aziz, Lewis and Hadjivassiliou2,Reference Golley, Corsini and Topping8,Reference Cabrera-Chávez, Granda-Restrepo and Arámburo-Gálvez12,Reference Cabrera-Chávez, Dezar and Islas-Zamorano13,Reference Volta, Bardella and Calabrò45) , particularly lactose intolerance(Reference Golley, Corsini and Topping8,Reference Cabrera-Chávez, Granda-Restrepo and Arámburo-Gálvez12,Reference Cabrera-Chávez, Dezar and Islas-Zamorano13,Reference Volta, Bardella and Calabrò45) .
Sociodemographic characteristics and behaviours of organic food consumers have been widely described in the literature(Reference Davies, Titterington and Cochrane46–Reference Oates, Cohen and Braun48). We briefly reported them to identify concordance and discordance with individuals avoiding gluten. Like gluten avoiders, organic food consumers have been shown to be more likely to be women(Reference Baudry, Méjean and Allès36,Reference Davies, Titterington and Cochrane46–Reference Eisinger-Watzl, Wittig and Heuer50) . We observed that gluten avoiders in comparison with non-avoiders did not show any difference concerning education level and they were older than non-avoiders (between 55 and 64 years old). Studies investigating organic food consumers showed heterogeneous results regarding age and education level: younger(Reference Moon, Balasubramanian and Rimal51) or older(Reference Baudry, Méjean and Allès36,Reference Eisinger-Watzl, Wittig and Heuer50) , higher education level(Reference Baudry, Méjean and Allès36,Reference Schifferstein and Oude Ophuis52–Reference Dettmann and Dimitri54) or lower(Reference Thompson and Kidwell55,Reference Worsley and Lea56) . Unlike our results about gluten avoiders, several studies showed that organic food consumers had higher income(Reference Baudry, Méjean and Allès36,Reference Davies, Titterington and Cochrane46) and overall higher social status(Reference Eisinger-Watzl, Wittig and Heuer50,Reference O’Donovan and McCarthy57,Reference Petersen, Rasmussen and Strøm58) . Nevertheless, we observed differences between total and partial avoiders: partial gluten avoiders were more often managerial staff than total avoiders and their income was not low.
Outside sociodemographic characteristics, individuals avoiding gluten and organic food consumers exhibit many common lifestyle and food behaviours. Many studies reported this healthy lifestyle among organic food consumers(Reference Oates, Cohen and Braun48,Reference Eisinger-Watzl, Wittig and Heuer50,Reference Schifferstein and Oude Ophuis52,Reference Baudry, Allès and Péneau59,Reference Lockie, Lyons and Lawrence60) . In the present study, we observed that individuals avoiding gluten had similar behaviours: they were more likely to be physically active, to consume less alcohol and to be less likely to present obesity.
Dietary behaviours of individuals avoiding gluten – comparison with organic food consumers
Regarding food consumption and nutrient intake, individuals avoiding gluten showed a comparable diet to organic food consumers. As individuals avoiding gluten in our study, organic food consumers had a much higher consumption of vegetables, fruits, legumes, fish and nuts and a much lower consumption of meat, processed meat, sweet and fatty products, dairy products and sweet beverages than non-avoiders(Reference Oates, Cohen and Braun48,Reference Eisinger-Watzl, Wittig and Heuer50,Reference Petersen, Rasmussen and Strøm58,Reference Baudry, Allès and Péneau59,Reference Torjusen, Lieblein and Næs61,Reference Pelletier, Laska and Neumark-Sztainer62) . We also observed that participants who avoid gluten were characterised by a high intake of plant-based food. This feature was also observed among organic food consumers(Reference Baudry, Allès and Péneau59). Individuals avoiding gluten presented similar nutrient profiles than those observed in organic food consumers(Reference Petersen, Rasmussen and Strøm58,Reference Torjusen, Lieblein and Næs61–Reference Baudry, Touvier and Allès63) : they had a lower total energy intake, a higher proportion of energy from PUFA and intake of fibre, and a smaller proportion of energy from saturated fat and intake of protein. Like organic food consumers, they presented a better nutritional diet quality: the PANDiet score was highest with a gradient for more gluten avoidance. In the present study, as previously reported among organic food consumers(Reference Schifferstein and Oude Ophuis52,Reference Petersen, Rasmussen and Strøm58,Reference Baudry, Allès and Péneau59,Reference Baudry, Touvier and Allès63) , we also observed a higher proportion of individuals reporting to be vegetarians among gluten avoiders compared with individuals who do not avoid it.
The contribution of organic food in the diet of gluten avoiders was higher for all products, except milk because its overall consumption was low. Organic food consumers reported the same trends in food groups(Reference Oates, Cohen and Braun48): the most popular organic food groups were eggs in first, fruits and vegetables, whole starchy foods and oils, and the least popular were meat and dairy products.
The data of this study are in accordance with ones of a recent US study about people who value gluten-free products(Reference Christoph, Larson and Hootman25). In this study, individuals who value gluten-free products had healthy behaviours: they had a higher consumption of vegetables and fruits and a lower consumption of sugar-sweetened beverages as well as a higher intake of fibre and lower intake of saturated fat. Finally, they reported that individuals who value gluten-free products not only value organic food but also unprocessed food and local food.
Many characteristics are shared by people avoiding gluten and organic food consumers: they are physically active, consume less alcohol, have a higher consumption of fruit and vegetables and a lower consumption of meat. It seems that people without CD avoiding gluten may be a specific group of organic food consumers. They are characterised by additional behaviours of food exclusion.
Place of purchase
The analysis of place of purchase showed that nearly half of the gluten avoiders bought organic food in organic stores against about 20 % for non-avoiders. This association between gluten avoidance and purchase in organic stores remained even after adjustment for total consumption of organic food. To the best of our knowledge, no study investigated the place of purchase of products among people avoiding gluten. In fact, we had no information on the main reasons for this choice: specifically, we were not able to identify whether gluten avoiders purchase their organic food in organic stores because they prefer organic food and then buy gluten-free foods due to the large offer, or if they choose to buy gluten-free foods in organic stores due to large offer and thus also consumed organic foods. Surprisingly, we also observed an association between total gluten avoidance and purchase in hard discount which may be explained by the fact that in our study, the total gluten avoiders were more likely to have a lower income.
Strengths and limitations
Several limitations of this study should be mentioned. First, the participants enrolled in our study were volunteers in a nutrition cohort and were probably more interested in nutritional issues and had healthier lifestyle issues than the general population. They exhibited particular characteristics when compared with the general French population(Reference Andreeva, Salanave and Castetbon64,Reference Andreeva, Deschamps and Salanave65) . As the food exclusion and org-FFQ questionnaires were optional, participants excluding food and high organic food consumers were certainly more willing to fill in these questionnaires. However, the proportion of non-consumers of organic food was similar to the national figures(66). Second, all data in this study were self-reported, which may be prone to measurement errors and desirability bias(Reference Kesse-Guyot, Assmann and Andreeva67). Third, no information was available on the consumption of gluten-free substitutes and their specific nutritional values in our sample. This lack might lower estimations of nutrient intakes in gluten avoiders. Finally, due to the cross-sectional design of our study, we were not able to determine whether gluten avoidance led to a higher consumption of organic products, or if participants who had a high consumption of organic products were more likely to avoid the gluten.
This study also showed important strengths. The first was its large sample size, which provides an access to a wide diversity of dietary behaviours. It also allowed for control of potential effects of confounding factors. A further strength was the use of a Org-FFQ: it was based on a validated FFQ which had shown relative validity and reproducibility(Reference Kesse-Guyot, Castetbon and Touvier35), and it included a very large range of foods (264 items) enabling to estimate usual diet over the previous year. The use of the Org-FFQ enabled to provide detailed data and allowed to assess the proportion of organic foods per type of food and in the whole diet. This strength is major because the only study which related gluten avoidance and organic food was only based on the perception of foods rather than actual consumption(Reference Christoph, Larson and Hootman25).
In conclusion, the present study provides new insights into the characterisation of individuals without reported CD avoiding gluten. These findings underline a strong positive correlation between gluten avoidance and organic food consumption. It appears that gluten avoidance for non-coeliac individuals is a subset of organic food consumers who are often related to other specific dietary practices (vegetarians) and to adoption of healthy behaviours. It would be important to take this thought into account in future studies. Future research is needed to better understand the relationship between gluten avoidance and organic food consumption.
Acknowledgements
The authors thank Cédric Agaesse (dietitian); Thi Hong Van Duong and Younes Esseddik (IT manager), Régis Gatibelza, Djamal Lamri, Jagatjit Mohinder and Aladi Timera (computer scientists); Julien Allegre, Nathalie Arnault, Laurent Bourhis and Fabien Szabo de Edelenyi, PhD (supervisor) (data-manager/statisticians) for their technical contribution to the NutriNet-Santé study and Nathalie Druesne-Pecollo, PhD (operational coordination). The authors thank all the volunteers of the NutriNet-Santé cohort.
This study is part of the GlutN project that was supported by the French National Research Agency (Agence Nationale de la Recherche) in 2017 (AAPG ANR 2017). The NutriNet-Santé cohort study is funded by the following public institutions: Ministère de la Santé, Santé Publique France, Institut National de la Santé et de la Recherche Médicale, Institut National de la Recherche Agronomique (INRA), Conservatoire National des Arts et Métiers (CNAM) and Paris 13 University. The funders had no role in study design, data collection and analysis, decision to publish or preparation of the manuscript. Study sponsors had no part in study design, collection, analysis and interpretation of data and the writing of the article and the decision to submit it for publication.
The authors’ contributions were as follows: L. P. and E. K. G. designed the research; B. A., C. B., S. H., M. T., C. J., D. L., J. B. and E. K. G. conducted the research; L. P. performed statistical analysis and drafted the manuscript; E. K. G. supervised statistical analysis and the writing; L. P., B. A., C. B., S. H., M. T., C. J., D. L., J. B. and E. K. G. contributed to the data interpretation and revised each draft for important intellectual content. All authors read and approved the final manuscript. E. K. G. had primary responsibility for the final content, she is the guarantor.
The authors declared no support from any institution for the submitted work.
Supplementary material
For supplementary material referred to in this article, please visit https://doi.org/10.1017/S0007114520003323


