


There remains debate over the existence(Reference Alberti and Zimmet1, Reference Gale2) and definition(Reference Alberti and Zimmet3, 4) of the metabolic syndrome (MS). Both the Adult Treatment Panel (ATP) III(5) criteria and the International Diabetes Federation (IDF)(4, Reference Alberti, Zimmet and Shaw6) accept that waist, as a measure of central obesity, is more highly associated with metabolic risk factors than waist:hip ratio (WHR), BMI or body fat percentage. ATPIII and IDF criteria for fasting glucose, TAG, HDL-cholesterol and blood pressure are identical(7), but the waist cut-off differs (for example, among Europeans, ATPIII v. IDF criteria 102 cm v. 94 cm (men) and 88 cm v. 80 cm (women) respectively). The combinations of classification criteria also differ: for ATPIII it is any three criteria that may or may not include waist and for IDF waist is mandatory with any two other criteria. Waist measurement is a simple and clinically useful measure as an initial screen for further testing for metabolic risk factors. While it would be useful to classify subjects according to metabolic or disease outcomes this requires longitudinal studies with the additional problem that the waist measurement changes with the disease process.
It is recognised that there are ethnic differences in MS classification criteria and utility in the Asia Pacific region(Reference James8) and the IDF recommends different ethnic group- and country-specific waist cut-offs(4, Reference Hara, Matsushita and Horikoshi9). Neither approach includes cut-offs that apply to people of Polynesian origin such as the indigenous New Zealand Polynesian population, Maori. It is established that for the same height and weight Polynesian people have less fat and are more lean than Europeans(Reference Rush, Plank and Chandu10, Reference Rush, Goedecke and Jennings11): obesity in adult Polynesians is defined as a BMI >32 kg/m2. No waist criteria have been defined for Polynesians, a group with a high prevalence(Reference Joshy and Simmons12) of known type 2 diabetes (8 %) and CVD (12 %)(Reference Blakely, Ajwani and Robson13) as well as obesity (>25 %) and smoking (>45 %). The early identification of individuals most at risk in this high-risk population may allow more timely intervention (for example, through targeted intensive lifestyle interventions(Reference Pan, Li and Hu14–Reference Knowler, Barrett-Connor and Fowler16)).
In the present study, we investigated optimal waist cut-offs, in a Maori cohort without known diabetes, to identify subjects with two or more risk factors for diabetes and/or CVD. This analysis aims to answer a practical question – which waist cut-off best identifies subjects with risk factors (blood pressure, glucose and lipids) that characterise the MS? A secondary aim was to identify whether WHR, BMI or percentage body fat would also be useful to identify subjects at risk.
Research design and methods
The population included was defined by the boundaries of the Waikato District Health Board, and the tribal area of Ngati TuWharetoa in the neighbouring Lakes District Health Board as previously described(Reference Lim, Chellumuthi and Crook17). The age cut-off for entry was set at 28 years and over on 30 September 2005. Maori with past gestational diabetes mellitus, and those aged 23 years and over with two parents with known diabetes, were also considered eligible. Those with known diabetes, who were unfit to sign a consent form, with terminal disease or not permanently residing in the study area at the time of the baseline data collection were excluded. Ethical approval was provided by both the Waikato and Bay of Plenty Ethics Committees. All participants gave signed informed consent.
Measurements
Details of the Te Wai o Rona: Diabetes Prevention Strategy have been described previously(Reference Lim, Chellumuthi and Crook17). Briefly, after registration, blood for fasting glucose and lipids (HDL-cholesterol and TAG) was withdrawn and participants invited to undertake a 75 g 2 h oral glucose tolerance test. Glucose was measured by the Roche Hitachi glucose oxidase method (CV 5 %). Total cholesterol (CV 6 %), HDL-cholesterol (CV 4 %) and TAG (CV 8 %) were determined using a homogeneous enzymic colorimetric system (Roche Modular P800; Roche Diagnostics New Zealand Ltd, Auckland, New Zealand). LDL-cholesterol was then derived using the formula: LDL-cholesterol = (total cholesterol − (TAG/2·2) − HDL-cholesterol). Measurements and questionnaires, including smoking status, were completed after the fasting blood was sampled. Physical activity was kept to a minimum until after the 2 h blood was sampled for glucose.
Measurements included height without shoes using a stadiometer (0·5 cm); weight in light clothing and without shoes to the nearest ± 0·1 kg (Wedderburn TI-TH316 Personal scales; Wedderburn TI-BWB800 Personal scales (up to 200 kg) for oversize participants); standing waist ± 0·1 cm was measured at the lateral mid-point between the lower rib and the iliac crest and the hip circumference ± 0·1 cm at the level of maximum protrusion of the gluteal muscles. WHR and BMI (kg/m2) were derived. Lying hand-to-foot bioimpedance was determined (IMP5, 50 kHz; Impedimed, Queensland, Australia) and a Maori-specific validated equation(Reference Swinburn, Ley and Carmichael18) applied. After a minimum rest sitting for 5 min, blood pressure was measured in the supported arm using an Omron T8 electronic sphygmomanometer and a large cuff when necessary for oversize arms (>32 cm). All measurements were made in duplicate, and repeated if ± 10 mmHg. Components of the MS were defined using ATPIII criteria(5). Diabetes, impaired glucose tolerance and impaired fasting glucose were defined by WHO criteria(Reference Alberti and Zimmet3).
Statistics
Of the 5240 non-pregnant adults screened for diabetes, 4602 self-identified as Maori (approximately 13 % of the comparably aged Maori population in the recruitment area). Of these, 786 were excluded for missing laboratory data and/or anthropometry and blood pressure measurements. Those without full laboratory data (301 males and 419 females) were on average 5 years younger and 1 BMI unit less than those with such data. Data from the remaining 3816 were used for the present analysis and within these, 204 did not have a technically satisfactory measurement of body fat by bioimpedance. Data were analysed separately by sex. Mean and standard deviations summarised the continuous variables. Subjects were categorised by the presence or absence of risk factors, including smoking and dysglycaemia, impaired fasting glucose, impaired glucose tolerance or diabetes. Impaired fasting glucose was defined as fasting glucose between 6·1 and 6·9 mmol/l; impaired glucose tolerance was defined as 2 h glucose between 7·9 and 11·0 mmol/l; type 2 diabetes mellitus was defined as fasting glucose ≥ 7·0 mmol/l or 2 h glucose ≥ 11·1 mmol/l. If no oral glucose tolerance test was undertaken and the fasting glucose was ≥ 7·0 mmol/l and/or the random glucose was ≥ 11·1 mmol/l, diabetes was considered to be present. Receiver operating characteristic (ROC) curves, which are plots of the diagnostic sensitivity and specificity of the ability of waist, WHR, BMI or percentage body fat to detect the presence of at least two of the other MS components ( ≥ 2MS) or dysglycaemia, were examined. The shortest distance on the ROC curve (optimal sensitivity and specificity) was considered in the determination of cut-offs. Logistic regression analysis was used to determine the OR (95 % CI) of the presence of ≥ 2MS or dysglycaemia using the waist cut-off defined by the ROC and adjusted for sex, smoking and age. All statistical analysis was performed using SPSS (version 14; SPSS, Inc., Chicago, IL, USA).
Results
Descriptive
Anthropometric measurements besides BMI differed significantly by sex (Table 1) even after adjustment for age. Similarly, metabolic risk factors showed a different profile by sex (adjusted and unadjusted for age) with a higher prevalence of low HDL in women, and higher blood pressure, TAG and fasting glucose in men. Of the population, 42·1 % had ≥ 2MS besides waist. One in three reported currently smoking and more women than men smoked.
Table 1 Baseline characteristics of 3816 Maori by sex
(Mean values and standard deviations or percentages)
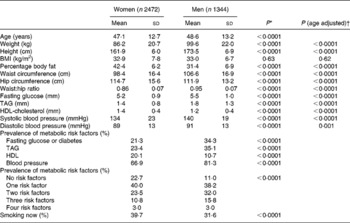
* Unpaired t test, two-tailed.
† Analysis of covariance: female v. male with age as covariate.
The increasing prevalence of frequency of risk factors within each waist decile is shown in Fig. 1. There is a linear trend (P < 0·0001) for an increasing number of risk factors across the range of waist for males and females. It must be noted that in the lowest decile of waist, 53 % of women and 36 % of men are without other MS components and in the highest decile, 6 % of women and 5 % of men have no other MS components.
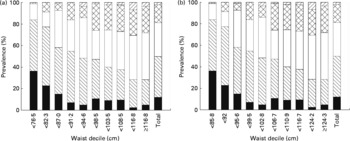
Fig. 1 Prevalence of number of metabolic syndrome risk factors (0–4) by deciles of waist measurement for women (a) and men (b). (■), No risk factors; (▧), one risk factor; (□), two risk factors; (![]() ), three risk factors; (▨), four risk factors.
), three risk factors; (▨), four risk factors.
Sensitivity and specificity analyses
In males and females, waist was as good a predictor of ≥ 2MS as BMI or percentage body fat (Table 2). In women, but not men, waist was a better predictor than WHR. Waist circumference of ≥ 2MS Maori women and men was 97 and 102 cm (Table 2). WHR, BMI and percentage body fat were 0·84, 32 kg/m2 and 42 % for women and 0·93, 30 kg/m2 and 30 % for men. The prediction of dysglycaemia using anthropometric variables followed a similar pattern to ≥ 2MS. Optimal thresholds of waist, WHR, BMI and percentage body fat were 98 cm, 0·84, 33 kg/m2 and 44 % for women and 103 cm, 0·95, 33 kg/m2 and 30 % for men.
Table 2 Optimal sensitivity and specificity thresholds for the detection of two or more metabolic risk factors and dysglycaemia (diabetes: impaired glucose tolerance or impaired fasting glucose risk) from anthropometric measures
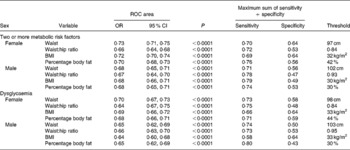
ROC, receiver operating characteristic.
Logistic regression
Using the waist criteria defined by the ROC analysis of 98 cm for women and 103 cm for men with adjustment for sex, smoking and age (48 years) the adjusted OR for ≥ 2MS was 3·5 (95 % CI 3·1, 4·0) (Table 3). As OR are multiplicative, a waist greater than 98 or 103 cm (OR 3·5), being male (OR 1·7), smoking (OR 1·3) and aged more than 48 years (OR 1·7) multiplies to the odds of having ≥ 2MS being 13·1 times higher. If waist were set at 98 or 103 cm and applying IDF criteria for other risks, then 27·8 % (34·0 % males, 25·5 % females) would be identified with the MS (Table 3). Addition of the Maori BMI cut-off of 32 kg/m2 to the model increased the adjusted multiplicative OR to 18·0 (unadjusted OR for BMI 3·2; 95 % CI 2·9, 3·8).
Table 3 Unadjusted and adjusted risk factors for the presence of two or more metabolic risk factors and dysglycaemia
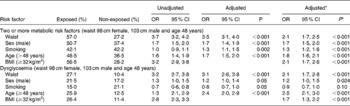
* Model with BMI ≥ 32 kg/m2 included.
If any three ATP components are used to define the MS (using the new Maori waist cut-offs) (waist 98 cm females, 103 cm males), then 32·4 % (29·0 % females, 38·6 % males) would be identified with the MS. If the original ATPIII waist criteria(5) are used instead, then 36·6 % (34·6 % females, 40 % males) would be identified with the MS.
Discussion
The present study is the first in a Maori, or any Polynesian, population showing detailed analysis of waist circumference cut-off points for the detection of dysglycaemia and two or more risk factors for the MS. The waist cut-off for women was 98 cm and 103 cm for men. While for men, 102 cm is the same magnitude as recommended by the ATPIII, for women the waist is larger than the required 88 cm. As more than one-third of the subjects using the criteria of ATPIII are identified as at risk (35 % women and 40 % of men), the implications both for healthcare policy and treatment need to be attended to urgently. This prevalence compares well with an earlier study of the prevalence of the MS among Maori aged >40 years using ATPIII criteria(Reference Simmons and Thompson19). Two or more risk factors were chosen as the diagnostic criteria to fit the IDF criteria for the MS. From Fig. 1 it can be clearly seen that with increasing waist there is an increase in the prevalence and number of risk factors but there is no clear point where risk increases. Cut-off points are arbitrary and risk exists across the range of waist circumference; further diagnostic tests and treatment depend on resources available. Therefore general public health advice should support maintaining or reducing waist circumference.
Maori compared with Europeans have more central fat and less peripheral fat than Europeans(Reference Rush, Plank and Chandu10, Reference Rush, Goedecke and Jennings11), have a higher prevalence of obesity(20) and are at more risk for and have a higher prevalence of diabetes(Reference Joshy and Simmons12). In agreement with others(Reference Klein, Allison and Heymsfield21) we have shown that the utility of the waist measurement is comparable with or better than WHR or BMI to detect the MS and dysglycaemia characteristics. Percentage body fat showed similar utility for the detection of those with metabolic risk or dysglycaemia. However, WHR and BMI have the limitation that two measurements are required and percentage fat is more limiting as the measurement requires both more expensive equipment and skill.
Sexual dimorphism for waist cut-off in Europids has shown a difference of 14 cm(4, 5), while in Japanese(Reference Alberti, Zimmet and Shaw6) there was only a 5 cm difference (with women having a larger waist) where the cut-off was determined by visceral fat measurements. The waist for Chinese and South Asian men is also larger, 10 cm, than women. We also showed a 5 cm difference by sex in waist cut-off for Maori, with men having the higher waist.
The debate about the general utility of the diagnosis of the MS includes evidence that for ethnic groups with a small frame size, for example, Asian, the application of the current BMI or ATPIII or IDF waist criteria may underestimate(Reference Lear, Humphries and Kohli22, Reference Huxley, James and Barzi23) the risk and require lower anthropometric cut-points. However, this is the first study to investigate the question of appropriate cut-offs in a population that has a larger frame size and increased muscularity and less fat(Reference Rush, Plank and Chandu10, Reference Rush, Goedecke and Jennings11) at the same BMI as Europeans. It has been recently shown, using dual X-ray absorptiometry region of interest analysis, that for the same height and weight, total abdominal fat mass of Maori is not different to Europeans(Reference Rush, Freitas and Plank24), which gives rise to further questions about intra-abdominal v. subcutaneous fat differences and also differences in skeletal muscle characteristics that we are unable to answer. A further criticism of metabolic risk criteria is that they may not include allowances for the effects of smoking or age(Reference Calle, Thun and Petrelli25). While we are able to show increased metabolic risk with smoking, this risk is relatively small compared with the multiplicative risk of waist, age and sex. Prospective studies and robust physical measures such as intimal medial thickening(Reference Matoba, Inoguchi and Nasu26) as markers of early disease (before waist may decrease) are required to test the proposed cut-offs. Other Polynesian populations including those in the USA, for example, Hawaiians and Samoans and indigenous populations at high risk also need to test these findings.
There is reassurance that the current BMI cut-off of 32 kg/m2 used for Maori obesity has some clinical relevance in risk assessment. We are now able to show that waist measurements of 98 cm for women and 103 cm for men have similar utility in identifying Maori at risk and in combination with BMI and other risk factors such as smoking and hypertension could be used to justify further evaluation.
There is a range of caveats to the interpretation of these data. The subjects were recruits into a trial of lifestyle change to prevent diabetes which unfortunately did not continue; these data are therefore cross-sectional. Some recruits had missing data (largely fasting blood data) and were not included in this analysis but were to be included within analyses of the impact of the trial on, for example, anthropometry alone. The trial may have attracted those who were symptomatic as it was an opportunity to be screened for diabetes. Conversely, those attending for a lifestyle trial are possibly more likely to lead a healthier life(Reference Buckley, Murphy and Byrne27) and to have started making healthier food and physical activity choices, which would impact on the risk of dysglycaemia. Notwithstanding this, the vast majority were obese and hence selection bias is unlikely to have had a major impact on the nature of the cohort. The cohort represents approximately 25 % of Maori women and < 15 % of Maori men aged 28 years of more in the area, again suggesting that caution should be used in extrapolating these findings to the wider local or national Maori population.
In conclusion, we have shown that higher waist cut-offs should be used in defining the MS and for clinical studies among Maori. Our data also suggest that BMI might provide additional information regarding CVD risk among Maori.
Acknowledgements
All authors substantially contributed to the design of the experiment, collection of data, analysis of data, writing of the manuscript, and provision of significant advice and consultation in its preparation. The project was led by D. S. with E. C. R. in the Waikato and N. C. in the Lakes District.
Funding was provided by the Health Research Council (grant number 04/071), Waikato District Health Board, Lakes District Health Board, Ministry of Health, Sport and Recreation New Zealand, Southern Trust, Waikato Local Diabetes Team and Merck Sharp & Dohme. Support in kind was provided by Roche Diagnostics, Pathlab, Medlab, University of Auckland, Auckland University of Technology, Wintec, Te Hotu Manawa Māori, Eggs Inc., Vodafone, Rivermill Bakers and Sun Fruit. D. S. acknowledges the support of the NIHR Cambridge Biomedical Research Centre.
We thank the investigator group, Kaitiaki, Maori Community Health Workers, Te Wai o Rona: Diabetes Prevention Strategy Project team and local health service staff for their varied contributions to the study.
The authors state that they have no conflicts of interest.


