


Large bodies of epidemiological data show an inverse relationship between dietary fibre intake and body weight(Reference Miller, Niderpruem and Wallace1–Reference Davis, Hodges and Gillham5) so that the logic and simplicity of including fibre in an energy-controlled diet remains tantalising. As a component of food, fibres are found in a fermentable (soluble) or non-fermentable (insoluble) form, but early research has been unable to show benefits from including either form in short term (3–4 weeks) ad libitum diets(Reference Howarth, Saltzman and McCrory6). This was also the case when the form of fibre was mixed linkage β-glucan, a soluble fibre delivered by oats(Reference Saltzman, Moriguti and Krupa Das7), well recognised for its cholesterol(Reference Ripsin, Keenan and Jacobes8) and glucose lowering(Reference Jenkins, Jenkins and Zdravkovic9) actions. In order to better expose the advantages apparent from epidemiological studies, more work is required in understanding the physical features of fibre, the food delivery system, and how these may work together to affect mechanisms associated with weight management, such as satiety, particularly over longer periods of time.
It is accepted that soluble fibre, by its viscous nature will not only increase upper gastrointestinal transit time, but also stimulate cholecystokinin (CCK) that will increase peristalsis(Reference Malkki and Virtanen10). The effects of other hormones are less clear, but the ileal brake formed by undigested foods in the distal gut (occurring with high fibre foods), in addition to the fermentation of soluble fibres in the large bowel are all seen as positive benefits of fibre. Meal studies are able to expose these mechanisms of action. This is done via assessment of biochemical markers and subjective measures of satiety, in addition to monitoring subsequent food intake after consumption of the test food. Studies of β-glucan have identified doses as low as 2 g may elicit acute lowering of glycaemia(Reference Kim, Behall and Vinyard11), while others suggest a minimum of 4 g(Reference Malkki and Virtanen10) may be required for other gastrointestinal effects, such as those causing the release of appetite hormones. However, meal test studies only define an acute situation in very controlled conditions.
In addition to the time factor, the food delivery system requires consideration. For example, the clinical effectiveness of fibres such as β-glucan may be reduced in certain foods. It has been shown that in bread making, endogenous enzymes in the bread reduce the viscosity of the β-glucan thereby decreasing its clinical effectiveness(Reference Kerckhoffs, Hornstra and Mensink12, Reference Andersson, Armo and Grangeon13). However, a recent satiety study(Reference Juvonen, Purhonen and Salmenkallio-Marttila14) looking at high-dose (10 g) β-glucan and appetite hormones has showed that a lower viscosity drink (with viscosity lowered using β-glucanases) increased the levels of certain appetite hormones such as CCK and glucagon-like peptide-1 (GLP-1) compared with the high viscosity version of the same drink. Nevertheless, such contrasts once again do not define what may happen when soluble fibres are consumed over time, as a change in hormones over a few hours does not necessarily translate to appetite and weight changes over a longer period of time.
The present study describes a 3-month randomised controlled dietary intervention trial, designed to review the specific effects of β-glucan from oat bran incorporated in an energy-restricted meal plan. The primary outcome was a difference in weight reduction between the control group and intervention groups. Secondary outcomes included a variety of biochemical measures linked with satiety or change in body weight, subjective satiety measures and perceived satisfaction with the product. Biochemical measures included fasting glucose, insulin, cholesterol, LDL, HDL, TAG, leptin, CCK, GLP-1, ghrelin, peptide YY (PYY) and PYY3-36. We hypothesised that the subjects receiving β-glucan would lose more weight than the subjects on the control diet, and that changes in appetite hormones may be detected due to mechanisms linking the satiety with ingestion of β-glucan.
Experimental methods
Subjects and recruitment
This was a 3-month parallel randomised controlled trial with female subjects, based on evidence that they may exhibit greater acute hormone changes with fibre intake(Reference Burton-Freeman, Davis and Schneeman15). There were three arms to the study with all the groups receiving advice on energy restriction and all the subjects receiving cereal products to include in their diets. The control group had relatively high fibre products with no oat β-glucan, while the intervention groups had similar products with added β-glucan at a moderate (MBG; 5–6 g/d) and at a high (HBG; 8–9 g/d) level. A sample size of twenty subjects per group was based on data from a previous study showing a 1·8 kg difference between a group supplemented with β-glucan and a control group, where both groups were consuming a energy-deficient diet(Reference Solum, Ryttig and Solum16). For a power of 80 %, seventeen subjects would be required in each group for this change to be significantly different at an α level of 0·05 and recruiting at least twenty subjects would allow for dropouts. Inclusion criteria advertised in local media were 19–45 years of age (pre-menopausal), BMI range from 25–32 kg/m2, non-smokers, no known food allergies and of general good health. The present study was conducted according to the guidelines laid down in the Declaration of Helsinki and all procedures involving human subjects were approved by the University of Wollongong, Human Ethics Committee (HE06/311). Written informed consent was obtained from all the subjects. The trial was registered with the Australian Clinical Trials Registry (ACTRN12607000126415).
The first seventy-seven of 215 enquiries were screened resulting in randomisation of sixty-six subjects, using a computer-generated sequence using random permuted blocks (Fig. 1). All the subjects, but not dietitians were blinded to their randomisation status within the trial. The subjects attended the study centre for a total of five times. Visits included collection of background dietary data using a validated diet history interview(Reference Martin, Tapsell and Denmeade17) and instruction on completion of a 3-d weighed food record, collection of fasting blood samples at baseline together with dietary education, two follow-up dietary visits and collection of fasting blood samples at 3 months. All the subjects had their height, weight and waist circumference recorded at each visit to the centre. The subjects were also contacted by telephone on one occasion in between the monthly visits to provide dietary review and support. Visual analogue scales (VAS) related to appetite(Reference Flint, Raben and Blundell18), food records and the Baecke Physical Activity Questionnaire(Reference Baecke, Burema and Frijters19) were all completed at baseline, half-way through the study and within the final week of the study. For the VAS, the subjects recorded their feelings on individual forms at six different time points throughout the day: immediately before each of the three main meals and 2 h after each of these meals. Markings by participants were measured in millimetres. All nutritional analysis was performed using FoodWorks 2007, version 5 (Xyris Software, Brisbane, QLD, Australia) with nutrient contents of study foods added as required.
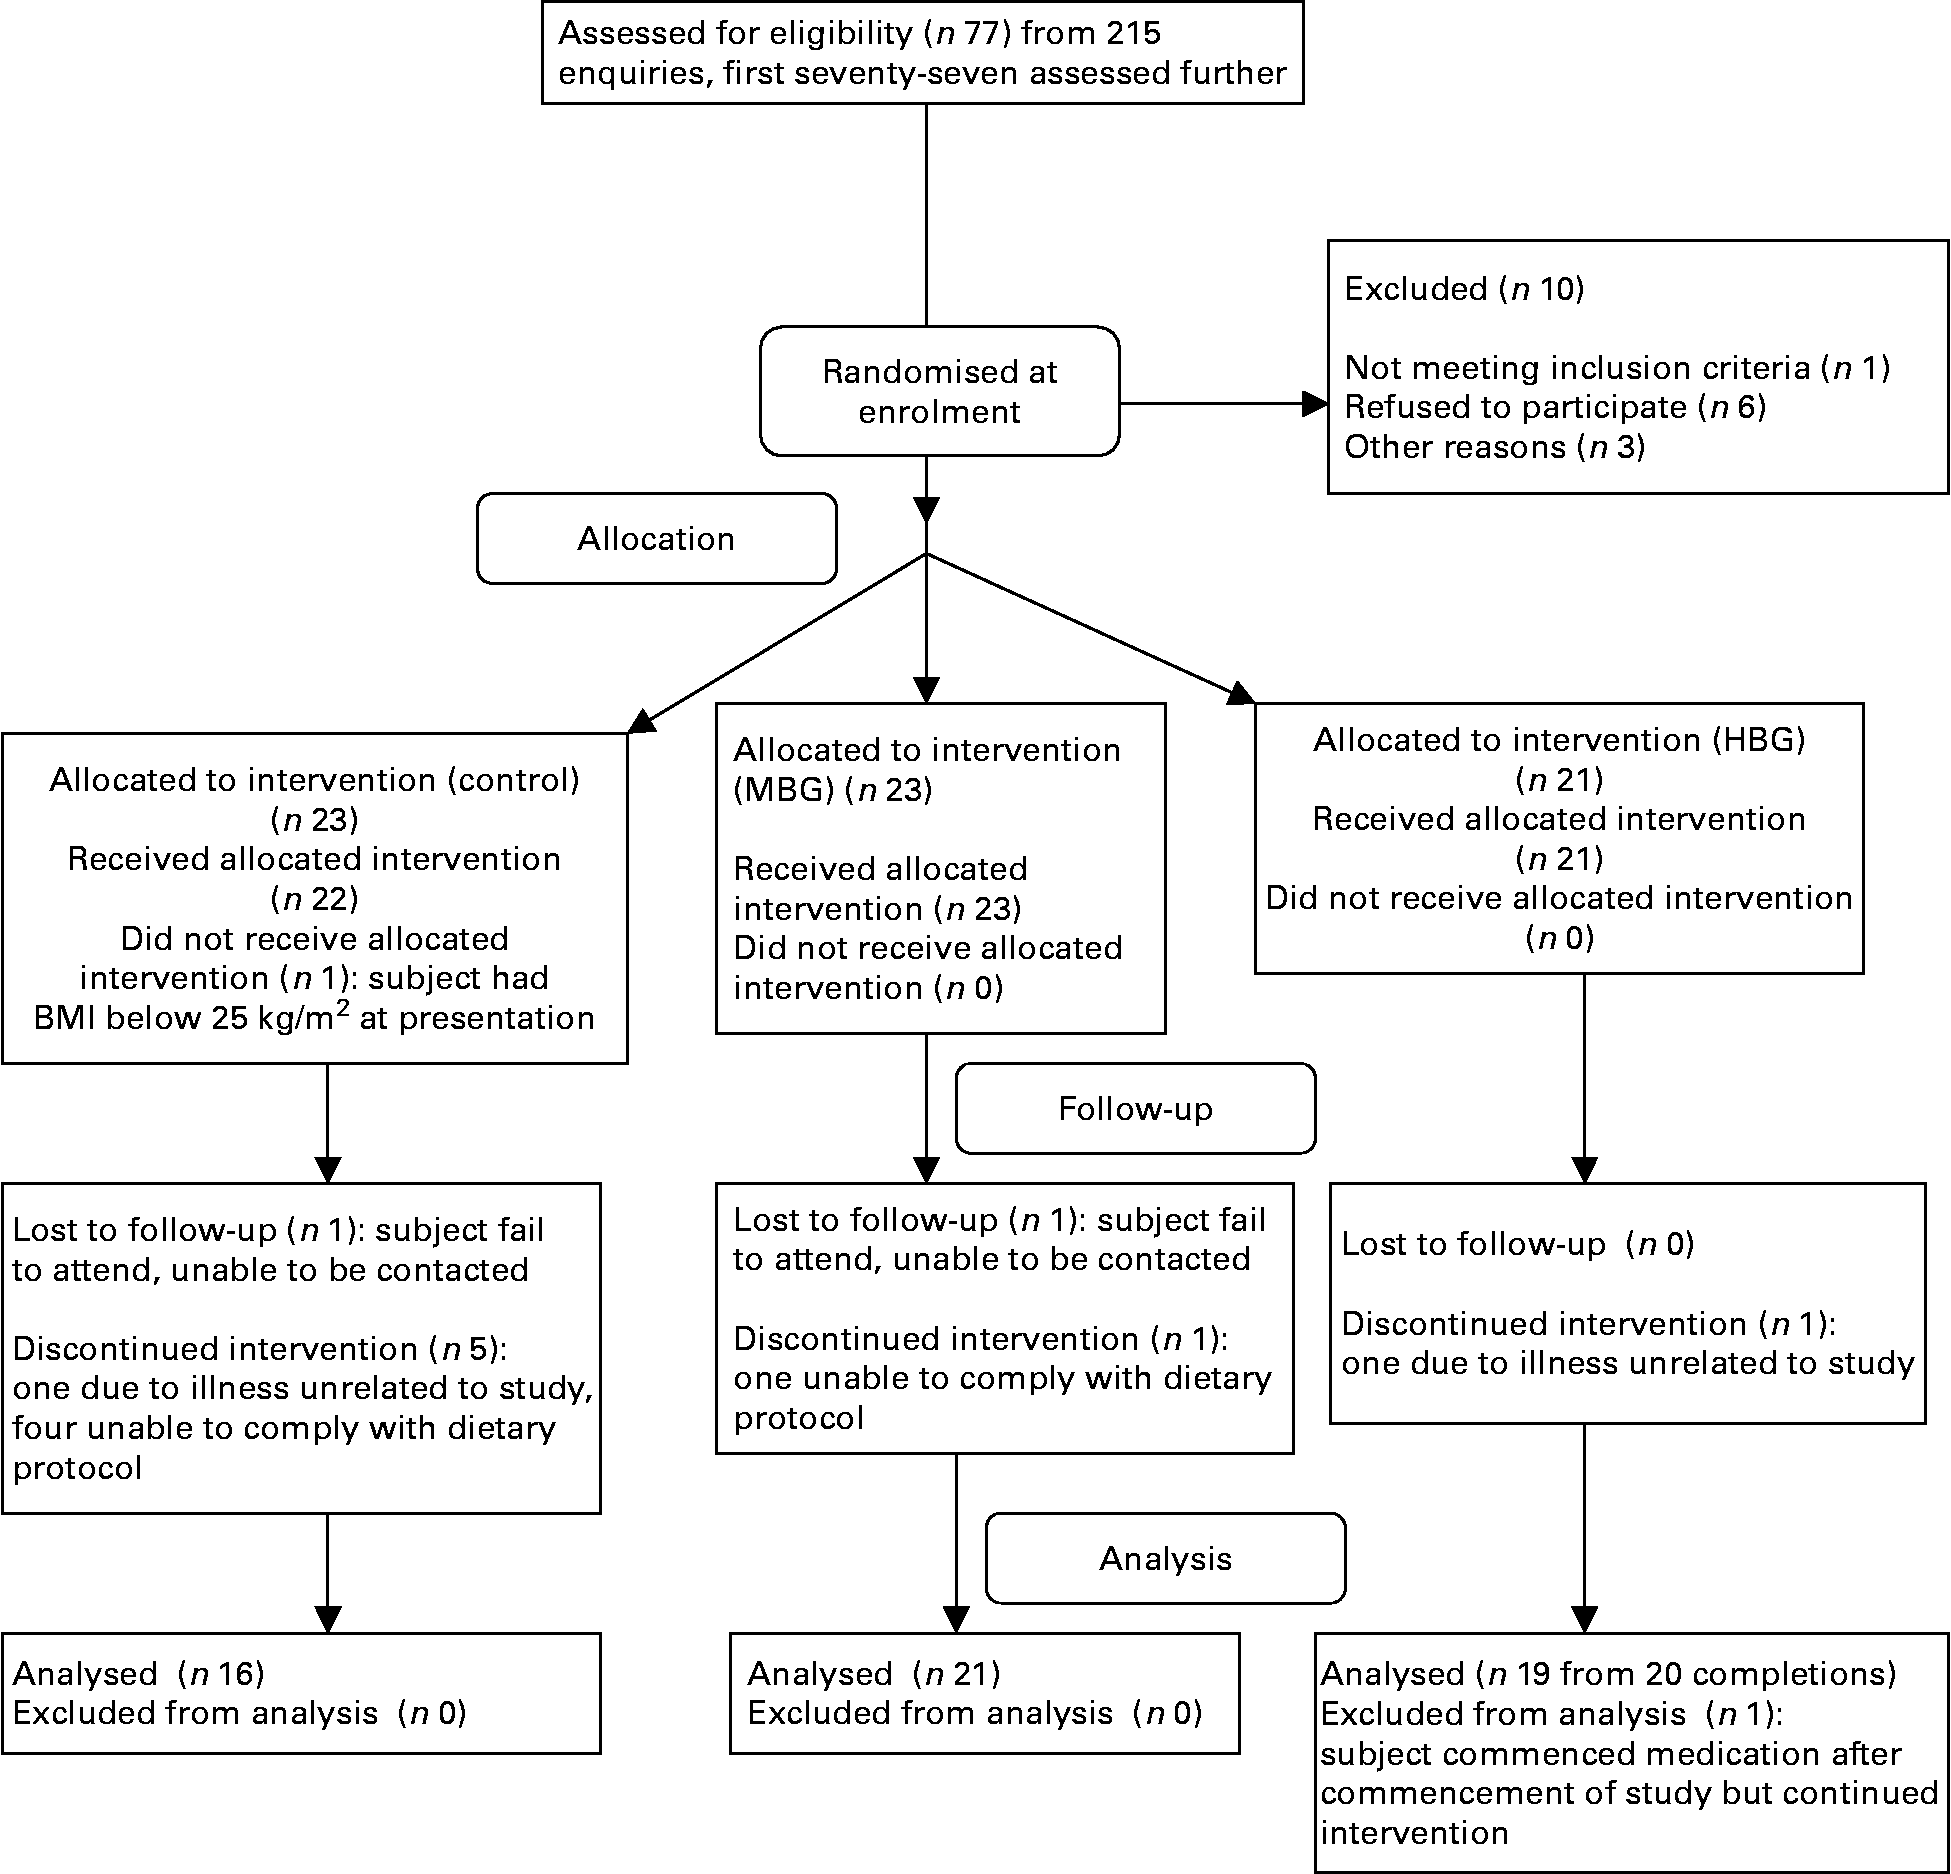
Fig. 1 Flow diagram of participation in the study. MBG, mid-dose β-glucan; HBG, high-dose β-glucan.
Dietary intervention
A basal metabolic requirement for energy was calculated for each subject using the Schofield equation using BMI equal to 25 kg/m2. A low activity factor (1·3) was chosen to estimate energy requirements and then 2000 kJ was subtracted from this level to a calculated weight loss of 0·5 kg/week. Intervention diets were designed to control for all macronutrients with the only variation in total fibre, primarily β-glucan such that a typical diet, as described in Table 1 only varied in the trial products given. Product development for cold and hot cereals as well as additional snack items took place in a pilot processing plant by qualified cereal food technologists. The source of β-glucan was a commercially available oat bran with 22 % β-glucan. The subjects were instructed to eat the cereal provided at breakfast (ready-to-eat (RTE) cereal or porridge) and two snack items at afternoon tea (choice of two muesli bars, two cereal snack packs or one muesli bar and one cereal snack pack). Product consumption was evaluated for overall satisfaction, and positive and negative symptoms were observed using questionnaires at the completion of the study.
Table 1 Food serves for typical dietary study participant

tsp, tea spoon; tbsp, table spoon.
Products were tested for molecular weight, solubility, viscosity and both soluble and total β-glucan using methods described by Tosh et al. (Reference Tosh, Brummer and Wolever20). The amount of β-glucan in the control products was negligible ( < 0·2 g/serving). β-Glucan contents of the products, including soluble β-glucan are included in Table 2. The β-glucan in the RTE cereal and snack products had a higher solubility than the other products, with solubility improved by extrusion (porridges not extruded). The molecular weight of β-glucan extracted from all of the products showed only limited decreases due to effects of processing; highest where there was least processing (muesli bars and porridge) and lower in the extruded products (RTE cereal and cereal snack). The cereal and porridge samples with lower β-glucan contents (MBG samples) produced lower viscosity extracts (Table 2). The viscosity profiles of the HBG muesli bar and the HBG porridge had extracts with very similar viscosity profiles despite their differences in total β-glucan content. This is due to the greater solubility of the β-glucan in the muesli bar. The HBG RTE cereal had the greatest viscosity due to its high β-glucan and high solubility. All of the intervention products showed physico-chemical characteristics which would be expected to produce bioactivity. These products should have increased viscosity in the upper digestive tract which should modify the digestion and absorption rates of the nutrients.
Table 2 β-Glucan and total fibre content of study products (allowing for moisture and fruit content, calculated for serve size)
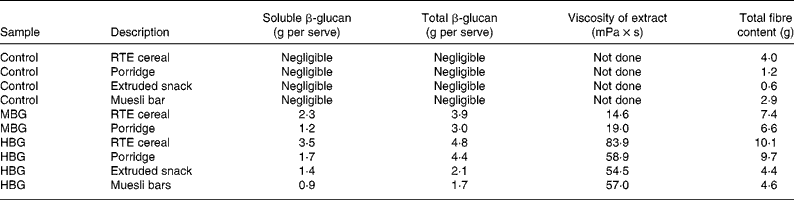
RTE, ready-to-eat; MBG, mid-dose β-glucan; HBG, high-dose β-glucan.
Clinical indices
Fasting blood samples at 0 and 3 months were collected using Sarstedt™ Monovette blood collection tubes. Glucose, insulin, total cholesterol, HDL, LDL and TAG analysis was performed at an accredited pathology laboratory (Southern IML Pathology, Wollongong, NSW, Australia). A further sample was collected into tubes containing potassium EDTA (to achieve a concentration of 0·5–2 mg EDTA/ml of blood after collection). Both the tubes contained dipeptidyl peptidase IV (Millipore, Billerica, MA, USA) to level of 10 μl/ml of blood. One tube also contained aprotinin equivalent to 0·6 trypsin inhibitor units per ml of blood (Aprotinin from bovine lung Sigma Aldrich A1153 dissolved in normal saline with 0·9 % benzyl alcohol) for analyses of CCK and PYY3-36. Together with the dipeptidyl peptidase IV inhibitor, the second tube contained 240 μl of complete protease inhibitor cocktail (Roche, Castle Hill, NSW, Australia) made to 25 × concentration in distilled water. Final concentrations met the recommendations for the manufacturers' protocols for assays described later. The blood samples were then centrifuged at 4°C for 15 min at 1500 g. The plasma was stored at − 80°C until further analysis could be completed.
Ghrelin, leptin, GLP-1 and total PYY were analysed using a Lincoplex™ Human Gut Hormone Panel (catalogue no. HGT-68K) according to manufacturer's instructions.
CCK analysis used Phoenix Peptides™ RIA (RK-069-04) for CCK octapeptide (CCK 26-33). The standard RIA protocol was applied but without extraction of the peptides before the assay. PYY3-36 analysis utilised a human specific RIA sourced from Linco (PYY-67HK) using the standard protocol.
Statistical analysis
Data for all anthropometry, blood analysis, VAS measurements and dietary intake were entered into SPSS for windows, version 15.0 (SPSS 15.0, Chicago, IL, USA). Repeated measures ANOVA (RMANOVA) using the general linear model with group (control, MBG and HBG) as the between-subjects factor, was used to identify primary changes in each parameter over time and also differences between the groups. Post hoc analysis using Bonferroni adjustments was reviewed to detect specific differences between the control and intervention groups. Log (base 10) transformations were also used as appropriate. Regression analysis was used to identify correlations between group anthropometric and biochemical indices. One-way ANOVA was used to review VAS and Baecke questionnaire results at various time points identifying any differences between the groups.
Results
Baseline data
Final numbers in each group were sixteen controls, twenty-one MBG and nineteen HBG (Fig. 1). There were two withdrawals from each of the MBG and HBG groups, but six were from the control group. Fifty-six subjects were included in the final data analysis. Some subjects did not complete all forms or blood was unable to be drawn for certain tests, so numbers in each calculation varied.
At baseline, there were no significant differences between group anthropometric and metabolic measures (Table 3). The subjects were overweight but overall they were not hyperlipidaemic (mean cholesterol 5·03 (sd 1·07) mmol/l). The only baseline biochemistry measure which showed significant differences between the groups was the fasting blood glucose level (P = 0·046), where the level for the HBG group was lower than that of the other two treatments (Table 3).
Table 3 Baseline characteristics of study subjects
(Mean values and standard deviations)
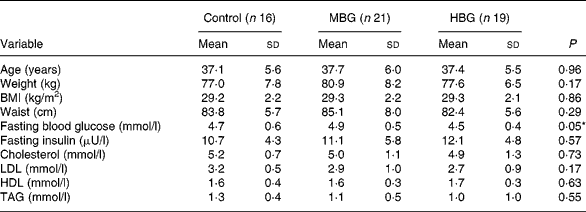
MBG, mid-dose β-glucan; HBG, high-dose β-glucan.
* Significant value was measured using ANOVA.
Review of food records and diet histories at baseline indicated relatively well-matched groups. No significant differences were noted between energy, fibre, protein, fat or carbohydrate overall (Table 4). The only significant difference at baseline was the amount of MUFA consumed (P = 0·025), where post hoc analysis using Bonferroni adjustments showed significantly less MUFA in the MBG group (24·8 (sd 9·8) g) compared with the control (32·5 (sd 8·0) g). The MUFA intake of the HBG group (28·8 (sd 6·8) g) was between these two levels.
Table 4 Reported energy and macronutrient intakes at baseline, mid-point and at 3 months, with P values for repeated-measures ANOVA between groups
(Mean values and standard deviations)
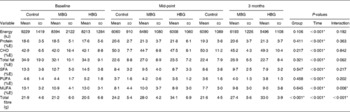
E, energy; CHO, carbohydrate.
* Significant values were measured using repeated-measures ANOVA.
Dietary intervention
Evaluation of the food records at mid-way through the study and at the end indicated little variation between the groups for macronutrient intakes at each time point with no significant differences between the groups. Review of the overall dietary composition of baseline diets compared with the mid-point of the study and the 3-month end-point showed a decrease in percentage energy from fat and an increase in the percentage energy from protein and carbohydrate (Table 4). General compliance with a weight reduction regimen was identified by overall weight loss (described later) and energy restriction detailed in the food records. Total energy intake was significantly lower at the mid-point (mean 6308 (sd 1068) kJ) of the trial and the end-point (mean 6000 (sd 1163) kJ) (P < 0·001) compared with the baseline (mean 8725 (sd 1703) kJ) using RMANOVA with fibre level as the between-group effect and time as the within-subject variant. There was no interaction effect over time (P = 0·192) indicating all the groups followed the energy-restricted diet to the same extent.
Dietary compliance with the study products measured by review of 3-d food records indicated that the use of breakfast cereal was very high (90 % consumed), while compliance with the snacks was reasonable (74 % consumed). Differences in dietary fibre intakes between the groups could be accounted for by the difference in fibre between the groups' product supply. This includes both soluble (β-glucan) and insoluble fibre from the products. The groups achieved a significant difference in the amounts of dietary fibre consumed at mid-point (P < 0·001, RMANOVA) and the last week of the study (P < 0·001, RMANOVA; Table 4). There was limited change in the control group, indicating that the products supplied to the subjects (which especially in the case of the cereal were relatively high fibre) replaced foods of similar fibre content.
The only dietary variation between the groups was the monounsaturated fats which varied at baseline also. The levels were not different at mid-point and at 3 months, but rather the change from baseline produced an interaction effect for time × group (Table 4). Therefore, all anthropometric and biochemical results were also checked for correlation with the monounsaturated fat levels.
There were no significant differences in activity scores between the groups at any time point, indicating that changes in physical activity were not a factor in influencing other results.
Clinical indices
Almost all anthropometric and biochemical indices changed over time, although there were no significant differences between the groups for any measured clinical parameter over time (Table 5). The average weight loss for the study sample of 4·1 kg was significant (P < 0·001; ranging from a 0·2 kg gain to a 14·9 kg loss). However, this is less than the anticipated 6–6·5 kg designed for the energy-restricted diet. It is also less than the change in kilojoule intake demonstrated in the food records would predict. The weight loss was not significantly different between the groups (P = 0·921). Waist measurements decreased significantly (P < 0·001).
Table 5 Changes in clinical indices overtime and between control, mid-dose β-glucan (MBG) and high-dose β-glucan (HBG) groups
(Mean values and standard deviations)
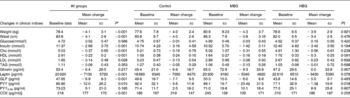
Cho, cholesterol; GLP, glucagon-like peptide; PYY, peptide YY; CCK, cholecystokinin.
* P values for ANOVA for change from 0 to 3 months.
† P values for repeated-measures ANOVA for changes between groups.
‡ P ≤ 0·05 when compared to control using Bonferroni adjustments. No significant difference existed between MBG and HBG.
§ Results for CCK were higher than usually measured. Peptides were not extracted before analysis and this may have affected absolute results, however, as this is a repeated-measures analysis, trends can still be detected if they exist.
Fasting blood glucose results did not decrease, however, fasting insulin decreased significantly compared with baseline (P < 0·001). However, no differences between the groups were identified (P = 0·184; Table 5). Log transformation of insulin data showed the difference from baseline to 3 months was still significant (P = 0·001) but not related to the intervention (P = 0·113).
Regression analysis indicated that weight loss significantly predicted waist change (P = 0·001), leptin (P = 0·007), blood glucose level (P = 0·031) and insulin (P = 0·052). However, the predictions, other than the expected waist change (R 2 0·480) were relatively weak (R 2 0·130, 0·084 and 0·069, respectively). Adjusting changes in these parameters for weight loss, failed to identify any significant differences between the groups.
Lipid results were examined overall, between the groups and also reviewing data for those subjects who had elevated lipids at baseline. The reduction in total cholesterol was not significantly different between the groups, with mean decreases of 0·19 (sd 0·79), 0·31 (sd 0·55) and 0·56 (sd 0·61) mmol/l for the control, MBG and HBG, respectively (P = 0·239). The general trend was as expected with the greatest decrease in cholesterol with the highest dose of β-glucan. Overall, there was a significant decrease in cholesterol over 3 months (P < 0·001).
For all the subjects, HDL levels significantly decreased over time (P < 0·001), LDL significantly decreased (P = 0·028) and TAG did not change (P = 0·353). Although the LDL results for RMANOVA did not show an overall effect between the groups, post hoc Bonferroni adjustments indicated a trend to differ between the control and high dose of β-glucan (P = 0·077) with the greatest decrease in LDL in the HBG group (Table 5). No significant (P < 0·05) differences were detected between the groups for the other lipid parameters.
Large standard deviations existed within all the datasets limiting the significance of results, especially hormonal changes. The decrease in leptin levels for the study sample was significant over time (P < 0·001) and regression analysis indicated the association with decreasing body weight (P = 0·007). Between the groups, the differences approached significance (P = 0·078) with the greatest decrease in leptin identified in the HBG group, even with the same body weight change.
Total PYY levels decreased significantly over time (RMANOVA, P = 0·015), and this was significantly different between the groups (P = 0·041). Post hoc Bonferroni adjustments indicated that the control group produced significantly different effects compared with both the MBG (P = 0·021) and HBG (P = 0·050) groups, where the smallest decrease in PYY was seen in the HBG group. The greatest change was in the MBG group so this would not seem related to dose of β-glucan. Even though levels of total PYY decreased in all the groups those for PYY3-36 increased, although the latter were not statistically significant (P = 0·195). PYY3-36 levels increased more with the inclusion of β-glucan in the diet (8–10 pg/ml increase compared with 2·5 pg/ml in the control), but this was not significant between the groups (P = 0·807).
There was a significant decrease in GLP-1 over time (P < 0·001) but no differences between the groups (P = 0·567). Ghrelin levels did not significantly alter over time (P = 0·217) and there were no between-group effects (P = 0·632). CCK results seemed elevated most likely due to a lack of extraction of peptides, however, as this was a repeated-measures analysis, results were included. CCK levels increased significantly over time (P < 0·001) but there was no group effect (P = 0·969) with all the groups increasing the CCK levels at equal rates.
All variables were reviewed adjusting for weight loss and monounsaturated fat, but other than the correlations described previously, no significant trends were noted. The large standard deviations indicated that individual fluctuations are more varied than any overall effect of increased β-glucan.
Subjective satiety
VAS results were reviewed for individual time points to compare any differences which may have existed between the control and test groups (ANOVA). No significant differences were identified between the groups at any time point tested – that is all individuals showed similar hunger/fullness at the same test points (data not shown).
Product evaluation
The majority of subjects in the intervention groups reported some negative physical symptoms from the products (52 % for MBG and 63 % for HBG), although this was less than the numbers experiencing positive symptoms (67 % for MBG and 85 % for HBG). Negative symptoms included abdominal pain and changes in bowel patterns (both increased and decreased stool frequency). Positive associations with the study products included ‘feeling more full, for longer’, ‘healthy snacking avoiding unhealthy snacking’, ‘less peaks and lows’ in intake, ‘more regular bowel movements’ and ‘increased energy’. The products were also evaluated from an organoleptic perspective using questionnaires with Likert scales. Overall, all the RTE cereal products received favourable evaluations. The porridges overall were disliked and were consumed at a minimal level.
Discussion
Within the context of the present study, regardless of the diet subjects were on, they lost weight, with the expected changes in waist circumference, fasting insulin(Reference Selwyn21), lipids(Reference St-Onge, Desmond and Hunter22) and leptin(Reference de Luis, Sagrado and Conde23). Even though weight loss was modest, the change of 5 % if maintained even at 3–4 % would most likely decrease the incidence of development of type 2 diabetes in this moderately overweight group, but at risk group(Reference Norris, Zhang and Avenell24). The waist circumference of the group as a whole decreased significantly and as a measure of abdominal adiposity indicated decreased risk of insulin resistance, glucose intolerance and dyslipidaemias(Reference Misra and Vikram25, Reference Despres, Lemieux and Prud'homme26). The fact that the subjects were only moderately overweight with limited progression towards metabolic syndrome, most likely limited the ability of the study to differentiate subtle differences that may have existed between the groups. Nevertheless, energy restriction alone remained effective for weight loss.
Much of the research with β-glucan as a functional ingredient focuses on improvements in parameters, such as glycaemic control and hypercholesterolaemia. The research here used healthy subjects whose ‘healthy overweight’ status ensured some elevated lipids but minimal insulin resistance. Greater effects may have been seen in a population with diabetes with greater metabolic dysfunction. Effects of β-glucan in a more overweight or obese sample with or without energy restriction cannot be inferred from the present study. The change in cholesterol, greatest for the HBG group may have been more exposed with more subjects, but this was a secondary outcome measure. Some literature on non-hypercholesterolaemic or mildly hypercholesterolaemic individuals tends to show limited response to β-glucan, so that the borderline significance of results would be expected, particularly given the observed weight loss. Greater than 10 % decrease in the HBG group together with evidence from other studies(Reference Saltzman, Das and Lichtenstein27) still provides support for oat β-glucan as a dietary intervention agent in the management of hypercholesterolaemia. The observed decrease in HDL levels was unexpected, but the reported consumption of saturated fats was notably higher than polyunsaturated fats (Table 4), so the background diet may not have been favourable.
With the modest weight loss demonstrated here, there were still significant changes in PYY and GLP-1. Additionally, there was an overall decrease in PYY while maintaining or perhaps increasing the fractions involved with satiety PYY3-36. It has been postulated that PYY has a role in the aetiology of human obesity due to negative correlation with BMI and the fact that injection of the active fraction of PYY, PYY3-36 decreases food intake in human subjects(Reference Batterham, Cohen and Ellis28). PYY is secreted in the same gut endocrine cells as GLP-1; both inhibit gastric emptying and promote satiety and are released in response to food. GLP-1 having an additional or additive role in its regulation of blood glucose via increasing insulin sensitivity(Reference Gutzwiller, Goke and Drewe29).
The observed relationship between changes in hormones and weight loss was perplexing. Nevertheless, recent research has shown that with a very large weight loss, as seen in surgical interventions for obesity, fasting levels of PYY increase but GLP-1 decreases, suggesting a less easily defined relationship between the two hormones and that they are not co-dependent(Reference Reinehr, Roth and Schernthaner30). Studies using hypoenergetic diets to induce weight loss have identified a decrease in GLP-1 response to dietary stimulus with weight loss(Reference Adam, Jocken and Westerterp-Plantenga31).
In clinical trials, fasting PYY and often PYY3-36 have been shown to be decreased in obesity. Roth identified decreased PYY3-36 in obese children, which increased with weight loss and showed that this increase was predictive of successful weight maintenance(Reference Roth, Enriori and Harz32). Pfluger et al. (Reference Pfluger, Kampe and Castaneda33) found no difference in fasting PYY3-36 between lean and obese subjects, however, identified a 30 % decrease in fasting total PYY when obese subjects lost approximately 5 % of their body weight. The results from the present study broadly mimic these results with an overall decrease in PYY, but an increase or at least maintenance in PYY3-36. Animal studies in our laboratory (unpublished results) have indicated an increase in PYY3-36 with increasing doses of β-glucan, and the trend in the present study warrants further investigation.
The group effect noted in fasting PYY, where both MBG and HBG results are different from the control, is difficult to interpret, given the smallest decrease was in the HBG and the largest decrease in the MBG. Other results which show similar trends (MBG a greater difference in one direction compared with the control or HBG such as with leptin) do not show significant correlations with the PYY results so it is difficult to infer a mechanism based on a U-shaped curve, where a certain dose would produce negative results but a greater dose would achieve desired outcomes. For example, in the present study no correlations existed with monounsaturated fat intake that was highest in the MBG group, so that the differences may just be statistical aberrations, in part created by the large variations in responses. Similarly, the larger change in leptin in the HBG group with the same weight loss seems positive, but the smallest change was with the MBG group and no dietary correlations exist.
We found a high overall acceptance of the high doses of fibre and good maintenance of the solubility, molecular weight and viscosity of the β-glucan after processing. No differences were identified with the subjective measures of satiety. The use of VAS is most likely to be accurate in a controlled situation such as in acute meal test studies in a laboratory situation(Reference Flint, Raben and Blundell18). So it is perhaps not surprising that small differences from month to month are unlikely to be quantified by the subjects using the scales.
Despite attention to product attributes that theoretically affect satiety and tight dietary controls, the present study failed to confirm direct effects of set levels of β-glucan on weight loss in an energy-restricted diet. Epidemiological evidence strongly suggests that high fibre diets have positive effects on weight control(Reference Howarth, Saltzman and Roberts34). Separating out the effects of a single fibre remain a difficult task within an human intervention trial, and it would seem the major outcomes in the present study are similar to another recent intervention trial with soluble fibre(Reference Salas-Salvado, Farre and Luque35) that also could not find an intervention effect with respect to weight loss. The lack of positive results such as these could certainly be used to support the notion that ‘fibre’ is not just an indigestible ingredient in a food but is a part of healthy diet that includes wholegrains, fruits and vegetables perpetuating good health. However, there are a number of confounding variables in the present study, which warrant consideration.
First the current trial was only of 3 months duration. Studies identifying positive effects of fibre, such as decreased weight gain usually last for a number of years(Reference Koh-Banerjee, Franz and Sampson4). A 3-month intervention may not be long enough to separate out the differences between the subjects' desire to comply and the actual effects of the dietary intervention. This difference is more likely to be obvious if the subjects were to follow a particular eating pattern over a longer timeframe. In a recent study, researchers have found that regardless of the dietary intervention, subjects who reported greater compliance with a weight loss regimen have lost a greater amount of weight(Reference Alhassan, Kim and Bersamin36). The authors conclude that strategies to increase adherence may be more important than dietary composition.
Second, the present study included products for the control group, which were still relatively high in fibre. Only the amounts of β-glucan varied within the diet. It seems likely that the effect of any one ingredient, even if positive, will be relatively small and hence showing a statistical difference between the groups will be difficult, especially over only 3 months. The numbers of subjects identified as necessary to detect a difference in the present study was based on the work of Solum(Reference Solum, Ryttig and Solum16), who used an energy-restricted diet with overweight women to determine the possible benefits of fibre supplementation. Control subjects used placebo tablets, while the intervention group had approximately 6 g of fibre sourced from grains and citrus fruit fibres. Over 12 weeks, the intervention group lost 1·8 kg more. The way the subjects consumed the fibre in the Solum study (capsules with water just before each meal) may have affected the outcomes. The overall greater weight loss of 6·7 and 8·5 kg for the control and intervention groups, respectively in this supplement study shows that adding food items to a dietary regimen (as in the currently reported study) may decrease weight loss to some degree. However, insisting subjects ate particular breakfast and afternoon tea items may have increased energy consumption at times when the subjects may have chosen to eat less in a non-directed environment.
Finally, it is difficult to control the intake of human subjects. Although food records and subjective discussions with the subjects indicated high compliance with consumption of study products overall, the subjects were less compliant with the energy restriction as evidenced by the modest weight loss. The greatest number of subjects withdrew from the control group, which could infer the greatest difficulty with compliance and a positive benefit of β-glucan, but this is unable to be confirmed within the constraints of the ethical requirements of the intervention trial.
In summary, although the groups experienced general improvement in measures such as fasting insulin and cholesterol, associated overall with weight loss, no effects seem specifically related to β-glucan dose. Most likely, some differences would have been realised if the study continued in the longer term, as generally, the subjects with higher fibre intakes will maintain weight more easily. However, within the timeframes of an intervention trial, and realistically, the time frames individuals may pursue a ‘weight loss diet’, there were no discernable differences between a regular energy-restricted diet and that which contained significant β-glucan.
Acknowledgements
The study was funded by an Australian Research Council Linkage Grant ID LP0561586 between the University of Wollongong and Cereal Partners Worldwide. There are no conflicts of interest to declare. The authors wish to acknowledge the assistance of Ms Serina Faraji, research dietitian, who assisted in the implementation of dietary protocols with study participants, and Mr Greg Teuss who assisted in the preparation and analysis of plasma samples. Analysis of physicochemical properties of study products took place at Agricultural and Agri-Food Canada with all remaining work performed at the University of Wollongong, NSW, Australia. All the authors made contributions to study design, interpretation of results and writing of the manuscript. E. J. B. assisted in development of the study protocols, implemented all aspects of the dietary intervention, analysed data and was responsible for the writing of the manuscript. L. C. T., M. J. B. and X.-F. H. designed the overall study protocols, assisted in data interpretation and contributed to the final manuscript. S. M. T assisted in study protocols in relation to intervention products and dose, performed analysis of intervention products and contributed to the writing of the final manuscript. All the authors read and approved the final manuscript.


