


Undernutrition is a global public health problem with approximately 217 million children classified as stunted, growth retardation due to chronic undernutrition or underweight( Reference Black, Victora and Walker 1 ). Stunting is of particular public health and scientific importance given the many studies that have shown a clear association between stunting and poor health in adulthood( Reference Martins, Toledo Florêncio and Grillo 2 – Reference Asao, Kao and Baptiste-Roberts 4 ). Mechanisms to explain these associations are limited in human studies, but there is evidence to suggest that perturbations to the endocrine system may play a role( Reference Asao, Kao and Baptiste-Roberts 4 , Reference Fernald and Grantham-McGregor 5 ). These potential mechanisms are plausible given that undernutrition is a major cause of stress( Reference Romero, Dickens and Cyr 6 ). As stress elicits a number of endocrine responses, it is of interest to determine whether recovery from undernutrition is associated with adaptations in the endocrine system( Reference Martins, Toledo Florêncio and Grillo 2 ) that may promote poor health later in life.
Previous studies on metabolic programming following undernutrition suggest that children who experience poor growth early in life due to inadequate energy and nutrient intake have an increased risk for becoming obese or developing chronic diseases, such as type 2 diabetes( Reference Florêncio, Ferreira and Cavalcante 3 , Reference Sesso, Barreto and Neves 7 , Reference González-Barranco, Ríos-Torres and Castillo-Martínez 8 ). In fact, studies from our group have found that stunting is not only associated with dietary changes that promote obesity but also metabolic adaptations that favour fat storage( Reference Martins, Hoffman and Fernandes 9 – Reference Grillo, Siqueira and Silva 11 ). A longitudinal study found that stunted children are more likely to deposit fat in the truncal region compared with normal height children( Reference Hoffman, Martins and Roberts 10 ), a major risk factor for type 2 diabetes and CVD. Yet, endocrine mechanisms to explain such findings are limited in human studies on growth-retarded children.
One potential explanation for the reported changes in body composition may be related to changes in cortisol metabolism as a result of exposure to undernutrition. For example, children with marasmus or kwashiorkor present high serum cortisol concentrations proportional to the degree of weight loss and/or disease progression( Reference Lunn, Whitehead and Hay 12 ). High cortisol concentration was also found in children and adults with low birth weights or prenatal undernutrition( Reference Clark, Hindmarsh and Shiell 13 – Reference Reynolds 15 ). These findings are highly relevant as it has been reported that children with severe undernutrition had decreased plasma concentrations of triiodothyronine (T3) and thyroxine (T4) and increased concentration of thyroid-stimulating hormone (TSH)( Reference Orbak, Akin and Varoğlu 16 , Reference Kumar, Nadkarni and Dwivedi 17 ). Increased TSH is associated with increased cortisol concentration that is reported to may promote central adiposity as a result of increased lipoprotein lipase of visceral adipose tissue( Reference Lee, Pramyothin and Karastergiou 18 ). In addition, decreased thyroid activity decreases energy expenditure( Reference McAninch and Bianco 19 ).
At the same time, it is important to consider other factors that may elicit endocrine changes relative to poor growth and diet, such as psychological stress, a common feature for children living in marginal conditions. For example, low cortisol concentrations have been reported in children with depression( Reference Cicchetti, Rogosch and Gunnar 20 ), victims of severe abuse( Reference Van der Vegt, van der Ende and Kirschbaum 21 ), children at risk for antisocial personality disorder( Reference Susman 22 ) and in institutionalised and neglected children( Reference Carlson and Earls 23 ). Simply, hypocortisolism resulting from stressful conditions( Reference Van der Vegt, van der Ende and Kirschbaum 21 , Reference Susman 22 ) may reflect a disruption in the hypothalamic–pituitary–adrenal (HPA) axis activity( Reference Miller, Chen and Zhou 24 , Reference Heim, Ehlert and Hellhammer 25 ). However, it is unclear how such alterations in the cortisol response influence health in the long term and highlight the need to determine whether such changes persist after a child has recovered from undernutrition.
The Centre for Nutritional Recovery and Education (CREN) uses a standard methodology for nutritional care of undernourished children that promotes the complete recovery of height and weight over a 2–3-year period. Given the complex socio-economic and familial situations of marginalised populations, the nutritional and medical care provided is multidisciplinary and comprehensive( Reference Alves Vieira, Ferraro and Nascimento Souza 26 ). Yet, the effectiveness of such treatment on physiological parameters central to undernutrition and health remains to be investigated. Therefore, the objective of this study was to determine whether children recovered from undernutrition experience persistent adaptations in endocrine functioning. This objective was achieved by testing the hypothesis that children recovered from undernutrition have lower thyroid status and impaired cortisol response to a cold pressor test compared with stunted, underweight and healthy children who had never been undernourished.
Methods
Treatment at the Centre for Nutritional Recovery and Education
CREN is a centre that offers outpatient assistance to children from 0 to 71 months of age with mild undernutrition and day hospital care for those exhibiting moderate to severe undernutrition. Dietary interventions are based on Brazilian natural staple foods (rice, beans, meat, fruits and vegetables) and do not use formulae (except for a short period of time or for specific intolerances). Assistance includes continuous health monitoring and intervention in cases of infections, parasites and anaemia( Reference das Neves, Martins and Sesso 27 , Reference Alves Vieira, Ferraro and Nascimento Souza 26 ). Paediatricians, nutritionists, social workers and psychologists participate in the treatment. Paediatricians monitor each child’s clinical status, laboratory results and anthropometric progress. Children’s diets are monitored and adjusted, if necessary, during the treatment period. Laboratory tests for blood and stool are performed at 6-month intervals. Children also receive prophylactic doses of Fe and vitamins A, B, C and D. The treatment is aimed to recover both weight and height, to achieve the best impact on long-term health( Reference Weisstaub and Araya 28 ) and to prevent obesity.
Subjects
Children enrolled in seven schools or youth centres (n 3369 children) located in low-income areas of the city of São Paulo were evaluated for anthropometric data and were invited to participate in the study. Children who met the inclusion criteria and agreed to participate in the study were included after parents signed the informed consent form (Fig. 1).

Fig. 1 Flowchart of the study design. CREN, Centre for Nutritional Recovery and Education.
Home visits were made to invite families of children who had recovered from undernutrition at CREN between 1999 and 2010 to participate in the study. Children who agreed to participate and met the inclusion criteria were included in the study. The average treatment time at CREN of children in this study was 38·60 (se 3·64, min 6 to max 85) months. At the beginning of the treatment at CREN the average height for age (HAZ) was −2·08 (se 0·20, min −5·28 to max 0·75) Zscore and weight for age (WAZ) was −1·95 (se 0·19, min −4·91 to max 0·13) Zscore and the average age was 21·02 (se 2·67, min 1·87 to max 63·80) months. The average increment of HAZ was 1·09 (se 0·14, min −0·05 to max 2·88) Zscore and WAZ was 0·95 (se 0·18, min −0·44 to max 4·54) Zscore. The study was performed after a mean discharge time of 61·82 (se 5·54) months.
This cross-sectional study was conducted with a selected sample of boys and girls (n 130) between 6 and 16 years of age who were assigned to one of the following groups: control (twenty-six female and fifteen male), stunted (five female and nineteen male), underweight (sixteen female and eleven male) and children who had recovered from undernutrition (eighteen female and thirteen male).
Stunting or chronic undernutrition was defined as of low HAZ, reflecting sustained and cumulative episodes of undernourishment and/or repeated infections( 29 ). Underweight refers to low WAZ. Therefore, the criteria for inclusion in the groups were based on anthropometric parameters assessed in schools and youth centres in low-income areas of the city of São Paulo. The parameters were as follows: the control group and recovered group had HAZ (metres for age) and BMI for age (BAZ, weights in kg/height2) Z-scores >−1·6 (>5th percentile( Reference Frisancho 30 )); the stunted group had HAZ≤−1·6 and BAZ>−1·6; and the underweight group had BAZ≤−1·6 and HAZ>−1·6.
All children underwent screening to ensure the absence of parasites, infections and anaemia. Children with positive results were treated before inclusion in the study. Mothers answered questionnaires about their family socio-economic status and their child’s health. Children who had CVD, renal, neurological or endocrine diseases and those using continuous medication or in treatment for any disease were not included. The identified undernourished children were referred for treatment at CREN after data collection was completed.
This study was approved by the Research Ethics Committee of the Federal University of São Paulo (CEP 1302/09) and all procedures were conducted in accordance with the principles of the Helsinki Declaration.
Anthropometry
The children were weighed in their underwear on a digital scale platform with a capacity of 150 kg and precision of 100 g (model SD-150; Country Technologies). Height was measured using a stadiometer (Alturexata) with a precision of 0·1 cm. Nutritional status, using HAZ and BAZ according to WHO standards, was determined using Anthro plus (version 1.0.4; WHO). A measuring tape with an accuracy of 1 mm was used to measure waist circumference (WC) and hip circumference (HC) with the children standing – keeping the abdomen relaxed – and the arms relaxed beside the body. For the WC, the measuring tape was placed at the midpoint between the last rib and the iliac crest, and the HC was measured over the greater trochanter. The waist:hip ratio was calculated as the ratio of the WC:HC.
Pubertal staging
Pubertal stages were assessed by a physician at CREN using Tanner’s criteria( Reference Tanner 31 ) and classified according to the cut-off values established by the World Health Organization( 32 ). Girls with breast stages ≥2 (M2) and boys with genital stages ≥3 (G3) were considered pubertal, whereas children whose breasts or genitals were below these levels were considered pre-pubertal.
Protocol
The families and children who agreed to participate in this study received saliva collecting devices (Salivette®; Sarstedt) with instructions describing the method of collecting saliva upon awakening (at 06.00 hours). They were instructed to not eat, drink or brush their teeth before saliva collection and to fast until blood collection at CREN. On the day of the protocol, the children were taken from their homes to CREN in the early morning. The tube with the first saliva sample collected at home was maintained on ice. A second saliva sample was collected (approximately 50 min after awaking) on the way from the child’s home to CREN. Upon arrival at CREN (approximately at 07.30 hours), a third sample of saliva was collected, and anthropometric measurements were performed. Although still fasting, the children were encouraged to remain seated and calm for blood collection, after which all children received breakfast. Finally, the fourth saliva sample was collected at 09.55 hours.
At 10.00 hours, the children underwent a cold pressor, unpleasant stimulus that consisted of immersing the right hand up to the forearm in cold water (2−5ºC) for 1 min, according to the methodology described by Flaa et al.( Reference Flaa, Sandvik and Kjeldsen 33 ). Saliva samples were collected at 10, 20 and 30 min after the stimulus. The children were then invited to eat an apple if they so desired. Before lunch, at 12.00 hours, the ninth saliva sample was collected. In the afternoon, the tenth saliva sample was collected at 13.55 hours, just before the pleasant stimulus that consist to watching a video with pictures of nature for 5 min. Saliva samples were collected 10, 20 and 30 min after watching the video. After this test, a snack consisting of orange juice and bread was offered to the children. The last saliva sample was collected at 16.00 hours, and the children were then taken back to their homes. All meals were ad libitum and offered at least 30 min before the next saliva sample, as suggested by Hanrahan et al.( Reference Hanrahan, McCarthy and Kleiber 34 ). Before any sampling, the children washed their mouths with water. Saliva samples were stored at −20ºC until assayed.
Salivary cortisol assay
Immediately before the analysis, the samples were thawed and the cortisol concentration was determined using an enzyme immunoassay commercial kit (Salimetrics) and a SpectraMax (M5 reader; Molecular Devices) at 450 nm. The intra-assay accuracy of the method was assessed on the basis of the control samples that were included in each assay and the inter- and intra-assay CV were 5·7 and 5·2 %, respectively. The minimal concentration of cortisol detection was 0·193 nmol/l (0·007 µg/dl).
Fasting serum adrenocorticotropic hormone and thyroid hormone
The serum concentration of adrenocorticotropic hormone (ACTH) was analysed using an ELISA with a commercially available Multiplex kit (Code HPTP1 MAG-66K; Millipore Corporation). The intra-assay accuracy of the method was assessed based on the control samples that were included in each assay. The inter- and intra-assay CV were <15·0 and <10·0 %, respectively. The minimal concentration of ACTH detection was 0·20 pmol/l. The samples and standards were processed by employing the Luminex 200 (Luminex Corporation) instrument platform and the related MagPix Analyzer with xPONENT/Analist software (Luminex Corporation). The serum concentrations of TSH and free T4 and T3 were detected by chemiluminescence using Immulite 1000 (Siemens), and the intra- and inter-assay CV were 3·0 and 7·2, 2·0 and 4·8, and 2·0 and 3·4 %, respectively. The minimal concentrations to detect TSH, free T4 and T3 were 0·004 mIU/l, 1·67 and 1·54 pmol/l, respectively (values not log transformed).
Statistical analyses
Anthropometric data and thyroid hormones were analysed by two-way ANOVA (group and sex). Socio-economic data were analysed using ANOVA followed by a Tukey’s test. The pubertal stage proportion in the groups was analysed using a χ 2 test. Correlations between log Naperian of the thyroid hormones, cortisol and ACTH were evaluated using Pearson’s correlations. The serum concentrations of TSH, ACTH and free T3 and T4, as well as salivary cortisol were log transformed and are presented as geometric means and 95 % CI.
The AUC for the total variation of cortisol concentration throughout the day was calculated using the cortisol concentration in the saliva samples collected at 06.00, 07.30; 09.55, 10.15, 10.25, 10.35, 12.00, 13.55, 14.15, 14.25, 14.35 and 16.00 hours (AUCtotal). The AUC for the circadian rhythm was calculated using the cortisol concentration in the saliva samples collected at 06.00, 07.30, 12.00 and 16.00 hours (AUCCircadian rhythm). The AUC for the analysis of the effects of unpleasant and pleasant stimuli was calculated using the cortisol concentrations in saliva samples collected before and 10, 20 and 30 min after the stimuli. Groups were compared using mixed between–within-subject two-way ANCOVA with correction for age.
A power calculation with salivary cortisol concentrations as the primary outcome was performed using Gpower 3.1.9 (University of Kiel). It was determined that a sample size of 130 subjects would provide a power of >40 % for the F tests using ANCOVA and >90 % (power analysis post hoc) for the repeated measures including thirteen measurements. On the basis of these calculations, the total sample recruited was statistically adequate for the hypotheses presented and the analyses conducted. All statistical analyses were performed using SPSS 20.0 (IBM Corporation) and differences between groups were considered statistically significant when P<0·05.
Results
Socio-economic data and anthropometric characteristics
Socio-economic characteristics for the children studied are summarised in Table 1. The per capita income was higher in the control group compared with the other three groups. Mothers’ formal education was lower in the underweight and recovered groups. Families of the recovered children showed a higher number of persons per dwelling in comparison with the control group. All families had similar housing conditions and access to water and sewage systems (data not shown).
Table 1 Socio-economic characteristics of the studied groupsFootnote * (Mean values and standard deviations)
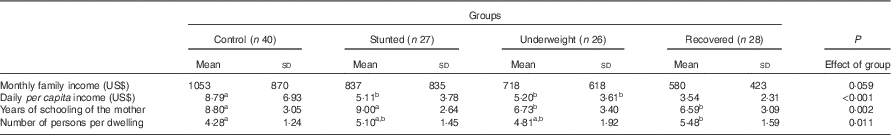
a,b Mean values within a row with unlike superscript letters were significantly different (Tukey’s post hoc, P<0·05).
* One-way ANOVA (group): monthly family income (US$), F 3,117=2·55; daily per capita income (US$), F 3,117=7·44; years of schooling of the mother, F 3,117=5·29; number of persons per dwelling, F 3,122=3·90.
As shown in Table 2, children in the control, underweight and recovered groups present similar ages and were younger than those in the stunted group. HAZ was similar to the control, underweight and recovered groups, but higher than that of the stunted group. The underweight group had a significantly lower BAZ and WC compared with the other three groups. Waist:hip ratios were similar in all four groups, although it was significantly higher in the boys (mean 0·83 (se 0·01)) compared with the girls (mean 0·80 (se 0·01)). The control group had 43·9 % of children in puberty, whereas the stunted had 32 %, the underweight had 42·9 % and the recovered had 35·5 % of their group in puberty. The proportion of pre-pubertal and pubertal individuals in the four groups was similar (χ 2 test=1·22; P=0·748).
Table 2 Anthropometric characteristics and thyroid status of the studied groupsFootnote * (Mean values with their standard errors; geometric means and 95 % confidence intervals)

G, girls; B, boys; T3, triiodothyronine; T4, thyroxine; TSH, thyroid-stimulating hormone.
a,b,c Mean values within a row with unlike superscript letters were significantly different (Tukey’s post hoc, P<0·05).
* Two-way ANOVA (group and sex); there was no significant interaction between group and sex.
Serum thyroid hormones
No differences were observed in the concentrations of TSH and free T3 between groups and sexes (Table 2). The concentrations of free T4 in the stunted and the recovered group were significantly lower, compared with that in the control group. The free T4 concentration of the underweight group did not differ from that of the stunted group.
Adrenocorticotropic hormone and salivary cortisol
The concentration of salivary cortisol during the day as well as the fasting concentration of serum ACTH is summarised in Table 3. The serum concentrations of ACTH were not different between groups. The post-test analysis showed that salivary cortisol on awakening was significantly higher for stunted children compared with the underweight and recovered groups; however, it did not differ from the control group. At that time, underweight children had significantly lower values compared with the controls. In the samples collected at 16.00 hours, salivary cortisol was significantly higher in the stunted and in the underweight groups compared with the recovered group.
Table 3 Salivary cortisol concentration (nmol/l) throughout the day and fasting serum adrenocorticotropic hormone (ACTH) (pmol/l)Footnote * (Geometric mean values and 95 % confidence intervals)

G, girls; B, boys; CREN, Centre for Nutritional Recovery and Education.
a,b,c Mean values within a row with unlike superscript letters were significantly different (least significant difference, P<0·05).
* Two-way ANCOVA (group and sex) adjusted for age. The interaction between group and sex was significant at 16.00 hours (group (F 3,120=4·06), sex (F 1,120=0·03), interaction (F 3,120=4·88; P =0·003)).
Sex differences were also observed, with higher concentrations of salivary cortisol upon awakening in girls (two-way ANCOVA: 5·15 (95 % CI 3·86, 6·96) nmol/l) compared with boys (3·29 (95 % CI 2·59, 4·22) nmol/l; P=0·021). There was a significant interaction between sex and group at 16.00 hours (two-way ANCOVA: P=0·003), and girls of the stunted group showed significantly higher concentrations of salivary cortisol compared with boys, whereas girls of the underweight group showed significantly lower concentrations of this hormone in relation to boys (Fig. 2). The AUC of cortisol did not differ between groups and sexes.

Fig. 2 Interaction between group and sex for salivary cortisol at 16.00 hours. Stunted girls (![]() ) and underweight boys (
) and underweight boys (![]() ) showed higher salivary cortisol concentrations in comparison with stunted boys and underweight girls. For details of the two-way ANCOVA analysis, please see Table 3. ** Mean value was significantly different from that of the recovered group (P<0·01).
) showed higher salivary cortisol concentrations in comparison with stunted boys and underweight girls. For details of the two-way ANCOVA analysis, please see Table 3. ** Mean value was significantly different from that of the recovered group (P<0·01).
Salivary cortisol concentrations were similar in all groups before the application of the stimulus and increased after the unpleasant stimulus in the control, stunted and underweight groups but not in the recovered group (Fig. 3(a)).

Fig. 3 Mixed between–within-subject ANOVA at unpleasant and pleasant stimuli. (a) Response to unpleasant stimulus. Interaction between time, sex and group, Wilks’ λ=0·92, F
9,289=1·16, P=0·317; main effect for time, Wilks’ λ=0·96, F
3,119=1·40, P=0·246; group factor: F
3,121=3·29, P=0·023; sex factor: F
1,121=0·65, P=0·421; interaction factor F
3,121=0·94, P=0·425. (b) Response to pleasant stimulus. Interaction between time, sex and group, Wilks’ λ=0·94, F
9,280=0·73, P=0·676; main effect for time, Wilks’ λ=0·93, F
3,115=2·88, P=0·039; group factor: F
3,117=0·54, P=0·652; sex factor: F
1,117=0·01, P=0·912; interaction factor F
3,117=3·17, P=0·027. ![]() , Control;
, Control; ![]() , stunted;
, stunted; ![]() , underweight;
, underweight; ![]() , recovered.
, recovered.
No differences were found between groups in terms of response to the pleasant stimulus (Fig. 3(b)); however, the undernourished groups showed an increase of salivary cortisol after the pleasant stimulus in comparison with the recovered and control groups (overtime difference, P=0·039). The interaction between group and sex was significant (P=0·027) where stunted girls had higher cortisol compared with the stunted boys, and underweight boys had higher cortisol compared with underweight girls.
A multivariate two-way ANCOVA mixed between–within-subjects using all samples except that obtained 50 min after awakening is presented in Fig. 4. There was a significant difference in salivary cortisol throughout the day with highest concentrations in the early morning and a decrease as the day progressed. A marginal difference between nutritional groups was found (P=0·084).

Fig. 4 Mixed between–within-subject ANOVA to salivary cortisol concentration throughout the day (nmol/l). Interaction between time, sex and group, Wilks’ λ=0·70, F
33,304=1·16, P=0·257; main effect for time, Wilks’ λ=0·62, F
11,103=5·67, P<0·001; group factor: F
3,113=2·27, P=0·084; sex factor: F
1,113=0·92, P=0·338; interaction factor F
3,113=2·00, P=0·118. ![]() , Control;
, Control; ![]() , stunted;
, stunted; ![]() , underweight;
, underweight; ![]() , recovered.
, recovered.
The circadian rhythm calculated without the unpleasant and pleasant stimulus showed a significant decrease in cortisol over the time (P<0·001). The recovered group showed lower values when compared with other groups (recovered, 3·20 (95 % CI 2·81, 3·64) nmol/l; stunted 4·34 (95 % CI 3·60, 5·25) nmol/l; underweight 3·44 (95 % CI 3·01, 3·93) nmol/l; control 3·98 (95 % CI 3·55, 4·47) nmol/l; P<0·05). Regarding sex, girls had higher salivary cortisol compared with boys (4·02 (95 % CI 3·61, 4·49) and 3·43 (95 % CI 3·13, 3·76) nmol/l, respectively; P=0·029).
For all children, positive correlations between ACTH and T3 (Pearson’s r 0·225; P=0·019) and between ACTH and T4 (Pearson’s r 0·307; P=0·001) were observed. In addition, there are correlations among thyroid hormones, cortisol and ACTH within the groups. In the control group, positive correlations between ACTH and T3 (Pearson’s r 0·592; P<0·001) and T4 (Pearson’s r 0·459; P<0·001) were found. In addition, positive correlations between T3 and awakening cortisol (Pearson’s r 0·342; P=0·036), 50 min after awakening (Pearson’s r 0·331; P<0·042) and after arrival at CREN (Pearson’s r 0·407; P<0·010), were found. Only in the control group T3 was positively correlated with T4 (Pearson’s r 0·421; P=0·008) and TSH (Pearson’s r 0·342; P=0·036). In the underweight group, a positive correlation between ACTH and T4 was found (Pearson’s r 0·510; P=0·013). No correlation was found between ACTH and T3 or between T4 and TSH in the stunted and recovered groups.
Discussion
In Brazil, it is estimated that among children 5–9 years of age, 7 % are stunted and 4 % are underweight, although the prevalence of underweight for adolescents is 3·4 % with similar values in the city of São Paulo( Reference Perez, de Oliveira and de Moraes 35 ). Undernutrition has both immediate and long-term negative health and social outcomes( Reference Martins, Toledo Florêncio and Grillo 2 ) and is also associated with glucocorticoid changes that may increase the risk for chronic diseases in adulthood( Reference Clark, Hindmarsh and Shiell 13 – Reference Reynolds 15 ). Although we have previously shown that proper treatment of undernutrition (recovery in height and weight) may normalise a series of physiological parameters associated with poor health( Reference das Neves, Martins and Sesso 27 , Reference Martins, Martins and Neves 36 , Reference Martins, Neves and Franco 37 ), it is unclear whether recovery normalises thyroid and cortisol status. Therefore, it was of interest to determine differences in stress response and thyroid state in children recovered from undernutrition compared with stunted, underweight and well-nourished children. Briefly, the recovered group showed similar cortisol response to a passive stress compared with controls, and the underweight children had a borderline significantly greater response compared with the other three groups. In addition, the concentration of free T4 was lowest in the recovered children compared with the control group.
Undernutrition has been reported to cause a number of significant changes in endocrine processes( Reference Lunn, Whitehead and Hay 12 , Reference Waterlow 38 ). Energy conservation mechanisms demand decreases in hormones that stimulate energy expenditure, such as thyroid hormones( Reference McAninch and Bianco 19 ). It is classically known that decreased thyroid hormones are found in severe undernutrition( Reference Weaver 39 ). Moreover, it has been suggested that high cortisol concentrations mediate the relationship between environmental stress early in life and poor health in adult life through epigenetic changes in HPA-specific genes( Reference Weaver 39 ). However, there are no studies, to our knowledge, that document normalisation of cortisol status following recovery from undernutrition – one of the aims of this study.
With regard to basal cortisol metabolism, waking cortisol concentrations are representative of the basal hormonal condition as it is not influenced by external stressors experienced during the day( Reference Matsuda, Yamaguchi and Okada 40 ) and maintains plasma glucose during nocturnal fasting. In addition, low cortisol concentrations in the morning have been associated with low energy availability as a tentative mechanism of energy and protein conservation( Reference Winnick, Ramnanan and Saraswathi 41 ). We found that the recovered group had waking cortisol concentrations similar to both underweight and control groups but lower than that of the stunted group. One of the most important factors during the nutritional recovery process is the activation of energy conservation mechanisms associated with an increase in anabolic processes. As cortisol plays an important role in glucose and protein metabolism, a decrease in this hormone could be clearly advantageous to anabolism, especially in terms of protein anabolism.
The use of a cold pressor test, immersing the right hand up to forearm in cold water( Reference Schwabe, Haddad and Schachinger 42 ), is a valid test for evoking a systemic activation of the sympathetic nervous system that induces a cortisol response in healthy subjects( Reference van Stegeren, Wolf and Kindt 43 ). This test was chosen to avoid potential impaired school abilities that could interfere in tests involving arithmetic calculations or public speaking. The results from our analyses showed that both stunted and undernourished children had a greater stress response compared with the control and recovered groups. Thus, it is plausible that children who are recovered from undernutrition, on the basis of the comparison of the recovered group with control and currently underweight children, do not present with altered HPA axis as is apparent in the underweight and stunted groups. Whether or not the difference between the recovered and currently undernourished children is a permanent normalisation of the HPA axis is difficult to determine as a longitudinal study of stress response on the same children would have to be conducted. Yet, these are perhaps the only data available that compare stress response in children treated and recovered from undernutrition compared with children before treatment.
Epidemiological studies have reported that women born with low birth weight and length and also experience poor growth during childhood have subclinical hypothyroidism as adults( Reference Kajantie, Phillips and Osmond 44 ). It has been recently reported that adult rats born to mothers who were energy restricted from mating until weaning and then allowed to feed ad libitum had lower free T4, increased TSH and normal free T3 compared with control rats( Reference Ayala-Moreno, Racotta and Anguiano 45 ). In the present study, we found that the serum concentrations of TSH, free T3 and ACTH did not differ between control children, children with low weight, stunted children and children who recovered from undernutrition after being treated at CREN. However, lower concentrations of free T4 were found in recovered and stunted children compared with well-nourished children. Activation of the HPA is associated with inhibition of the hypothalamus–pituitary–thyroid axis( Reference Joseph-Bravo, Jaimes-Hoy and Charli 46 ) and lower activity of 5’-deiodinase that regulates peripheral conversion of T4 to T3( Reference Slone-Wilcoxon and Redei 47 ). In the same trend, overweight/obese Brazilian women (but not men) with short stature showed lower T3 concentrations than did overweight/obese normal statured women( Reference Sawaya, Martins and Baccin Martins 48 ). Thus, it is clear that hypothalamus–pituitary–thyroid axis may be programmed during undernutrition to decrease energy expenditure. In addition, it may explain – at least in part – the higher susceptibility to the development of obesity, shown in a longitudinal study among stunted girls( Reference Martins, Hoffman and Fernandes 9 ), and the high correlations between leptin and BMI and between abdominal fat and insulin sensitivity previously described in nutritionally recovered girls from CREN( Reference Martins, Neves and Franco 37 ).
As with any study on humans, there are a number of limitations that should be discussed for a clearer understanding of the context in which the results are interpreted. First, the use of a cross-sectional design limits our ability to make solid conclusions about the degree to which differences in the recovered and control groups are due to the normalisation of the cortisol system. In addition, our sample of stunted females was relatively small. Considering that this is an area of extreme interest given the importance of the HPA axis and the thyroid hormones during pregnancy, a study with bigger sample size of female subjects could confirm the data presented here and add more information to this growing field of knowledge. Second, all data collection was carried out in a single long day and possibly introduces a new variable to an already stressful protocol. However, all groups were subjected to the same procedures, and the presence of the control group who lived in the same socio-economic conditions allowed for the comparisons between the groups. In fact, using an alternative protocol with more than one test day could be even more stressful for children as it would imply more days with altered routines. Furthermore, as previous studies have shown that changes in salivary cortisol concentrations are better detected after stimulation( Reference Fernald and Grantham-McGregor 5 , Reference Martikainen, Pesonen and Lahti 49 ), our research protocol was designed to detect post-stimulation changes rather than differences over several days. Third, regarding potential familiarity with the research setting as a stress modifier, it is unlikely that the low concentrations of cortisol found in the recovered group reflected familiarity with CREN staff, the study setting or sampling techniques for a number of reasons. The recovered children were very young when they were treated at CREN, and the protocol was performed after 5 years following their discharge. Therefore, it is improbable that they have maintained a significant memory of CREN’s environment. Moreover, the researchers are not member of the staff at CREN and had never met any of the children who participated in this study. Also, the control group was selected among children of the same socio-economic stratum of the other groups to avoid the influence of the uncontrolled variables, social class and environment. This is important to mention because people from low socio-economic status tend to present with high concentrations of cortisol and poorer health( Reference Garcia, de Souza and Bella 50 ). Fourth, with respect to the control children, all had weight and height within the normal range according to the standards of the WHO; it is very unlikely that these children were undernourished early in life and fully recovered without receiving any medical treatment. Although these limitations prevent us from making broader conclusions about the results presented, they do not invalidate the results obtained.
In conclusion, the low cortisol response of the recovered group in comparison with that of the undernourished groups and similar to that of the control group suggests a normal functioning of the HPA axis. However, longitudinal studies are necessary to complement this observation and to ensure that this return to normality is permanent. Whether this normal stress response will remain in adulthood or some deleterious programming, not identified by the present protocol, has occurred in the HPA axis is still undetermined. The lowest concentration of free T4 observed in recovered children, however, indicates a programming effect that may lead to future accumulation of body fat, and this justifies the maintenance of a continuous observation of anthropometric and clinical indicators as well as encouragement for healthy lifestyles for these children. Therefore, to best determine the full physiological impact of and extent of potential endocrine programming by undernutrition, longitudinal studies are warranted.
Acknowledgements
This research was supported by Fundação de Amparo à Pesquisa do Estado de São Paulo (FAPESP), Brazil), grant number 2010/51237-2. V. J. B. M. was supported by Coordenação de Aperfeiçoamento de Pessoal de Nível Superior (CAPES), and A. L. S. was supported by the Conselho Nacional de Desenvolvimento Científico e Tecnológico (CNPq) fellowship number 302740/2010-4. FAPESP, CAPES and CNPq had no role in the design, analysis or writing of this article.
The authors’ contributions are as follows: V. J. B. M., R. C. S. and A. L. S. designed the study. V. J. B. M., A. P. O. N., M. C. G. and M. P. d. A. performed all data collection. V. J. B. M. and A. L. S. completed all statistical analyses, interpreted the data and wrote the paper. A. P. G. C. contributed to the statistical analyses and revision of the paper. D. J. H. contributed to writing and revision of the paper. All authors were responsible for the critical revisions of the paper and approval of the final version.
The authors declare that there are no conflicts of interest in this paper.


