


Identification of modifiable lifestyle risk factors has become a pressing challenge given the rapidly increasing global prevalence of type 2 diabetes mellitus (T2DM)(Reference Esposito, Maiorino and Chiodini1,2) . Previous research has established strong links between specific nutrients, foods and food groups with T2DM and its underlying abnormalities (Reference Ley, Hamdy and Mohan3,Reference Wu, Ding and Tanaka4) . For example, avoiding the consumption of excessive amounts of refined grains, sugar-sweetened beverages, red and processed meat and alcohol while emphasising whole-grain cereals, vegetables, dairy, legumes and nuts can alter body weight, improve insulin resistance and contribute to T2DM prevention(Reference Wu, Ding and Tanaka4). However, research approaches that focus on individual foods and nutrients may be limited by not considering metabolic alterations that may occur in response to the complex food, nutrient and food matrix interactions that are characteristic of the consumption of mixed meals. In addition, physiologic effects of untested or unknown nutrients that may contribute to a diet–disease relationship are omitted in the study of individual dietary components(Reference Sacks, Obarzanek and Windhauser5). By analysing dietary patterns as opposed to single nutrients or foods, a more comprehensive nutritional profile is captured, which may be more indicative of disease risk(Reference Sacks, Obarzanek and Windhauser5).
The Dietary Approaches to Stop Hypertension (DASH) diet, designed initially as a hypertension intervention, has been suggested to have broader benefits, including reducing the risk of CVD(Reference Sacks, Obarzanek and Windhauser5–Reference Siervo, Lara and Chowdhury7). The diet’s high content of fibre, antioxidants, unsaturated fatty acids and low-fat dairy may also ameliorate insulin resistance and hyperglycaemia(Reference Shirani, Salehi-Abargouei and Azadbakht8). A meta-analysis of six large prospective studies established an inverse association between adherence to a DASH-like diet and risk of T2DM incidence (overall risk ratio: 0·81 (95 % CI 0·72, 0·92))(Reference Jannasch, Kroger and Schulze9). However, underlying mechanisms involved in the connection between DASH adherence and diabetes risk are not fully understood. Novel approaches to understanding metabolic variations in response to DASH diet adherence would increase our comprehension of its link with T2DM.
Metabolomics, a set of technologies used to comprehensively characterise a wide range of molecules present within a biological sample, can be particularly informative in the context of T2DM aetiology because the condition is characterised by an extended period of progressive declines in insulin sensitivity and/or insulin secretion before the clinical onset of overt disease(Reference Ilkayeva, Wenner and Newgard10). Metabolomics can be similarly informative in identifying metabolite profiles characterising adherence to different dietary patterns(Reference Zheng, Clausen and Dalsgaard11,Reference Wang, Toledo and Hruby12) . However, to date information regarding the metabolomic signature of DASH adherence is sparse as, to our knowledge, only a limited number of previous studies have determined metabolite profiles associated with adherence to this dietary pattern in human subjects(Reference Rebholz, Lichtenstein and Zheng13–Reference Walker, Song and Xu16).
Thus, there is currently an important knowledge gap regarding the metabolomic profile of DASH diet adherence in free-living, multiethnic and disease-free populations. Additionally, the potential association between metabolite profiles arising from DASH adherence with incident T2DM is currently unknown. Therefore, additional studies evaluating these questions are needed. We hypothesise that unique metabolite signatures associated with DASH adherence will provide insight into the mechanisms through which this diet pattern reduces the risk of T2DM.
Materials and methods
The Insulin Resistance Atherosclerosis Study
Insulin Resistance Atherosclerosis Study (IRAS) was established to prospectively study the associations between insulin resistance, CVD risk factors and behaviours in a large multiethnic cohort in the USA. IRAS enrolled 1625 men and women ranging from 40 to 69 years of age between 1992 and 1994(Reference Wagenknecht, Mayer and Rewers17). The final sample recruited had a distribution of 38 % non-Hispanic white (n 613), 34 % Hispanic (n 548) and 28 % African-American (n 464)(Reference Wagenknecht, Mayer and Rewers17). About 56 % of participants were women, and the distribution of glucose tolerance was 44 % normal glucose tolerance, 23 % impaired glucose tolerance and 33 % T2DM (but not taking insulin)(Reference Wagenknecht, Mayer and Rewers17).
Baseline measurements were completed during two separate examinations of 4 h each separated by approximately 1 week. Participants were asked to fast for 12 h, to abstain from alcohol or heavy exercise for 24 h and to abstain from smoking the morning before the examinations. During the first visit, an oral glucose tolerance test was administered in compliance with the WHO criteria(18). On the second visit, insulin sensitivity and β-cell function were assessed by the frequently sampled intravenous glucose tolerance test(Reference Wagenknecht, Mayer and Rewers17). Glucose and insulin values from the frequently sampled intravenous glucose tolerance test were used to calculate insulin sensitivity (SI) and acute insulin response using the MINMOD program(Reference Wagenknecht, Mayer and Rewers17). The disposition index (DI), a measure of β-cell function accounting for background insulin sensitivity, was calculated as the product of acute insulin response and SI (Reference Færch, Brøns and Alibegovic19).
Ethnicity was determined by self-report(Reference Wagenknecht, Mayer and Rewers17). Nutrient intake was assessed at the baseline examination using a semi-quantitative 114-item FFQ modified from the National Cancer Institute Health Habits and History Questionnaire to include regional and ethnic food choices(Reference Wagenknecht, Mayer and Rewers17). These additional foods were selected based on existing data from the four IRAS clinical centres and the experience of nutritionists in the respective localities(Reference Mayer-Davis, Vitolins and Carmichael20). Food intakes were measured using nine frequency-type responses ranging from ‘never or less than once/month’ up to ‘2 or more times/d’. For beverages, frequency type responses ranged from ‘never or less than once/month’ to ‘6 or more times/d’. Responses were used in conjunction with portion size questions such as ‘small, medium or large, compared with other men/women about your age’. Nutrient intake was then calculated using the DIETSYS database for age- and sex-specific portion sizes. Finally, the dose and frequency of nutritional supplements were reported if intake was at least once/week or greater(Reference Mayer-Davis, Vitolins and Carmichael20). The FFQ was validated against average intake estimates from eight 24-h dietary recalls collected over a 1-year period in a sample of 186 women who were part of the IRAS cohort(Reference Mayer-Davis, Vitolins and Carmichael20).
Follow-up examinations occurred on average 5·2 years later, between 1998 and 1999(Reference Hanley, Karter and Williams21). In total, 1313 participants (80·1 %) of the original cohort of 1625 IRAS participants were included for examinations at follow-up(Reference Hanley, Karter and Williams21). For the current study, those with known T2DM at baseline (n 537) and those who did not return for a 5-year follow-up (n 347) were excluded from analyses (online Supplementary Fig. 1)(Reference Lee, Watkins and Lorenzo22).
Dietary approaches to stop hypertension diet adherence scoring
For the current study, an index developed by Günther et al. (2008) was used to assess DASH diet adherence(Reference Günther, Liese and Bell23). This index provides improvements over other existing indices by adjusting intake thresholds based on energy intake(Reference Miller, Cross and Subar24). Previous literature has utilised Günther’s index in both cross-sectional and prospective studies to evaluate the association of DASH diet adherence with T2DM(Reference Liese, Bortsov and Günther25–Reference Barnes, Crandell and Bell28). This includes a study evaluating this association within the IRAS cohort, where the highest DASH adherence tertile compared with the lowest tertile of DASH adherence was inversely associated with T2DM in the non-Hispanic white ethnic group (OR: 0·31 (95 % CI 0·13, 0·75))(Reference Liese, Nichols and Sun26). Participants were scored a priori through Günther’s eighty-point index for absolute intakes of ten DASH food groups. Günther’s scoring index was adjusted for energy intake with thresholds for absolute intake calculated using guidelines from the National Heart, Lung, and Blood Institute and formulas for lower and upper thresholds of each energetic bracket, using the approach described in Günther et al. (2008)(Reference Günther, Liese and Bell23,29) . The scoring methodology and dietary components included are described in Supplementary Table 1.
FFQ questions included in the calculation of average food group servings were determined by SY and AD. For the whole grains food group, FFQ items were selected based on Masters et al. (2010)(Reference Masters, Liese and Haffner30). FFQ items and multiplication factors for FFQ items are detailed in Supplementary Table 2.
Metabolite measurements
Blood samples were collected for metabolite analysis at the same visit as the dietary assessments. The TrueMass® analysis platform was employed for quantitative measurements of ninety-two metabolites in plasma(31–35). Acylcarnitines, amino-acids, bile acids and sterols were analysed using mass spectrometry(31–Reference Balducci, Sacchetti and Haxhi37). Plasma was initially mixed with deuterium-labelled internal standards(31–35). Depending on the class of metabolite, the mixture was then injected onto a specific column. Acylcarnitines were injected onto an Atlantis HILIC Column connected to a Waters Xevo triple quadrupole mass spectrometer(34). Sterols and amino acids were injected onto a 6890/5975 GC/MS (Agilent Technologies, CA) with a DB-5MS UI column (Agilent Technologies, CA) and 7890/5975 GC/MS (Agilent Technologies, CA) with a ZB-50 column (Phenomenex, CA), respectively, both with helium as the carrier gas(31,33) . Samples of bile acids were injected onto an Agilent Stable Bond C18 reverse phase column connected to an Applied Biosystems 4000 QTRAP(32). Fatty acids were separated and quantified by capillary gas chromatography (Agilent Technologies model 6890) equipped with a 30 m HP-88 capillary column (Agilent Technologies) and a flame-ionisation detector(35). Concentrations of these metabolites were then determined by comparing their peaks to the relevant internal standard(31–35).
Statistical analysis
All statistical analyses were conducted using R statistical software (version i386 3.5.1)(38). For deriving formulas to compute scores for the a priori defined DASH indices, simple linear regression was used to determine the intercept and slope between the predictor (the average servings of a given food group per day) and the response (the corresponding DASH food group adherence score). DASH adherence scores and baseline characteristics were stratified by incident T2DM at 5-year follow-up (online Supplementary Table 3). Participant baseline characteristics were also stratified by tertiles of DASH adherence scores. For testing differences across tertiles of DASH adherence scores, Pearson’s χ 2 test was used for categorical variables, and Spearman correlations were used for continuous data. Metabolite measurements were non-normally distributed and were thus scaled to a standard deviation of 1 and centred at a mean of 0.
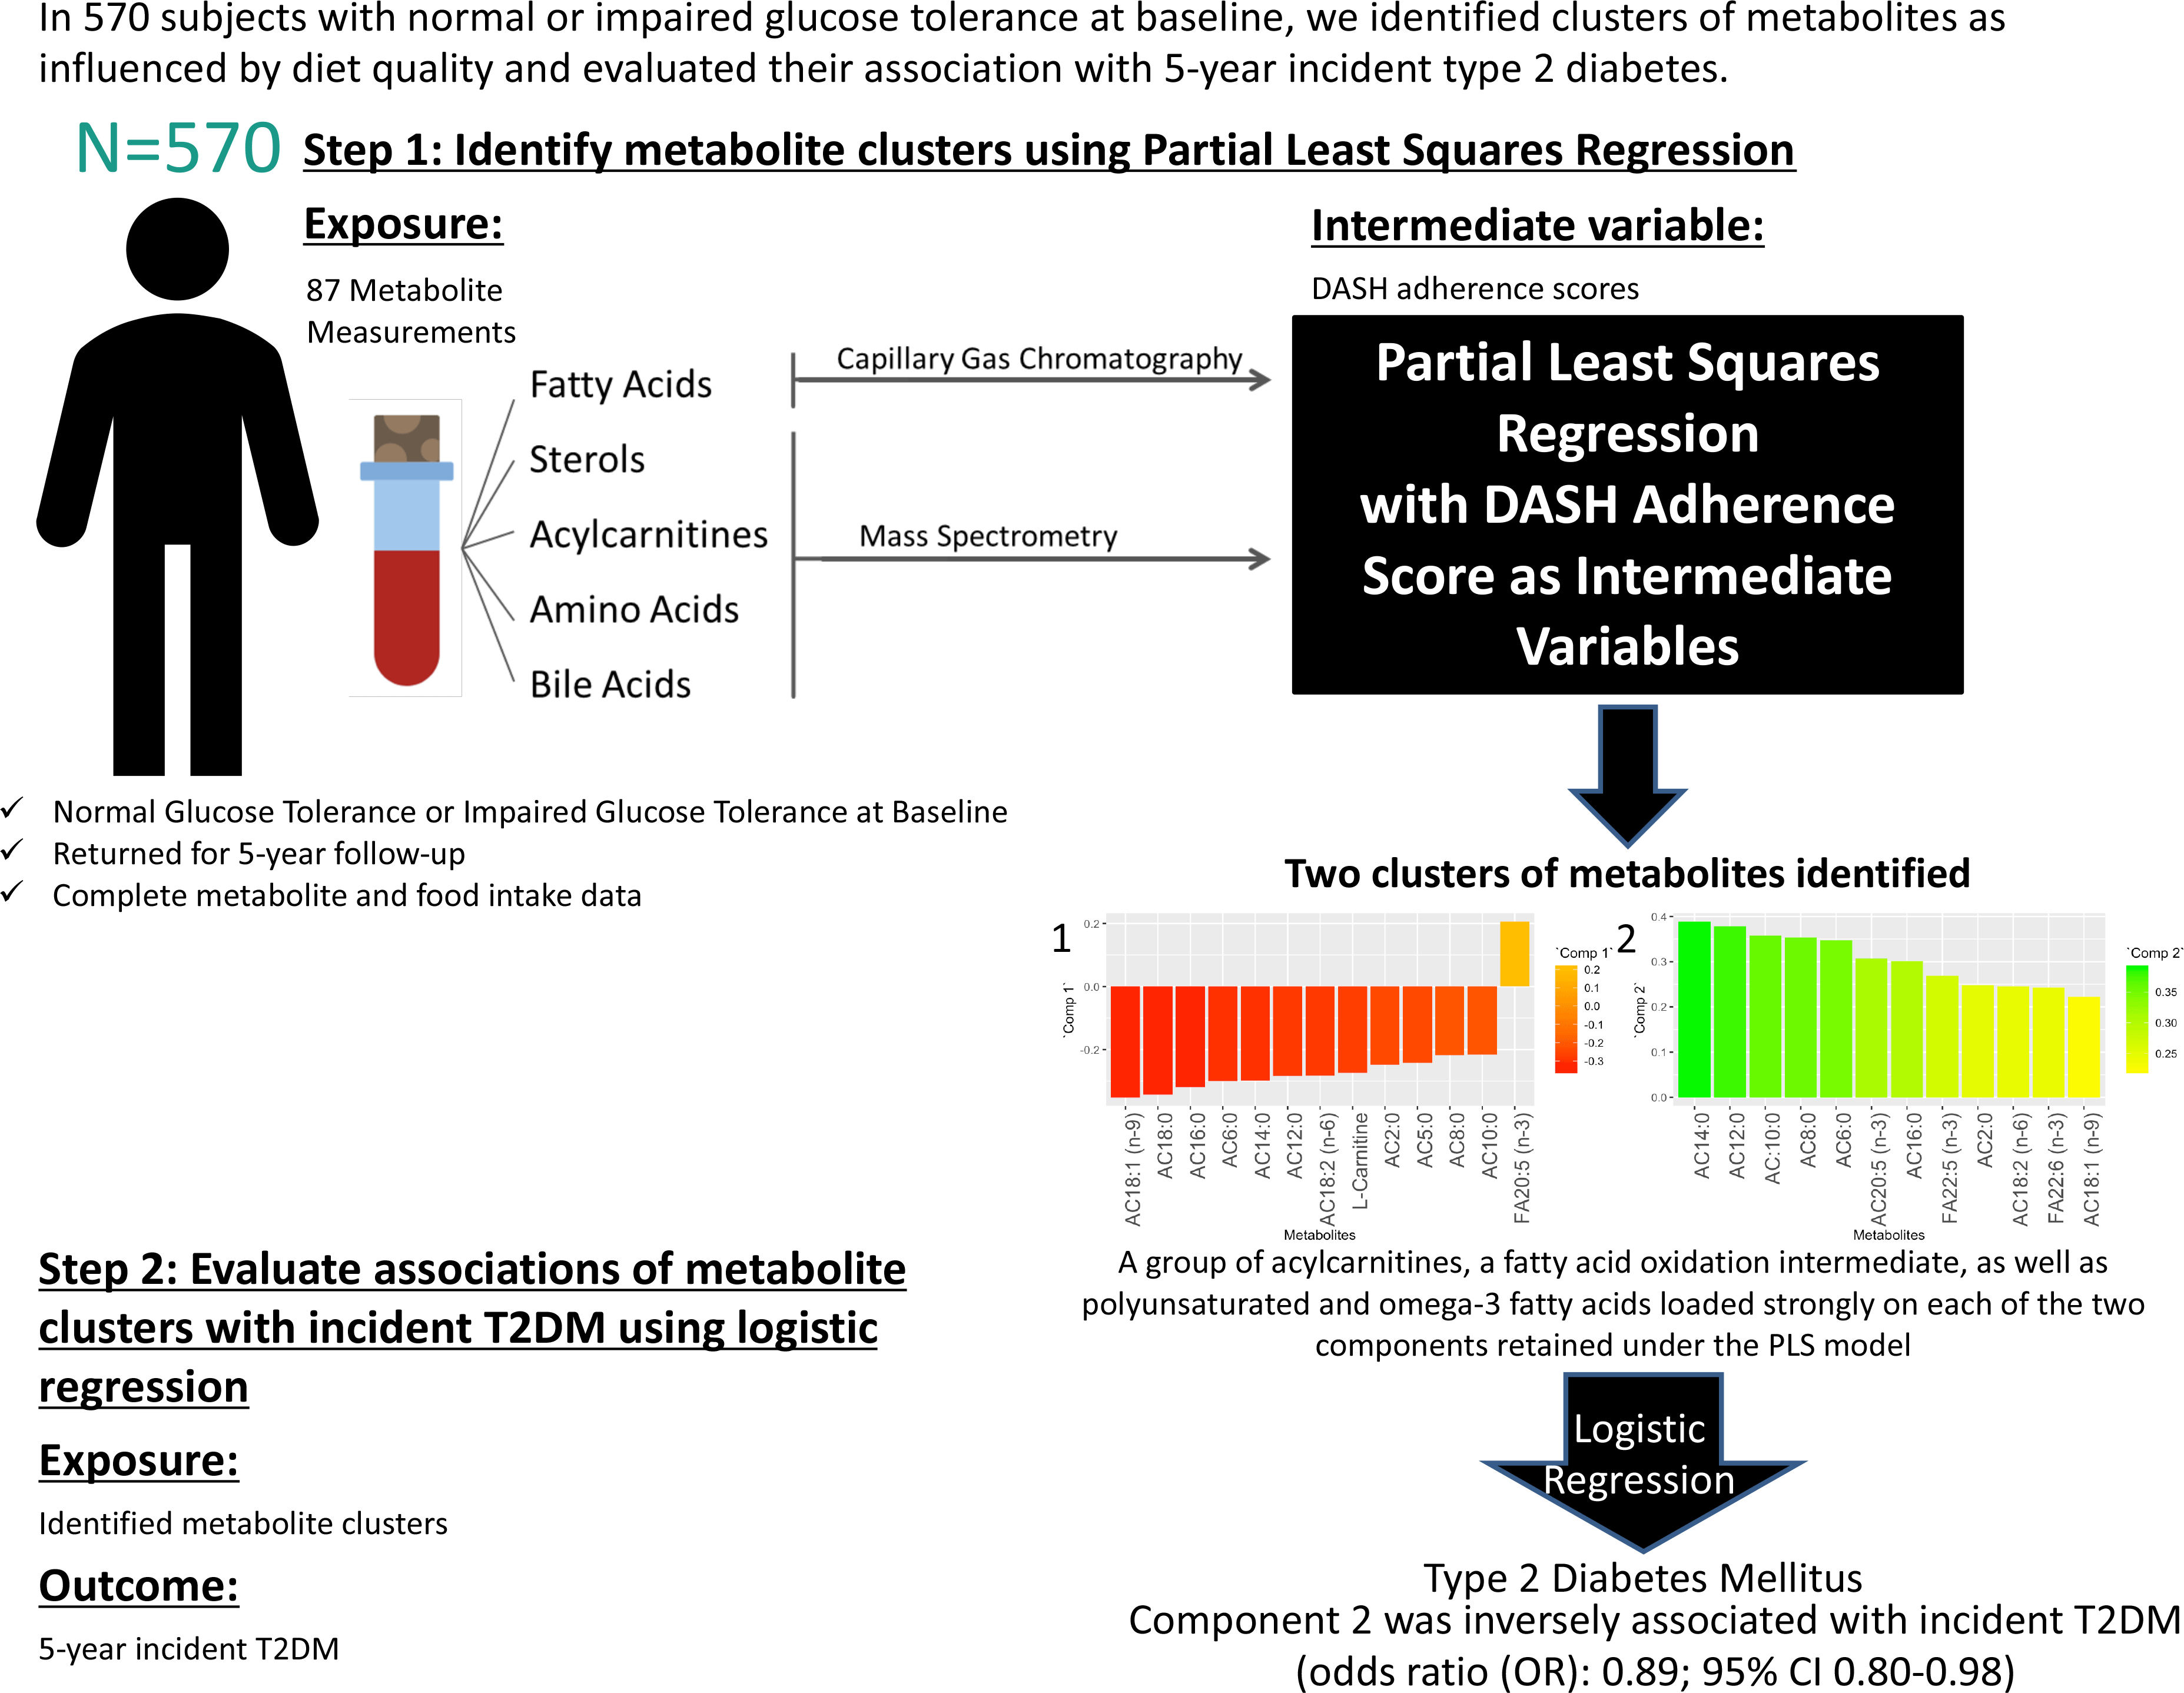
To determine metabolite signatures associated with DASH adherence, the partial least squares (PLS) method was used(Reference Mevik, Wehrens and Liland39). PLS is a data reduction technique that derives new explanatory variables, also referred to as latent variables or clusters, underlying a set of predictor variables conditioned by a response variable(Reference Johnston, Liu and Retnakaran40,Reference Garthwaite41) . Although PLS is frequently used to derive dietary patterns a posteriori, in the current study, it was used to analyse the link between an a priori dietary pattern as the response variable (in this case, the DASH diet) and altered metabolites from the IRAS serum metabolomics panel as the predictor variables. PLS is a technique requiring complete data sets absent of missing data points. The current data set of metabolites was examined, and metabolites with excessive missingness (> 10 %) were excluded from analysis (online Supplementary Fig. 2). After exclusion of these metabolites, the data set was further processed prior to PLS analysis to exclude all subjects with one or more missing metabolite measurements from the analysis. The results of a sensitivity analysis using imputed data are available in the supplementary material (online Supplementary Figs. 2–4 and Supplementary Tables 4–7). PLS models were generated (Statistical Methods Appendix), and metabolite clusters were identified through examination of loadings (≥|0·2|) of individual metabolites in each retained PLS component. Relationships between retained component scores and DASH adherence scores, baseline characteristics and measures related to insulin resistance and β-cell dysfunction were calculated using the Spearman method. To reduce positive skewness, SI was transformed by ln (SI + 1), and DI was transformed by ln (DI).
The association of metabolite clusters identified using PLS with the 5-year incidence of T2DM was examined using multivariable-adjusted logistic regression analysis. PLS-derived scores were used as the primary predictor variables with a binomial outcome variable of 5-year incident T2DM. Odds ratios for incidence of T2DM were generated from multivariable-adjusted logistic regression using three models for each of the PLS-derived scores. Model 1 did not control for covariates. Model 2 controlled for covariates of age (years), sex (male or female), ethnicity (Hispanic, Non-Hispanic White or African American), glucose tolerance status (normal glucose tolerance or impaired glucose tolerance), family history of diabetes (yes or no), education level (secondary school, undergraduate, graduate), smoking status (never, past or current), energy intake (kcal) and total energy expenditure (kcal) as these variables are plausible confounders for our exposure–outcome associations and have frequently been adjusted for in studies assessing associations of diet and diabetes(Reference Nilsson, Ardanaz and Gavrila42–Reference Song, Wang and Pittas44). Model 3 controlled for all covariates in model 2 plus BMI at baseline (kg/m2). All covariates included in the multivariable-adjusted logistic regression models were selected a priori and sex, ethnicity, oral glucose tolerance test status, smoking status and BMI were tested for interaction with the component scores.
Results
In the current sample of 570 IRAS participants, the mean Günther DASH adherence score was 51·6 with a range of 25·1 to 76·8. The distribution of adherence scores is shown in Fig. 1.

Fig. 1. Distribution of Günther’s dietary approaches to stop hypertension (DASH) diet score in current IRAS sample.
Supplementary Table 3 describes baseline characteristics of study participants according to T2DM status at 5-year follow-up. Of the included sample of 570 IRAS participants, ninety nine converted to T2DM by follow-up. Converters were significantly older, had a higher BMI and waist circumference and were more likely to be smokers (all P < 0·05).
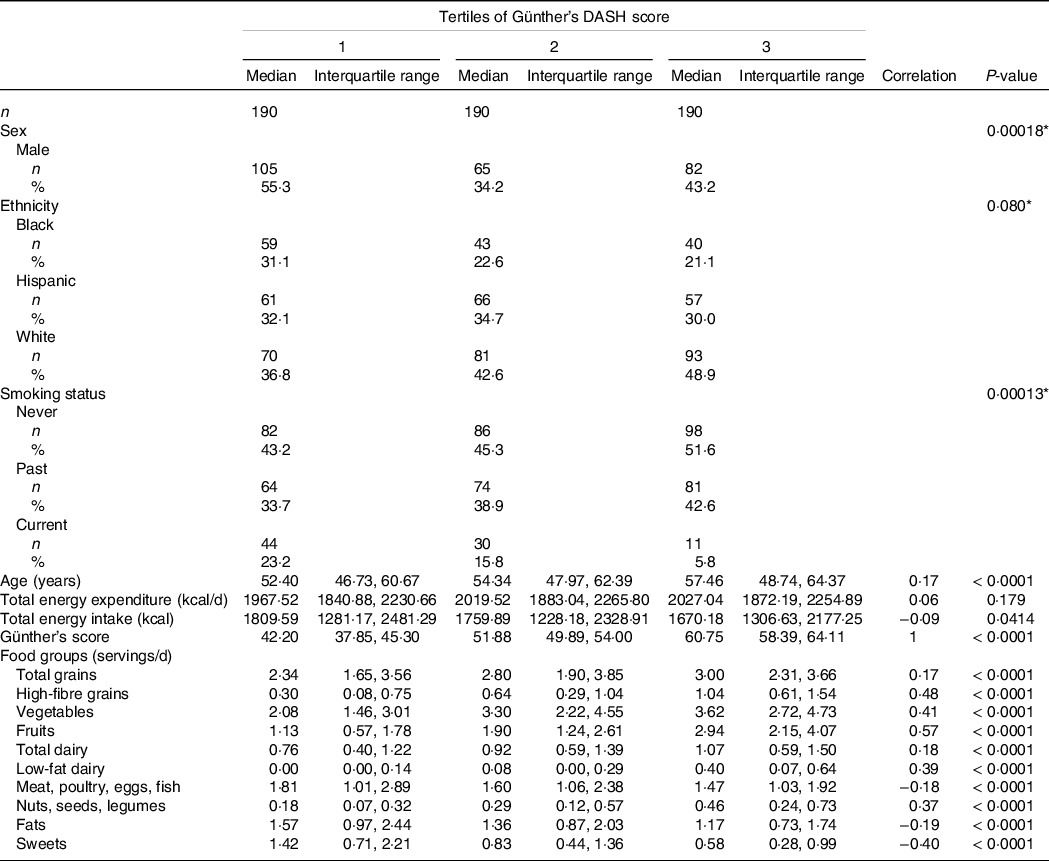
Baseline characteristics and DASH score food group consumption were stratified by tertiles of DASH scores (Table 1). Ethnicity, sex and smoking status showed significant differences across tertiles of DASH scores. The only continuous baseline characteristic to have a significant positive correlation with increasing DASH scores was age (r = 0·17, P-value < 0·0001). Total energy expenditure and total energy intake were both not correlated with increases in DASH scores.
Table 1. Baseline characteristics and Günther’s dietary approaches to stop hypertension (DASH) score food groups across tertiles of Günther’s DASH score
(Numbers and percentages; median values and interquartile ranges)
* Pearson’s χ 2 test.
Correlation and P-value calculating using Spearman correlation.
Intakes presented as median [Interquartile range].
Intake in servings per day for each food group included in the DASH index was significantly correlated with the DASH index scores. Total grains, high-fibre grains, vegetables, fruits, total dairy, low-fat dairy and nuts were positively correlated, while meat, fats and sweets were negatively correlated with DASH scores (Table 1).
The PLS algorithm requires that the data be absent of any missing data points. Supplementary Fig. 2 shows a graphical representation of the percentage of missing data points for each metabolite. Metabolites with over 10 % of missing measurements were excluded from the analysis. The excluded metabolites were docosadienoic acid (22:2 (n-6)), stearidonic acid (18:4 (n-3)), lithocholic acid, γ-butyrobetaine and lauric acid (12:0). IRAS participants with missing metabolite measurements for the remaining eighty-seven metabolites were excluded from analysis (n 147).
The PLS-generated model conditioned on Günther’s DASH adherence score showed a local minimum for the root mean squared error of prediction at two components (online Supplementary Fig. 3). Thus, this test indicated that the number of components to be retained in the PLS model for optimal prediction while avoiding overfitting should be two(Reference Mevik and Wehrens45).
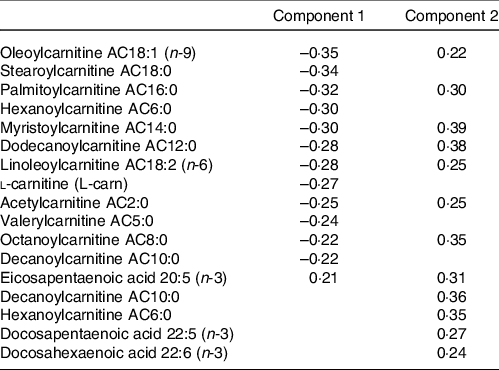
The metabolites with the strongest loadings (≥ 0·2) on the PLS model are presented in Table 2. The first component was characterised by a cluster of metabolites comprising mainly acylcarnitines of short, medium and long length as well as l-carnitine all loading negatively and eicosapentaenoic acid (20:5 (n-3)) loading positively. Component 2 in this PLS model was also largely characterised by strong and positive loadings from acylcarnitines. Seven of these acylcarnitines and eicosapentaenoic acid (20:5 (n-3)) were in common with those strongly loading on component 1 but loading in the opposite direction. In addition, decanoylcarnitine AC10:0, hexanoylcarnitine AC6:0, docosapentaenoic acid (22:5 (n-3)) and docosahexaenoic acid (22:6 (n-3)) also loaded strongly on component 2.
Table 2. Table of metabolites with strongest loadings (≥ 0·2) on components 1 and 2 of the partial least squares (PLS) model conditioned on Günther’s dietary approaches to stop hypertension (DASH) scores
Circle plots generated from the PLS models identified metabolites with large explained variance by the components in the PLS models. The circle plot derived from the PLS model conditioned on Günther’s DASH adherence score showed the explained variance of the two retained components (Component 1:5·1 % variance explained, Component 2:4·6 % variance explained). Also shown in the circle plot is a group of acylcarnitines with over 50 % of variance explained by the two retained components: AC18:1 (n-9), AC16:0, AC14:0, AC12:0 andAC6:0 (Fig. 2).
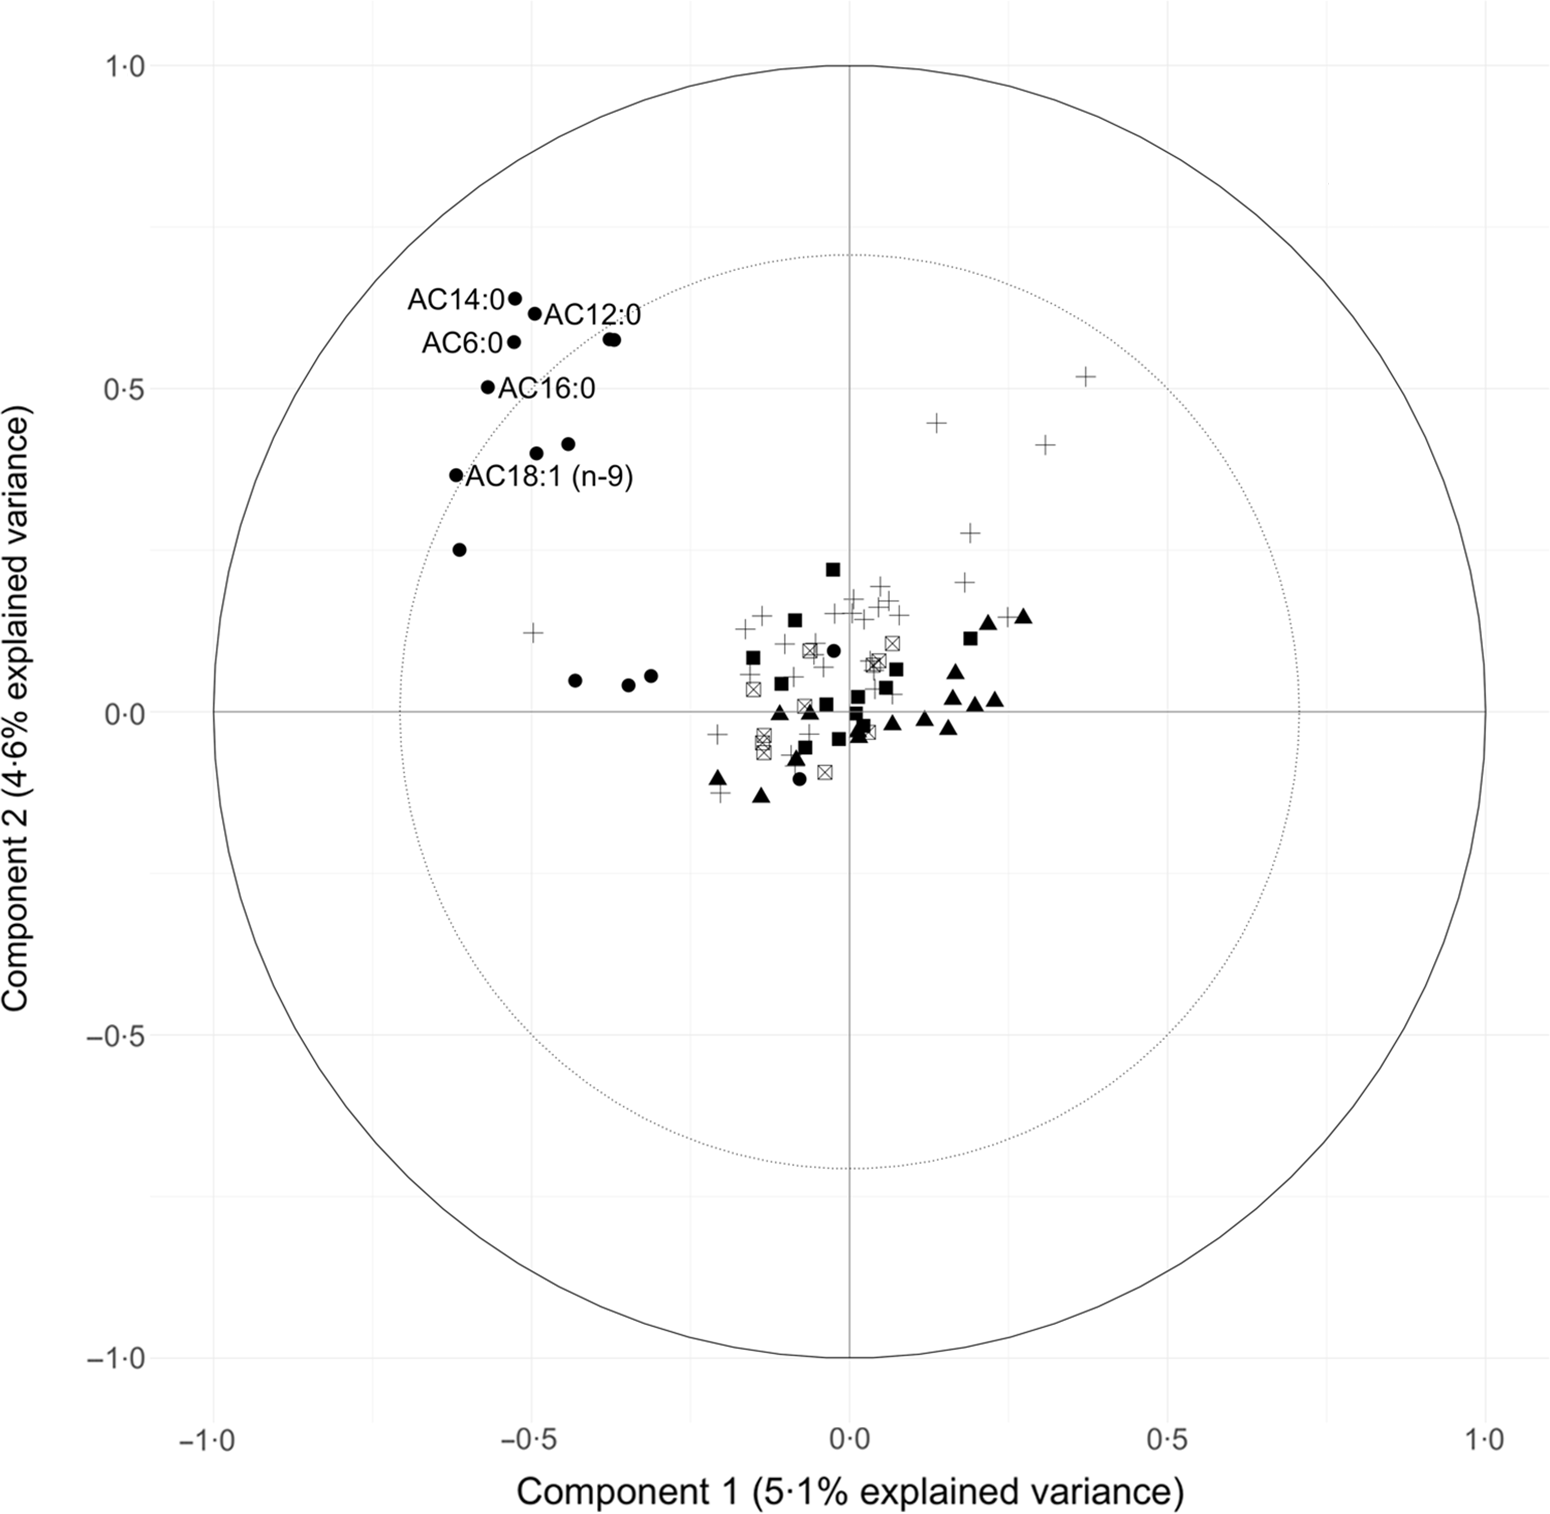
Fig. 2. Circle plot from partial least squares (PLS) model showing the clustering of metabolites conditioned on Günther’s dietary approaches to stop hypertension (DASH) score. The percent explained variance of the complete metabolite data set by each component is shown in brackets on each axis. The solid circular line represents an explained variance of 100 % for a metabolite by a component, while the dashed line represents an explained variance of 50 %. Metabolites between these lines represent variables that strongly explain the underlying structure of the data. Category: ![]() , Acylcarnitines;
, Acylcarnitines; ![]() , amino acids;
, amino acids; ![]() , bile acid;
, bile acid;![]() , fatty acid;
, fatty acid; ![]() , sterols.
, sterols.
The two retained components were positively correlated with the DASH adherence score. Component 1 had a correlation of 0·32 (P-value < 0·001) and component 2 had a correlation of 0·19 (P-value < 0·001) (Fig. 3). These positive correlations indicate that higher (or lower) levels of the identified weighted linear combinations of the metabolites are correlated with higher DASH adherence scores.
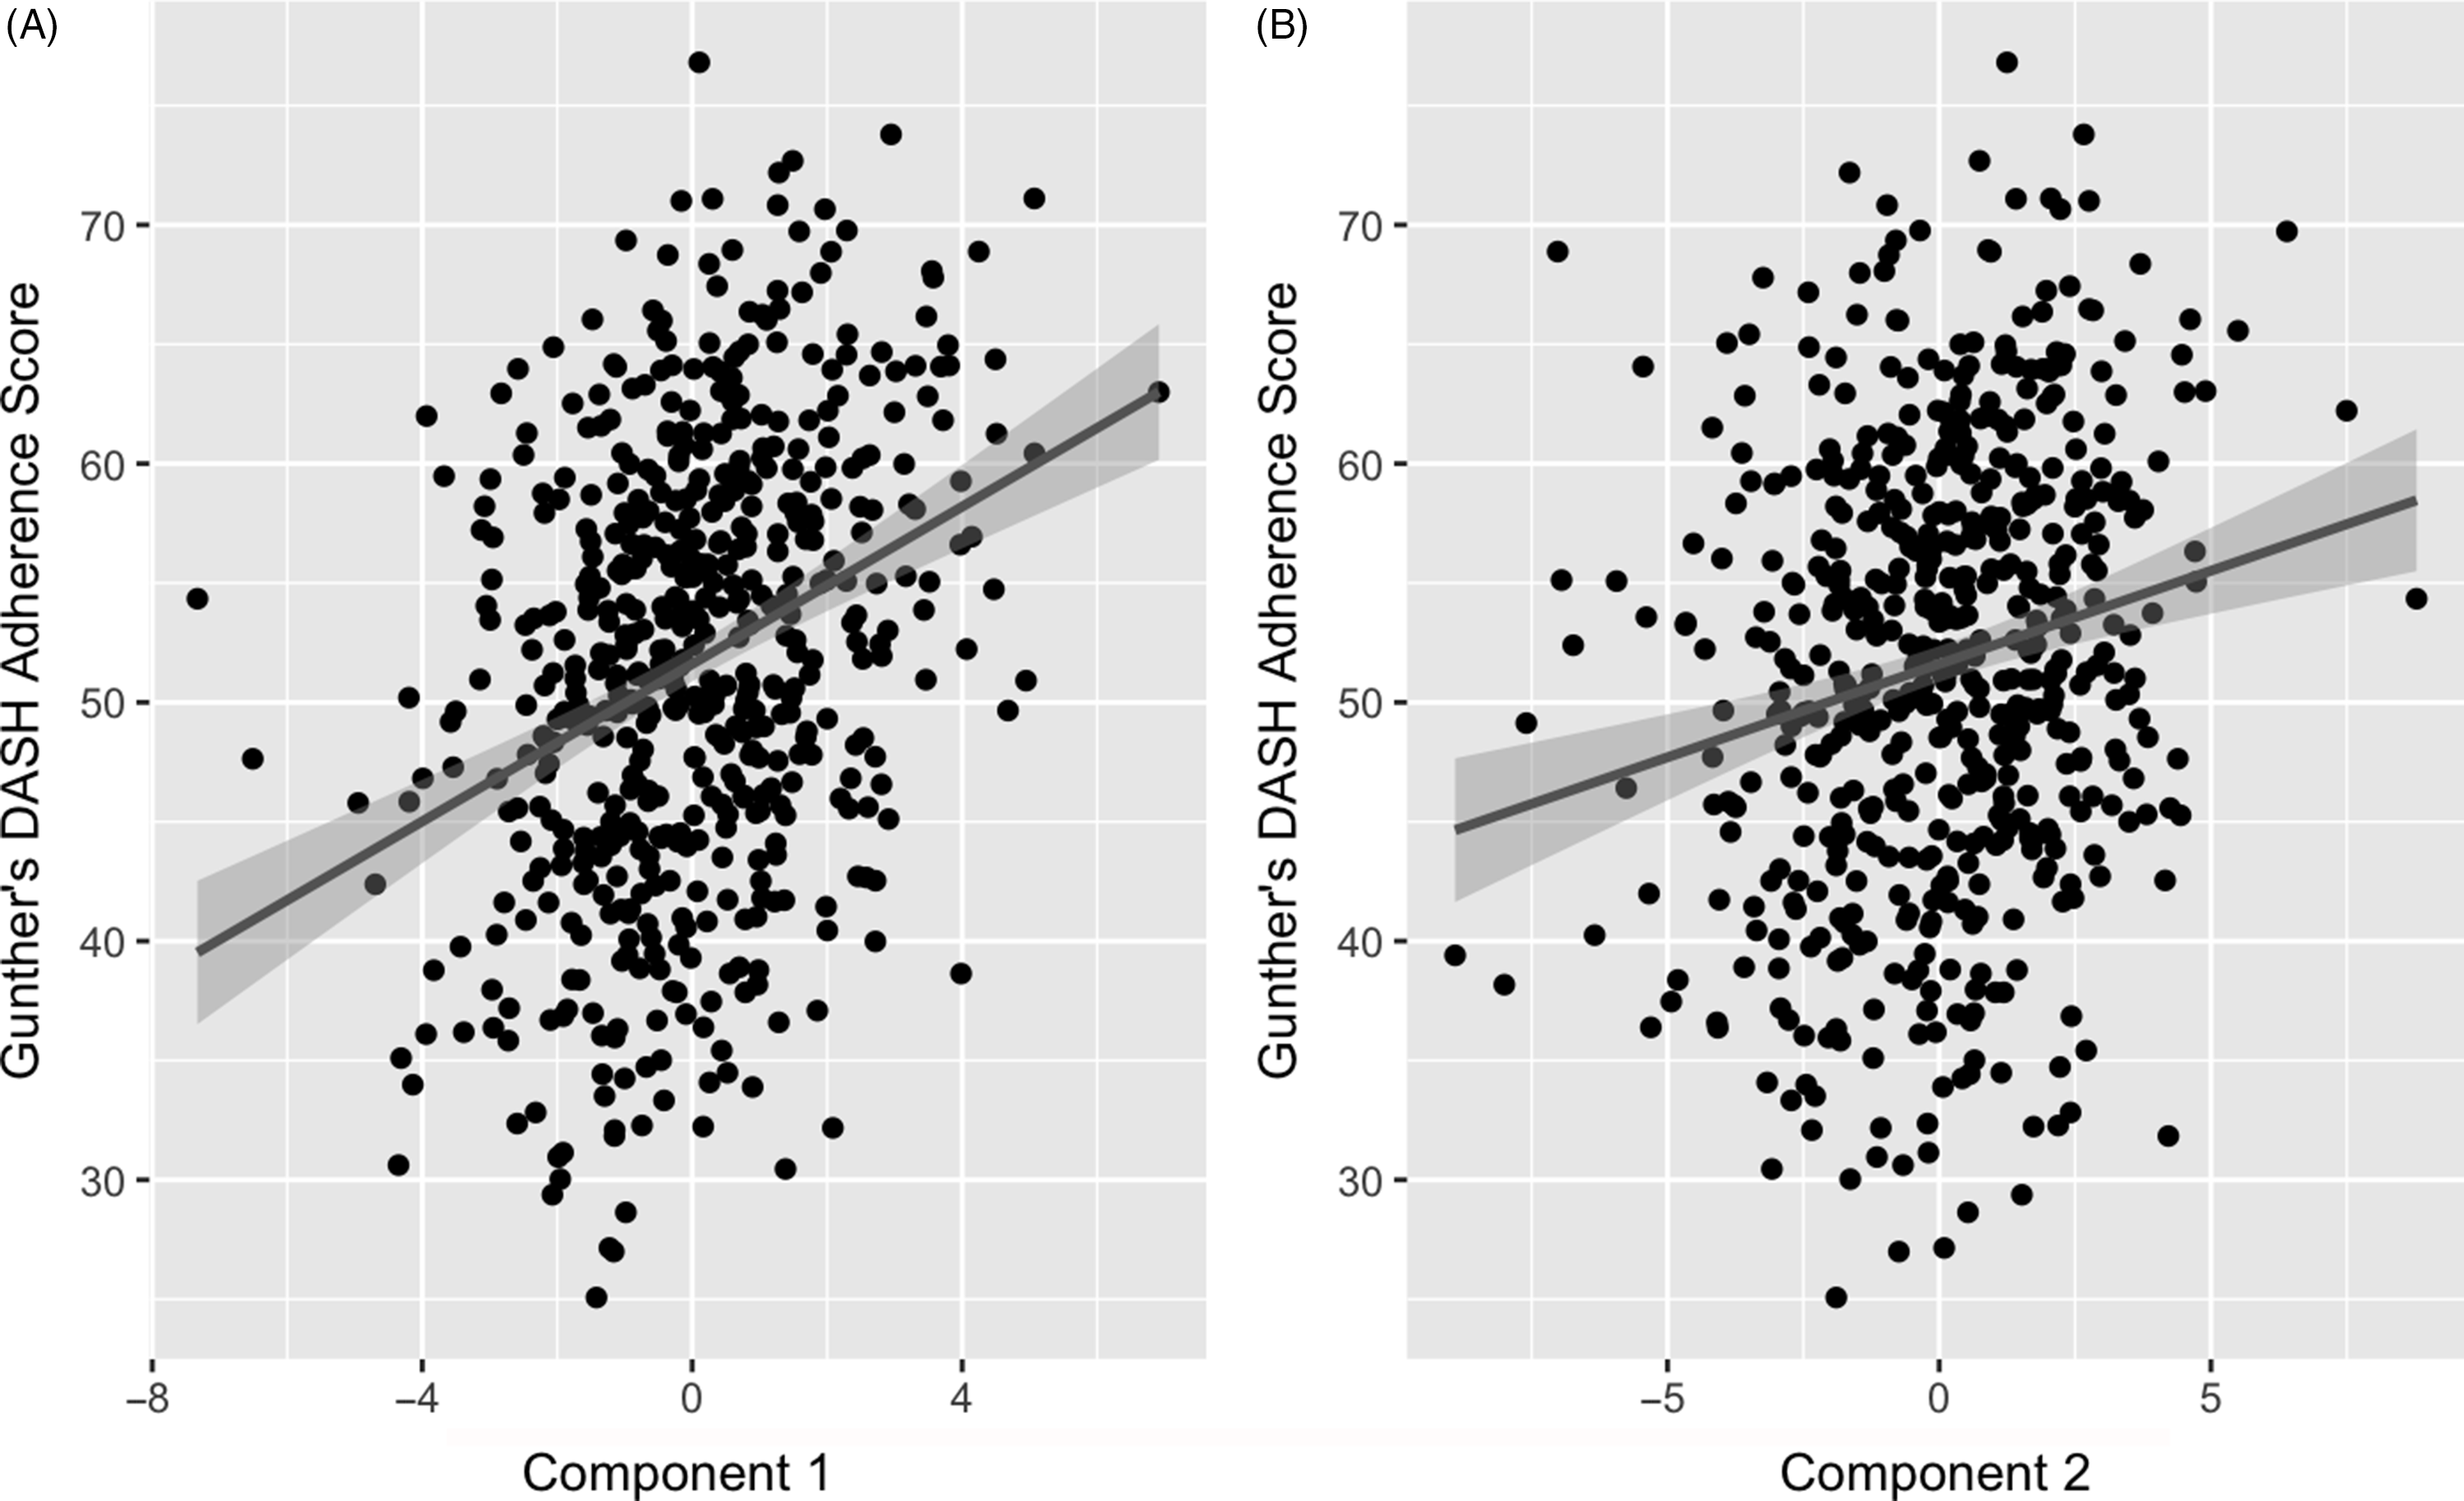
Fig. 3. Association of partial least squares (PLS) model generated component 1 (A) and 2 (B) with Günther’s PLS scores. Line represents a fitted linear regression model with its equation and coefficient of determination presented on the top left of the graph area. Shaded area indicates 95 % confidence interval. A: y = 51·6 + 0·781 x; R 2 = 0·037; correlation = 0·32. B: y = 51·6 + 1·65 x; R 2 = 0·1; correlation = 0·19.
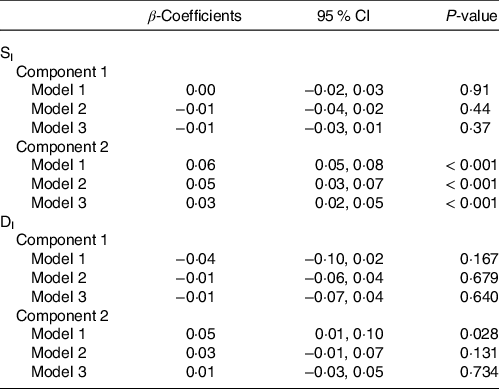
Correlations of extracted component scores with baseline characteristics and measures of insulin metabolism are presented in Table 3. Significant positive correlations were found between the DASH score and both components. Component 2 of the PLS model was also significantly correlated with age, SI, DI, BMI, waist circumference and energetic intake. The positive correlations with SIand DI suggest an association between higher levels of identified metabolites and improved insulin sensitivity and β-cell function. These correlations also suggest that these metabolites are associated with lower BMI, waist circumference and energy intake. We further explored the univariate associations of the components with SI and DI using multivariate linear regression adjusted for covariates. These models indicated significant and positive associations of component 2 with SI (β-coefficient = 0·03, (95 % CI: 0·02, 0·05), P-value < 0·001), but not DI (Table 4).
Table 3. Correlation between extracted Günther component scores and baseline characteristics

§ P < 0 05.
§§ P < 0 01.
§§§ P < 0 0001.
Correlations and P-values were calculated using the Spearman method.
SI was transformed by ln (SI + 1).
DI was calculated by AIR * SI and then transformed by ln (DI).
Table 4. Results from multiple linear regression assessing the association between Günther’s partial least squares (PLS) component scores and both insulin sensitivity (SI) and disposition index (DI) (Coefficients and 95 % confidence intervals)
Model 1: Incidence of type 2 diabetes mellitus at 5-year follow-up ∼ Component Scores.
Model 2: Model 1 + Age + Sex + Ethnicity + Glucose tolerance status + Family history of diabetes + Education Level + Smoking status + Energetic intake + Total energy expenditure.
Model 3: Model 2 + BMI at baseline.
Using the PLS model component scores as primary exposure variables, multivariable-adjusted logistic regression was run with 5-year incident T2DM as the outcome variable (Table 5). Component 1 was not significantly associated with incident T2DM prior to or after adjustment for multiple covariates. Component 2 was significantly inversely associated with the incidence of T2DM. The three models had significant odds ratios, with adjustment of several covariates including BMI at baseline (OR: 0·89, (95 % CI 0·80, 1·00), P-value = 0·043). There were no significant interactions by sex, ethnicity, impaired glucose tolerance status, smoking or BMI (all P > 0·05).
Table 5. Results from multiple logistic regression assessing the association between Günther’s partial least squares (PLS) component scores and incident type 2 diabetes at 5-year follow-up within the current Insulin Resistance Atherosclerosis Study (IRAS) sample (Odd ratios and 95 % confidence intervals)

a Incidence of type 2 diabetes mellitus at 5-year follow-up ∼ Component Scores.
b Model 1 + Age + Sex + Ethnicity + Glucose tolerance status + Family history of diabetes + Education Level + Smoking status + Energetic intake + Total energy expenditure.
c Model 2 + BMI at baseline.
Sensitivity analysis using imputed values for missing metabolite variables yielded results that were not materially different from the primary analysis. Specifically, the PLS clusters were similar, as were the direction and magnitude of the associations of these components with SI, DI and incident T2DM (online Supplementary Tables 4–7). Sensitivity analyses were also conducted adjusting for lipid and blood pressure medications and excluding energy intakes at the extremes of the distribution (top and bottom 1 % of energy intakes were excluded) to take into account dietary misreporting (online Supplementary Tables 8 and 9). The OR from these sensitivity analyses were not materially changed in direction, magnitude or significance.
Discussion
The two main findings of the present paper are (1) the identification of novel clusters of metabolites that include a broad panel of acylcarnitines and PUFA which underlie adherence to a DASH-like diet and (2) a significant negative association between one of the identified metabolite clusters and incident T2DM.
PLS is an established and widely used technique for constructing predictive models of data with high dimensionality(Reference Boulesteix and Strimmer46). This multivariate statistical approach allowed us to identify unique clusters of metabolites that reflect a metabolic signature of adherence to a DASH-like diet. From Fig. 2, a group of acylcarnitines had over 50 % of its variance explained by these PLS-derived clusters. Specifically regarding acylcarnitines, there was a negative loading for the first component and positive loadings for the second component from the PLS model.
Acylcarnitines are intermediate oxidative metabolites in mitochondrial fatty acid metabolism(Reference Mccoin, Knotts and Adams47). Currently, there is no known physiological role of acylcarnitine efflux to the plasma; however, it may indicate a greater lipid oxidation rate(Reference Soeters, Sauerwein and Duran48). Additionally, the presence of acylcarnitines in urine and bile suggests that acylcarnitine efflux may be due to a detoxification process(Reference Schooneman, Vaz and Houten49). The efflux of acylcarnitines has allowed for their use to screen for fatty acid oxidation dysregulation in blood samples(Reference Guasch-Ferré, Bhupathiraju and Hu50). In the context of insulin resistance, lipid overload can lead to fatty acid oxidation outpacing TCA flux, causing incomplete fatty acid oxidation and acylcarnitine accumulation(Reference Schooneman, Vaz and Houten49). Elevated circulating levels of free carnitine and several medium-chain and long-chain acylcarnitines have been reported in cases of T2DM(Reference Nowak, Hetty and Salihovic51–Reference Pallares-Méndez, Aguilar-Salinas and Cruz-Bautista53). However, there is inconsistency in the literature as some studies have reported increases in either uniquely long-chain acylcarnitines or uniquely medium-chain acylcarnitines in individuals with T2DM(Reference Toledo and Delany52,Reference Batchuluun, Al and Prentice54) . The literature has indicated that more studies are required to determine if they are reflecting or causing insulin resistance(Reference Schooneman, Vaz and Houten49). Regarding short-chain acylcarnitines, C4-OH-carnitine has been proposed to cause insulin resistance in both rat and human studies through increased demands on carnitine stores and subsequent inhibition of glucose oxidation(Reference Schooneman, Vaz and Houten49). Acetylcarnitine, on the other hand, may illustrate metabolic flexibility(Reference Schooneman, Vaz and Houten49). Mitochondrial enzymes have been shown to convert acetyl-CoA into acetylcarnitine that prevents the excess accumulation which would inhibit pyruvate dehydrogenase(Reference Schooneman, Vaz and Houten49). It is generally perceived that short-chain acylcarnitines may reflect higher lipid fluxes, but at present, no direct relation with insulin resistance has been established. While most of the evidence points to a positive association between acylcarnitines and insulin resistance and T2DM, the literature to date is limited in demonstrating physiologic mechanisms. In addition, L-carnitine has been shown to improve insulin sensitivity in diabetic patients as well as increase glucose oxidation(Reference Mingrone, Greco and Capristo55).
In addition to the acylcarnitines, the n-3, n-6 and n-9 PUFA were among the strongest loading metabolites in the present analysis. While these PUFA have been shown in trials to improve glycaemic control in type 2 diabetic participants(Reference Coelho, da Silva and Rocha56), a systematic review and meta-analysis of prospective studies and a review of clinical trials have not shown significant reductions in incident type 2 diabetes(Reference Wu, Micha and Imamura57,Reference Flachs, Rossmeisl and Kopecky58) .
In the current study, we have shown that adherence to a DASH-like diet is associated with elevated levels of a unique cluster of acylcarnitines and PUFA. Therefore, an individual acylcarnitine included in the cluster cannot be assumed to have a negative association with T2DM risk. Rather, it is the specific weighted combination of these metabolites identified in our analysis that appears to be inversely related to T2DM risk. In addition to the significant association of component 2 with incident T2DM, this component was also independently associated with insulin sensitivity. Further studies should aim to investigate physiologic pathways through which this unique cluster of metabolites may improve insulin sensitivity and decrease the incidence of T2DM.
To our knowledge, no other study has investigated the metabolomics of the DASH diet in a large multiethnic cohort free of major health outcomes at baseline. A trial investigated the metabolomics of the DASH diet in a sample of thirteen adults who had a history of hypertension and stable hypertensive heart failure with preserved ejection fraction(Reference Mathew, Seymour and Byun14,Reference Hummel, Seymour and Brook59) . The principal finding was an increase in short-chain acetyl, butyryl, propionyl carnitines and l-carnitine after administration of the DASH diet(Reference Mathew, Seymour and Byun14). The results are consistent with the present study in the identification of acylcarnitines of varying lengths underlying adherence to a DASH-like diet. Another study used serum samples from the original DASH trial(Reference Sacks, Obarzanek and Windhauser5) to conduct untargeted metabolomic profiling of the DASH diet(Reference Rebholz, Lichtenstein and Zheng13). Participants followed either a DASH diet (n 110), fruits and vegetables diet (n 111) or a control diet (n 108)(Reference Rebholz, Lichtenstein and Zheng13). Forty-four known metabolites that differed between diet patterns were identified(Reference Rebholz, Lichtenstein and Zheng13). Part of the identified metabolites were six acylcarnitines, all of which were lower among those randomly assigned to the DASH diet. Among these, three were in common with those with strong loadings in the present study: stearoylcarnitine (AC18:0), palmitoylcarnitine (AC16:0) and myristoylcarnitine (AC14:0). Reasons for the differences between the cited study and the current analysis may be attributed to the current study capturing adherence to a DASH-like diet in a large free-living cohort consuming foods in a non-interventional setting, as opposed to an 8 week controlled feeding trial(Reference Rebholz, Lichtenstein and Zheng13). One trial identified compounds from the urine analysis of participants on a controlled DASH-style diet(Reference Reisdorph, Hendricks and Tang15). However, this study focused on compounds from individual foods, rather than metabolites or physiological biomarkers, and the study analysed urine rather than plasma or serum. In addition, the study included a relatively small sample of nineteen participants(Reference Reisdorph, Hendricks and Tang15). A separate study identified the proteomic and metabolomic signature of the DASH diet(Reference Walker, Song and Xu16). This included an eighty-three protein signature which enriched pathways involved in cellular metabolism, hypoxia, inflammation and atherosclerosis(Reference Walker, Song and Xu16). The metabolite signature included forty-three biomarkers mainly consisting of lipids (55 %) with long-chain fatty acids(Reference Walker, Song and Xu16). However, as is highlighted by this study, additional work is required to identify determinants of dietary correlates and examine how they may relate to the progression of modifiable chronic disease(Reference Walker, Song and Xu16). It should also be noted that this study was cross-sectional with no linking to disease outcomes. Our study is the first to our knowledge that examined the metabolite profile of the DASH diet in a multiethnic population not receiving a dietary intervention.
The current study has potential limitations to be considered when interpreting the results. First, the observational design of the study means that causality cannot be established and there may be residual confounding not controlled for. However, extensive precautions were taken to identify and adjust for potential confounders. Second, the metabolite panel employed was relatively small (ninety-two metabolites) compared with more recently developed panels that capture a greater number of metabolites from a range of different pathways. Despite the limitations of the assay, however, it captures many species in families of metabolites that are currently of substantial interest in the literature, including acylcarnitines, amino acids, bile acids, sterols and fatty acids. Therefore, despite the limited number of metabolites available from this assay, we believe our work is novel and informative and provides a basis for future studies to extend these findings with larger metabolite panels. Third, having longitudinal information about dietary intake information and blood draws would have allowed for observation of the evolution of the metabolomic profile over time and may have provided additional granularity regarding whether particular metabolites play a key role in the progression to T2DM. Finally, external validation or replication of the current study in a similar cohort would allow for further verification of the identified metabolite clusters and their association with incident T2DM.
Our study has several notable strengths, including the evaluation of a multiethnic cohort, the thorough characterisation of participants through metabolic, anthropometric, dietary and behavioural measures, fully quantitative metabolite measurements that included families of biomarkers with potential relevance to T2DM etiology, as well as assessment of incident diabetes after 5 years using oral glucose tolerance testing. We also had extremely well-phenotyped measures of insulin sensitivity and β-cell function. Finally, metabolite clusters were identified using PLS, which takes advantage of the multidimensional nature of the data to provide novel insights into underlying metabolic trends not identifiable through traditional statistical methods that focus on single variables.
Conclusion
In summary, this study identified metabolite clusters characteristic of adherence to a DASH-like diet in a large multiethnic cohort. In addition, one metabolite cluster was independently inversely associated with incident T2DM. This study is the first to create a metabolite profile of the DASH diet and examine its associations with T2DM and risk factors for T2DM in a large multiethnic cohort. The results suggest that modulations of specific metabolites, including short-, medium- and long-chain acylcarnitines and n-3 polyunsaturated fatty acids, may account in part for previously established associations between adherence to a DASH-like diet and reduced risk of T2DM.
Acknowledgements
The authors acknowledge the following funding sources: SY was funded by the University of Toronto Banting and Best Diabetes Centre. IRAS was supported by the National Heart, Lung and Blood Institute grants U01-HL47887, U01-HL47889, U01-HL47892, U01-HL47902, DK-29867 and R01-58329 and grant M01-RR-43 from the National Institutes of Health. This study was also funded in part by National Center for Advancing Translational Sciences, CTSI grant UL1TR001881 and the National Institute of Diabetes and Digestive and Kidney Disease Diabetes Research Center (DRC) grant DK063491 to the Southern California Diabetes Endocrinology Research Center.
The authors’ responsibilities were as follows: S. Y., A. D. L., L. E. W., B. A. B., A. J. H.: designed the research; S. Y., L. E. W., S. M. H., B. A. B., S. M. W.: conducted the research; S. Y., L. W. J., B. A. B., A. J. H.: performed or assisted in performing the statistical analysis of the data; S. Y., A. J. H.: wrote the manuscript draft; S. Y., A. J. H.: had primary responsibility for the final content and all authors: contributed to the critical revision of the manuscript for important intellectual content and read and approved the final manuscript.
There are no conflicts of interest.
Supplementary material
To view supplementary material for this article, please visit https://doi.org/10.1017/S0007114521003561


