


The domestic dog (Canis familiaris) is the most phenotypically diverse mammalian species, with an enormous range of sizes, shapes and behaviours(Reference Sutter and Ostrander1). Over the last 150 years, pedigree breeding barriers and standards have resulted in levels of genetic polymorphism that can be greater among domestic breeds than between wild canid species(Reference Lindblad-Toh, Wade and Mikkelsen2). Alongside selection of desired morphological and behavioural traits, a range of less obvious (including metabolic) genetic disorders have also been inadvertently selected and enriched within a number of breeds(Reference Yuzbasiyan-Gurkan, Blanton and Cao3–Reference Cruz, Vila and Webster6). In consequence, pure-bred dogs are considered useful models of human diseases and lifestyle-related disorders(Reference Swanson, Schook and Fahey7). Although some advances have been made in the last three decades, however, many of the nutritional requirements of companion animals remain unknown(Reference Swanson, Schook and Fahey7). With the popularity of complete dog foods manufactured from a wide range of ingredients, it may be possible to tailor diet formulations for dogs with differing physiological needs and metabolic characteristics(Reference Swanson, Schook and Fahey7–Reference Brown, Vanselow and Walkden-Brown9).
A recent appreciation of the importance of interactions between genetics, behaviour, environment and nutrition on human health has resulted in the emergence of the field of nutrigenomics(Reference German, Roberts and Watkins10, Reference Kaput, Ordovas and Ferguson11). The interactions between diet and genotype in domestic dogs are exceedingly complex. Certain breeds are specifically prone to chronic ailments associated with nutrition, for example, copper toxicosis in Bedlington Terriers(Reference Yuzbasiyan-Gurkan, Blanton and Cao3). Certain breeds are also prone to common complaints such as kidney/bladder stones and sensitive bowel problems, in which nutrition can play a role in development and treatment(Reference Safra, Ling and Schaible4, Reference Ko, Backus and Berg5, Reference Meyer, Zentek and Habernoll12, Reference Stevenson, Robertson and Markwell13). However, the underlying physiological/metabolic mechanisms and the contribution of genotype–diet interactions are often poorly understood.
Nutritional studies using commercially available pet food are hampered by the fact that most food raw materials are in the form of a chemically complex matrix. To ensure nutritional requirements stipulated by local legislative bodies are met, manufacturers may supplement diets to produce a complete and balanced pet food. Beyond this, different brands/manufacturers may add other defined constituents such as vitamins, minerals, plant oils and prebiotics with functional nutritional claims(Reference Benyacoub, Czarnecki- Maulden and Cavadini14, Reference Mata-Bilbao, Andres-Lacueva and Roura15). However, the value of such additives at the level of individual breeds may not have been ascertained.
In addition to factors related to breed genotype and diet composition, the diverse microbial flora in the mammalian gastrointestinal tract is capable of a wide range of enzyme-catalysed chemical transformations of metabolites derived from the diet(Reference Blaut and Clavel16). The metabolite profiles of accessible biofluids such as blood, urine and saliva are also affected by behavioural factors such as water intake, meal times, exercise and stress. For example, it is estimated that urine can contain in excess of 2000 different metabolites in omnivorous mammals, with many chemicals displaying huge dynamic variation(Reference Wishart, Tzur and Knox17, 18). Urine is a useful analytical biofluid because it is a concentrated collection of metabolites that are a result of mechanisms to maintain the homoeostasis of the individual. It is likely, therefore, that different physiological stresses may manifest themselves in the urine metabolite fingerprint. Urine composition is also likely to contain information on how the individual responds to diet. Furthermore, the non-invasive nature of urine collection makes it a practical biofluid to collect(Reference Viant, Ludwig and Rhodes19, Reference Saude and Sykes20).
Recent improvements in both analytical chemistry and data mining have resulted in the establishment of metabolomics technology platforms capable of analysing objectively the global composition of complex biofluids such as urine(Reference Viant, Ludwig and Rhodes19–Reference Zhang, Wang and Du24). In the absence of reference chemicals for all expected metabolites, methods for ‘metabolite fingerprinting’(Reference Beckmann, Parker and Enot25) have proven valuable for exploring genotypic and phenotypic differences among organisms. For example, Fourier transform IR(Reference Goodacre, Shann and Gilbert26) and NMR(Reference Viant, Ludwig and Rhodes19, Reference Griffin27) spectroscopies can generate global chemical fingerprints without specialised sample preparation. However, although reproducible and intrinsically quantitative, NMR is relatively insensitive compared with other techniques and, for the vast majority of metabolites, a further level of directed analysis is generally required to link differences in chemical shifts to specific chemistry and thus develop new biomarkers(Reference Viant, Ludwig and Rhodes19, Reference Stella, Beckwith-Hall and Cloarec21, Reference Wang, Lawler and Larson28–Reference Walsh, Brennan and Pujos-Guillot31). Fingerprinting techniques based on MS such as flow injection electrospray MS (FIE-MS) are more sensitive, and offer the advantage that the measured ‘variables’ (mass-to-charge (m/z) ratios) can be linked more directly to specific metabolites by the additional indication of molecular mass, particularly in data derived from ultra-high mass accuracy instruments(Reference Beckmann, Parker and Enot25, Reference Allen, Davey and Broadhurst32–Reference Beckmann, Enot and Overy36). In FIE-MS, a chromatographic step is not utilised and a fingerprint is developed following ‘soft’ ionisation of the sample during injection over 1–2 min. Such fingerprints can be regarded as simplified images of total sample composition, in that each m/z variable may integrate the levels of several isobaric metabolites. During soft ionisation, the main products are charged versions of the parent molecule and salt adducts; fragmentation products are relatively rare and thus the identity of molecules producing signal at specific m/z can be investigated directly based on predicted mass of the metabolite(Reference Overy, Enot and Tailliart37).
The present study set out to explore the utility of metabolite fingerprinting of urine, based on MS, for nutritional studies in domestic dogs. Recent NMR investigations have validated the utility of urine metabolomics for breed classification in dogs(Reference Viant, Ludwig and Rhodes19). Additionally, urine analysis of Labrador retrievers suggested that there are urinary markers consistent with age and caloric regimen(Reference Wang, Lawler and Larson28). The objectives were to determine whether a urine metabolic fingerprint based on MS was a useful tool to investigate breed-specific metabolic differences and whether other physiological or environmental factors have more of an impact upon the urine metabolome. One experimental population consisted of male and female Labrador retriever and miniature Schnauzer dogs housed in a single, purpose-built, environmentally enriched facility and maintained on the same diet. Another population consisted of client-owned male dogs of ten breeds fed unspecified diets in private domestic environments.
Experimental methods
Animal maintenance and urine collection
Labrador retriever and miniature Schnauzer dogs in the controlled-diet studies were housed in small groups in the complex of purpose-built, environmentally enriched facilities at the WALTHAM Centre for Pet Nutrition, in accordance with the Centre's research ethics and UK Home Office Regulations. They had free access to water and were given commercially available, complete dog food throughout the study at energy levels to maintain adult body weight. After an overnight fast (>20 h), dogs were given individual morning walks, during which urine was obtained by a ‘free catch’ in an individually designated Uripet collection vessel. Urine samples were at ambient temperature for up to 30 min before being placed on ice, and then frozen within 1 h of sampling. Samples were kept at − 80°C until shipment on dry ice to Aberystwyth University, where they were stored at − 80°C.
In the technical validation study, four male Labrador retrievers (aged 6–8 years) were maintained on Pedigree Complete Adult dog food (Mars Petcare UK Ltd, Melton Mowbray, UK). In the main controlled-diet study, Labrador retrievers (five male and six female) and miniature Schnauzers (seven male and five female) were fed Pedigree Complete Adult Small Breed dog food, for at least 4 weeks before urine collection. For each animal, up to eight urine samples were collected on different days within a 2-week longitudinal study.
The dogs from private homes were healthy males recruited in the US at several veterinary clinics before a client-elected surgical castration. The breeds represented in the present study were Labrador retriever, Golden retriever, Rottweiler, German shepherd, Doberman, Beagle, Cocker spaniel, Poodle, Yorkshire terrier and Shih tzu. Urine was collected by catheter during routine veterinary surgery (neutering), and stored immediately at 80°C, before shipment and further storage as above.
Metabolite fingerprinting by flow injection electrospray MS
FIE-MS was carried out as previously described with modification to accommodate urine samples(Reference Beckmann, Parker and Enot25). Aliquots of thawed urine (50 μl) were diluted in sterile distilled water (100 μl) and then added to MeOH (350 μl). The samples were vortexed and centrifuged for 6 min at 14 000 g. For FIE-MS analysis, supernatant (60 μl) was transferred to HPLC crimp cap glass vials containing a 200 μl micro glass insert. The vial caps were crimped and then stored at 4°C for same day analysis. Vials were randomised before injection using an autosampler (tray temperature: 15°C). The diluted samples (20 μl) were injected into a flow of 60 μl/min water–methanol (50:50 v/v) using a Surveyor liquid chromatography system (Thermo Scientific, Waltham, MA, USA) as previously described(Reference Beckmann, Parker and Enot25). For each sample, data were acquired in positive and negative ionisation modes in two scan ranges (low: 15–200 m/z; and high: 110–2000 m/z) on a LTQ linear ion trap (Thermo Electron Corporation, San Jose, CA, US). Acquisition time was 5 min. Raw data of the whole infusion profiles were exported and mass intensities of each scan electronically binned to a nominal mass of 1 amu (between − 0·3 and 0·7 amu). The resulting mass spectrum for each analysis was calculated as the mean of eleven scans about the apex of the infusion profile. Mass spectra of all analytical runs per sample and ionisation mode were combined in a single intensity matrix (runs × m/z values). Data were log10 transformed and normalised to total ion current before analysis.
Flow injection electrospray MS signal interpretation
The initial feature selection by Random Forest (RF) produced a list of m/z signals ranked by importance scores or P value for each classification task. Using ARMeC, a bespoke database developed for FIE-MS signal annotation(Reference Overy, Enot and Tailliart37), the top ranked m/z values (generally top 40) were examined for groups of potentially related signals that could represent salt adducts (e.g. Na = M+23; K = M+39; Cl = M+35), common neutral losses (e.g. water = M − 18; formate = M − 46) or isotopes (M+1 or +2) of individual metabolites. As several overlapping solutions predicting the presence of different metabolites were often possible, the most likely combination of ions identifying a specific metabolite was confirmed by further examining signal relationships in a correlation analysis using just m/z with an appropriate low P value. A comprehensive list of metabolites present in the mammalian metabolome was compiled from exhaustive literature and database searches. Further investigation of predicted metabolome differences between samples centred on the targeted analysis of GC-time-of-flight MS (GC-TOF-MS) data, as the majority of metabolite classes predicted to be explanatory of differences among breeds were suitable for GC-MS analysis.
Metabolite profiling using GC-time-of-flight MS analysis
Neat urine (50 μl) was dried in vacuo and GC-TOF-MS analysis performed as previously described(Reference Catchpole, Beckmann and Enot34). Methoximation of carbonyl moieties in 100 μl of a 20 mg/ml solution of methoxyamine hydrochloride in pyridine (Fluka, St Gallen, Switzerland) was carried out at 30°C for 90 min. Acidic protons were subsequently derivatised with 100 μl N-methyl-N-(trimethylsilyl)-trifluoroacetamide (Machery-Nagel GmbH, Düren, Germany) at 37°C for 30 min. One microlitre of the resulting solution was injected (injector temperature 250°C; 1:2 split ratio) into a Pegasus III GC-TOF-MS system (Leco Inc., St Joseph, MI, USA) and chromatographed on a 20 m DB5-MS column (20 m × 0·25 μm internal diameter × 0·25 μm film) using a temperature gradient (80–330°C over 17 min). Mass spectra were recorded after a solvent delay of 112 s over an m/z range of 54–500 at an acquisition rate of 20 spectra/s and ion source temperature of 230°C.
Peak finding and deconvolution were performed using Leco ChromaTof software. Mass spectra of all detected compounds were compared with in-house standards and spectra in the National Institute of Standards and Technology library (http://www.nist.gov/srd/nist1.htm), and other publicly available databases. All data pre-treatment procedures, such as baseline correction, chromatogram alignment, data compression and curve resolution, were performed using custom scripts in Matlab v.6.5.1 (The Math Works Inc., Natick, MA, USA). Targeted peak lists were generated, and the peak apex intensity of a characteristic mass in a retention time window for each GC-MS dataset was saved in the form of an intensity matrix (run × metabolite) using Matlab.
Data analysis
All calculations were performed in the R v.2.3+ (http://cran.r-project.org) and Matlab environments as previously described(Reference Enot, Beckmann and Overy35, Reference Enot, Lin and Beckmann38). Principal component analysis and eigenvalue decomposition were performed on the covariance matrix using mean-centred data. Linear discriminant analysis (LDA) was implemented in Matlab according to Thomaz(Reference Thomaz, Boardman and Hill39). RF analysis was done with the R package randomForest (v 4.5+) with default settings except that the number of trees was set to 1000. The statistical significance of the RF importance score and model margins were assessed by 1000 random permutations: P was defined as the fraction of scores larger than or equal to the original importance score of the unpermutated data. Model margins obtained under permutation were used to estimate distribution quartiles(Reference Enot and Draper40). Receiver operating characteristic curves were used as an alternative measure of model-predictive abilities(Reference Enot and Draper40, Reference Sing, Sander and Beerenwinkel41) and summarised as the area under the curve statistic. Correlation analysis of individual signals was performed using variables that fell under a specified threshold in at least one of the comparisons. The absolute value of the correlation coefficient between variables was used as the similarity measure for performing hierarchical cluster analysis with complete linkage as the clustering method (hclust function in R). The Wilcoxon rank sum test in Matlab was used as a non-parametric univariate test to assess whether two samples came from the same distribution.
Results
Validation of sampling and flow injection electrospray MS fingerprinting for urine sample classification in male Labrador retrievers
To validate the technique, urine from four male Labrador retrievers was subjected to FIE-MS fingerprinting and multivariate data analysis. Principal component analysis revealed that samples from all four dogs were well dispersed in a single large grouping in a scores plot of principle components (PC1 × PC2; Fig. 1(a)). LDA was performed to determine whether urine samples from individual dogs could be discriminated (Fig. 1(b)). Each point represents a chemical fingerprint (high range, positive ion data: 50–2000 m/z) of urine from a single dog on eight different days during a 2-week period. In all cases, samples from individual dogs are found in discrete associations of similar dimension, but model statistics suggested that inter-dog differences were minimal (i.e. Tw or eigenvalues < 2 in both DF1 and DF2(Reference Enot, Lin and Beckmann38, Reference Enot and Draper40)). These data indicated that the metabolome of each dog was sufficiently consistent and the sampling method was deemed adequate for further studies.
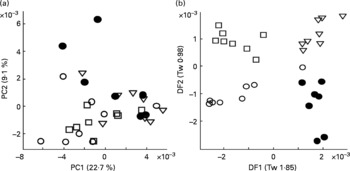
Fig. 1 Reproducibility of urine sampling from male Labrador retrievers assessed by multivariate analysis of flow injection electrospray MS fingerprints. Symbols denote individual dogs, and points represent fingerprints (positive ions; m/z 50–1100) of daily urine samples taken over 2 weeks. (a) Scores plot of the first two principal components (PC1 and PC2). Numbers in brackets indicate percentage of variance explained by each PC. (b) Linear discriminant analysis (LDA) on same samples. Numbers in brackets indicate eigenvalues (Tw) for each discriminant function (DF).
Flow injection electrospray MS fingerprinting to distinguish breed and sex in Labrador retrievers and miniature Schnauzers
With sampling and analytical chemistry methods established, fuller experiments were conducted to determine the relative importance of sex and breed in discriminating between the urine FIE-MS fingerprints. Urine was collected (n 143 individual samples) from five male (n 36) and six female (n 33) Labrador retrievers, and seven male (n 48) and five female (n 26) miniature Schnauzers. FIEMS data are highly dimensional and, in the case of urine, were expected to display considerable biological variability.
Such data require the use of robust multivariate data-mining tools. In preliminary experiments, sample classification accuracy was compared using a range of supervised data analysis methods that we have previously used successfully with complex metabolome data(Reference Enot, Lin and Beckmann38, Reference Enot and Draper40). LDA and RF were applied to all four FIE-MS datasets (positive and negative ion; high and low m/z range) to assess the difficulty of determining both breed and sex in all possible binary comparisons. For two of the datasets, Table 1 summarises LDA and RF model statistics, in the forms of percentage classification accuracies, and of area under the curve for receiver operating characteristic curves. The latter have a value of 0·5 if samples from either class are uniformly distributed across the decision boundary, and a value of 1 if the decision boundary completely discriminates the classes(Reference Enot, Lin and Beckmann38, Reference Enot and Draper40).
Table 1 Model statistics for classification of dogs by breed or sex using flow injection electrospray MS fingerprints
AUC, area under the (receiver operating characteristic) curve; RF, Random Forest; LDA, linear discriminant analysis; LF, Labrador retriever female; LM, Labrador retriever male; MF, miniature Schnauzer female; MM, miniature Schnauzer male.
Similar trends were observed in relation to each task with both data-mining methods; breed classification was always much more accurate and generated more robust models than sex assignment. These major features of sample class discrimination are clearly evident in LDA projections (Fig. 2) of the first two discriminant functions.
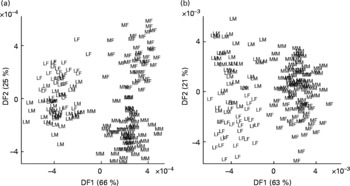
Fig. 2 Classification of dogs by breed and sex using urine metabolite fingerprints. Samples from neutered male and female Labrador retrievers and miniature Schnauzers were analysed by flow injection electrospray MS in both ionisation modes, and the spectra subjected to linear discriminant analysis. (a) Positive ion mode; (b) negative ion mode. Percentage of variance accounted for by first two discriminant functions (DF1 and DF2) is in brackets. LF, Labrador retriever female; LM, Labrador retriever male; MF, miniature Schnauzer female; MM, miniature Schnauzer male.
Random Forest data mining for metabolome features discriminating dog breeds
We have previously shown that although LDA and RF will often classify samples with comparable accuracies, there are advantages in using RF for the subsequent identification of explanatory variables(Reference Enot, Beckmann and Overy35). One output of RF is an importance score for each variable for any particular classification problem. In previous experiments, importance scores ranked in descending order generally fell dramatically and then rapidly levelled out within the range 0·0030–0·0015, below which variables often lack significant explanatory power at P = 0·005(Reference Enot, Beckmann and Overy35, Reference Beckmann, Enot and Overy36, Reference Enot, Lin and Beckmann38, Reference Enot and Draper40). Importance scores derived from RF models comparing FIE-MS fingerprints of Labrador retrievers and miniature Schnauzers exhibited similar trends (Fig. 3). In low molecular weight range data, approximately 15–20 m/z signals in both ionisation modes potentially have significant explanatory power to discriminate MS from LR dogs (Fig. 3(a)). A similar number of potentially significant signals were evident in the high-range positive ion data with a smaller number of ions (8–15) having explanatory power in high-range negative ion data (Fig. 3(b)).
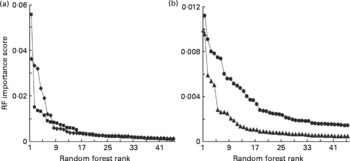
Fig. 3 Relative significance of explanatory signals discriminating dog breeds in flow injection electrospray MS (FIE-MS) fingerprints. Importance scores of the top fifty m/z signals (in rank order) from Random Forest (RF) models comparing FIE-MS fingerprints of Labrador retrievers (LR) and miniature Schnauzers (MS) using (a) low m/z range (15–200) or (b) high m/z range (110–1100) data. (a) ![]() , NegL;
, NegL; ![]() , PosL. (b)
, PosL. (b) ![]() , NegH;
, NegH; ![]() , PosH.
, PosH.
All potentially explanatory m/z signals (P ≤ 0·005) are shown in RF importance score rank order within all four datasets (Fig. 4). Putative structural assignments from ARMeC(Reference Overy, Enot and Tailliart37) are organised in columns by metabolite class with individual-predicted metabolites numbered as indicated in the figure legend. The annotation of metabolites was guided by previous analyses of human urine in the Human Metabolome Project database(18). The predictions suggest that more than 50 % of the significant signals in both ionisation modes represent ionisation products originating from a wide range of phenolic molecules. Alternative predictions to phenolics centred largely on hydroxylated organic acids structurally related to butanoate, such as citramalate, 2-hydroxy-3-methylbutyrate or 2-hydroxybutanoate. Signals possibly representing fatty acids, particularly carnitine derivatives, were also predicted to discriminate between FIE-MS fingerprints of the two breeds. Particularly noteworthy are 240 and 224 m/z (positive ion mode), which were highly correlated and could represent octanoylglycine. Two strongly correlated positive ion signals (527 and 543 m/z) commonly associated with trisaccharides such as raffinose and kestose in FIE-MS data(Reference Catchpole, Beckmann and Enot34) were also highly ranked. Signals possibly derived from pantothenate (vitamin B5), glycerol, urea and several polyamines could also have significant explanatory value.
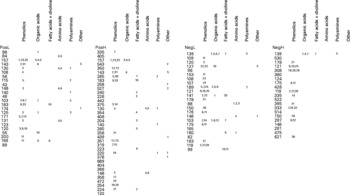
Fig. 4 Metabolite signals discriminating Labrador retrievers from miniature Schnauzers in urine flow injection electrospray MS fingerprints. The left hand side of each of the four panels lists potentially explanatory m/z signals (P ≤ 0·005) in RF importance score rank order within all four datasets (PosL, positive ion low m/z range; PosH, positive ion high m/z range; NegL, negative ion low m/z range; NegH, negative ion high m/z range). In each dataset (ionisation mode × mass range), tentative structural assignments from the signal annotation tool ARMeC (http://www.armec.org) are organised in columns by metabolite class. Individual-predicted metabolites are numbered as follows. Phenolics: 1, quinaldic acid; 2, phenylacetaldehyde; 3, phenylanaline; 4, 3-hydroxybenzylalchohol; 5, cinnamaldehyde; 6, 3- or 4-hydroxybenzoate; 7, trans-cinnamate; 8, 3,4- or 2,3-dihydroxyphenylacetic acid; 9, 3-hydroxybenzaldehyde; 10, benzoate; 11, 3,4-dihydroxybenzoate; 12, phenylanalineglucoside; 13, trans-cinnamate glucoside; 14, 3,4-dihydroxyphenylacetic acid; 15, chlorogenate; 16, tyrosine; 17, 3-hydroxyphenylpropionic acid; 18, cynadin-3-glucoside; 19, naringenin chalcone; 20, pelargodinin; 21, hippuric acid; 22, benzaldehyde; 23, 3-hydroxyphenylacetic acid; 24, m-coumaraldehyde; 25, 3-hydroxy-3-phenylpropanoate; 26, hydroxyhippurate; 27, m-coumarate; 28, phenylpyruvate; 29, cyanadin; 30, 3- or 4- hydroxybenzoic acid glucoside; 31, cis-cis-muconic acid; 31, pre-phenylacetate. Organic acids: 1, 3-hydroxyisobutyrate; 2, citrate; 3, 2-hydroxy-3-methylbutyrate; 4, succinate; 5, malate; 6, 2- or 3-hydroxybutyrate; 7, succinate semialdehyde; 8, pyruvate; 9, 2-hydroxy-3-methylbutyrate; 10, 2,3-dihydroxybutyrate; 11, citramalate; 12, hydroxypyruvate; 13, pantoate. Fatty acids: 1, tetradecanoic (myristic) acid; 2, octanoyl glycine; 3, acetyl carnitine; 4, decanoyl carnitine; 5, hexanoyl carnitine; 6, dodeconoic (lauric) acid; 7, choline; 8, 2-octanoic acid; 9, carnitine; 10, octanoate; 11, hexenol. Amino acids: 1, β-alanine; 2, l-alanine; 3, n-methylglycine; 4, glutamate; 5, pyroglutamate; 6, taurine; 7, methyl-l-glutamate. Polyamines: 1, cittruline; 2, ornithine; 3, cadaverine. Other: 1, pantothenate; 2, raffinose; 3, glycerol; 4, glycerate; 5, urea.
As there were many overlapping potential structural assignments, the phenolic signals were examined in more detail by mapping predicted metabolites onto known metabolic pathways and assessing the degree of correlated signal behaviour in the datasets. A likely solution centred on the metabolism of dietary cinnamates (including chlorogenate) and flavonoids initially by the gut microflora to generate benzoate or coumarate derivatives destined for excretion (Fig. 5). An alternative pathway could represent the degradation of phenylalanine following deamination to 3-hydroxyphenylacetate via phenylacetaldehyde.
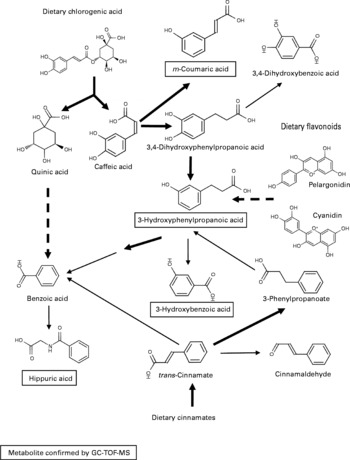
Fig. 5 Predicted metabolism of dietary polyphenols to explain urine differences between Labrador retrievers and miniature Schnauzers. The metabolic pathway shown is a ‘best-fit’ model, which accounts for a large number of the explanatory m/z signals in flow injection electrospray MS fingerprints tentatively annotated as derived from phenolic compounds. Metabolites in text boxes were confirmed by GC-MS. ![]() , multiple steps in a metabolic pathway; → , represent one-step biotransformations;
, multiple steps in a metabolic pathway; → , represent one-step biotransformations; ![]() , represent steps likely to be carried out by colonic microflora; → represent endogenous biotransformations.
, represent steps likely to be carried out by colonic microflora; → represent endogenous biotransformations.
GC-time-of-flight MS analysis to confirm the identity of discriminatory metabolome signals
With a clear indication that urine from Labrador retrievers and miniature Schnauzers can be discriminated by metabolite fingerprinting, replicate samples were further subjected to GC-TOF-MS analysis(Reference Catchpole, Beckmann and Enot34, Reference Beckmann, Enot and Overy36). As urine was derivatised directly after drying down without solvent extraction or partitioning, it was expected that GC-TOF-MS should allow the analysis of a wide range of metabolite classes. Preliminary experiments revealed that the urine matrix was complex, highly variable and contained a wide range of structurally unknown chemistry. Under such circumstances, it is extremely difficult to use instrument manufacturers' or third-party software tools to align chromatograms, identify metabolite peaks, deconvolve spectra and quantify peaks. As an alternative approach, we focused on the identification of retention time windows in which total ion currents exhibited breed-specific differences as detected by the Wilcoxon rank sum test following rough alignment of chromatograms using in-house software. Peaks within each of these regions were then manually deconvolved, aligned and their relative intensity calculated. Peaks differing significantly in intensity between breeds in a Wilcoxon test (P ≤ 0·00 001) are shown in Table 2. In line with the metabolite fingerprinting, predictions more than 50 % of the structurally characterised metabolites were phenolic in nature. Specifically, the fact that 3-hydroxybenzoic acid, 3-hydroxyphenylpropanoic acid, m-coumaric acid and hippuric acid were all strongly discriminatory suggested that the major compositional differences in urine of the two dog breeds centred on metabolism of dietary polyphenols (Fig. 5; compounds in boxes), rather than endogenous metabolism of phenylalanine via phenylacetaldehyde. ANOVA confirmed that these metabolites displayed significantly different mean-relative intensities in the two breeds, with the levels of phenolics in urine being much greater in Labrador retrievers (Fig. 6). As anticipated from metabolite fingerprinting results, raffinose, kestose and glycerol levels differed significantly between the two dog breeds (Table 2; Fig. 6). Additionally, citric acid was also highlighted as a discriminatory metabolite. In this case, ANOVA revealed that, although citrate levels generally appeared higher in miniature Schnauzers, the class means were rather similar and the upper quartile range was much greater, which was indicative of significant inter-dog variability (data not shown). As hydroxylated butanoate derivatives were predicted as highly ranked alternatives to phenolics, the GC-TOF-MS chromatograms were re-examined manually for evidence of peak differences between dog classes. The level of 2-hydroxybutanoate and 3-aminoisobutyric acid was discovered to be very similar between breeds but demonstrated sex-specific concentration differences (Fig. 6).
Table 2 Metabolite peaks differing significantly between dog breeds in GC time-of-flight MS analysis of urine
NIST, National Institute of Standards and Technology.
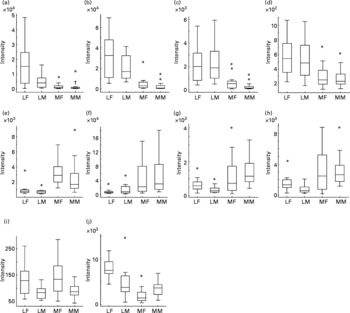
Fig. 6 Relative levels of metabolites discriminating urines of Labrador retrievers and miniature Schnauzers. The figure shows for each breed × sex combination the relative signal intensity ratios for ten specific metabolites as box plots derived from analysis of GC-MS data (Wilcoxon text; P ≤ 0·00001). LF, Labrador retriever female; LM, Labrador retriever male; MF, miniature Schnauzer female; MM, miniature Schnauzer male. (a) Hippuric acid; (b) coumaric acid; (c) 3-hydroxyphenyl propanoic acid; (d) 3-hydroxybenzoic acid; (e) glycerol; (f) citric acid; (g) raffinose; (h) kestose; (i) 2-hydroxybutyric acid; (j) β-amino-isobutyric acid. *Outliers.
Breed discrimination by analysis of urine metabolome of pet dogs fed their normal diet
The study above indicated stable, breed-specific differences in the urine metabolome of dogs in a highly controlled experimental design. Further work was undertaken to assess the utility of metabolomics for animals from domestic homes, whose diet and prior behavioural activity were not specified. Ten young male dogs of each of ten breeds had urine sampled after catheterisation just before client-elected castration at a range of veterinary clinics in the US. Following FIE-MS analysis, all breeds were compared in a single LDA projection (Fig. 7(a)). Some clustering of breed samples is evident, but with the exception of Beagles in DF1, breed separation is not complete. Thus, breed-specific discrimination was weaker in this less experimentally controlled study.
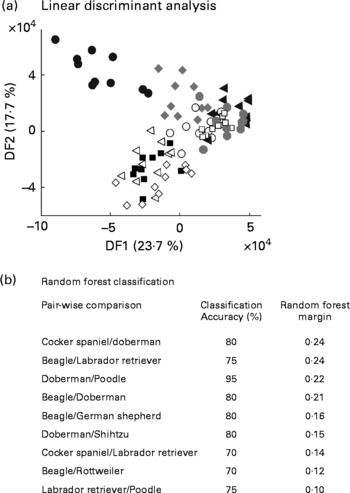
Fig. 7 Discrimination of male dogs by breed using FIE-MS fingerprinting. (a) Linear discriminant analysis scores plot of nine dog breeds (DF1 × DF2). (b) Summary of Random Forest performance (classification – accuracy and model margin) in pairwise comparison of urines from selected dog breeds using flow injection electrospray MS fingerprint data. Key: Breed (size): ◂, Doberman (L); ○, Rottweiler (L); ![]() , Labrador retriver (L); □, German sheperd (L); ■, Poodle (M); ◃, Shih tzu (S); ●, Beagle (M); ⋄, Cocker spaniel (M);
, Labrador retriver (L); □, German sheperd (L); ■, Poodle (M); ◃, Shih tzu (S); ●, Beagle (M); ⋄, Cocker spaniel (M); ![]() , Golden retriver (L); where, S, small; M, medium; L, large.
, Golden retriver (L); where, S, small; M, medium; L, large.
We have shown previously that pairwise comparison of FIE-MS fingerprints by RF is a powerful way to classify different genotype classes in plant populations(Reference Enot, Beckmann and Overy35). Both classification accuracy and the model margin were thus calculated for all possible pairwise combinations of breeds (Fig. 7(b)). A stratified cross-validation method was adapted to test modelling accuracies. Several pairwise comparisons have >70 % correct predictions but have differing margin estimates, which suggested that over-optimistic models were being generated. However, some pairwise comparisons have RF margins close to the threshold of an adequate model (0·2)(Reference Enot, Lin and Beckmann38) suggesting that breed-specific differences in urine metabolome do exist.
Discussion
Obtaining biofluid samples such as urine or blood from domesticated animals demands that strict, ethically acceptable, procedures are followed and often require habituation of animals and intensive carer resource. Such stringent requirements naturally limit the number of sample replicates that can be obtained, which can be a major problem for ‘omic’ level studies(Reference Somorjai, Dolenko and Baumgartner42, Reference Berrar, Bradbury and Dubitzky43). The present work demonstrates that, despite such limitations on replication (in addition to the normal variability of urine as a homoeostatic fluid), the metabolite composition of fasted (>20 h) ‘spot’ urine samples from two domestic dog breeds is consistent enough to allow successful classification based on metabolome fingerprint data. Using Labrador retrievers maintained in a simulated domestic setting, an experimental design in relation to husbandry, sampling and metabolite analysis was developed, which minimised the effect of external factors on the reproducibility of the metabolite fingerprint. With adequate procedures in place, comparison of the urinary chemical fingerprints of Labrador retrievers and miniature Schnauzers fed an identical diet suggested distinct, major differences centred largely on the metabolism of diet-related polyphenols. These data confirm the findings of a NMR study using identical samples(Reference Viant, Ludwig and Rhodes19). Although breed discrimination was relatively accurate, it proved more difficult to correctly predict sex.
Preliminary examination of the urinary metabolome of young male dogs representative of a wider range of breeds from animals maintained under domestic conditions on unknown diets provided evidence that some breeds may have distinctive metabolic differences. For example, the present limited data revealed Beagle urine to be significantly different in composition from that of other breeds investigated, suggesting potentially distinctive interactions with diet. Furthermore, when breeds are designated as either small, medium or large in stature (see key in Fig. 7(a)), it is apparent that large breeds can be separated out from breeds of other sizes (Fig. 7(b)). Urine-specific gravity is higher, but frequency of urination and daily average urine output volumes are lower in miniature Schnauzers compared to Labrador retrievers(Reference Stevenson and Markwell44), which may account for the fact that urea signals in FIE-MS were highly significant discriminatory signals between the two breeds. When considering a urine collection strategy, it may be beneficial to take into account, particularly any behavioural differences between breeds. Small breeds of dog generally have more concentrated urine and many are more prone to Ca stone formation in comparison to large breeds(Reference Stevenson, Hynds and Markwell45). Urinary citric acid levels have long been viewed as a marker of renal metabolism(Reference Simpson46) and have been correlated to net absorption of alkali in the genitourinary tract, which is reduced in animals at risk of forming Ca stones(Reference Stevenson, Hynds and Markwell45, Reference Hess, Michel and Takkinen47).
The demonstration that non-targeted metabolite profiling identified expected differences in citrate levels among breeds is an indication of the comprehensiveness of this ‘first-pass’ analysis method. However, this last observation does raise issues of data interpretability when dealing with semi-quantitative measurements. The data are presented as relative intensities (TIC ratio) and not as absolute amounts. Furthermore, FIE-MS data may be affected by ion suppression or enrichment within the urine matrix. So while citrate may be a significant peak in discriminating between the two breeds, it is not possible to conclude that there is a higher concentration of citrate in miniature Schnauzer urine in comparison to Labrador retriever without further quantitative analyses. The intensity value shown also provides no evidence of a biologically significant effect on maintaining genitourinary tract health. As such, while the observation is useful for hypothesis generation, data should be interpreted with caution.
From a practical perspective, the first-pass analysis of urine by FIE-MS fingerprinting was simple and rapid, producing information-rich data with high potential for further interpretation(Reference Beckmann, Parker and Enot25, Reference Enot, Beckmann and Overy35, Reference Overy, Enot and Tailliart37). A parallel study on the same urine samples using NMR fingerprinting revealed ten metabolites that differed in concentration between Labrador retrievers and miniature Schnauzers(Reference Viant, Ludwig and Rhodes19), but of these signals only citrate and hippurate were structurally assigned. The discriminatory power of these metabolites was indeed confirmed in the present study, along with a much larger number of ‘explanatory’ signals representing metabolites associated with several areas of metabolism. It is concluded that an approach based on MS complements metabolic fingerprinting by NMR, but additionally, by its increased sensitivity and opportunity for direct metabolite putative annotations based on m/z value(Reference Overy, Enot and Tailliart37) offers increased scope for data modelling and interpretation before any deeper analysis by more targeted analytical methods.
Large differences in the levels of phenolic metabolites in urine were a major discriminatory feature in the specific comparison of Labrador retrievers and miniature Schnauzers. The most intense discriminatory phenolic metabolite peak in urine was associated with m-coumarate, which is likely to have its origin in the microbial breakdown of dietary chlorogenic acid, an abundant hydroxycinnamic acid found in a large variety of fruits and vegetables(Reference Gonthier, Cheynier and Donovan48). Similarly, the presence of elevated levels of 3-hydroxyphenylpropanoic acid in mammalian urine is commonly associated with degradation of dietary flavonoids (such as the anthocyanins, pelargonidin and cyanidin) and condensed tannins by the gut microflora(Reference Gonthier, Cheynier and Donovan48, Reference Deprez, Brezillon and Rabot49). 3-Hydroxybenzoic acid in the urine is likely the product of further endogenous β-oxidation of 3-hydroxyphenylpropanoic acid(Reference Gonthier, Verny and Besson50). Benzoic acid, derived from both endogenous and gut microflora metabolism of dietary phenolics, is rapidly conjugated with glycine to produce hippuric acid(Reference Gonthier, Verny and Besson50).
There has been considerable literature advocating the potential beneficial effects on human health of dietary polyphenols with antioxidant properties, such as flavonoids(Reference Scalbert, Manach and Morand51). Bioavailability of phenolics with desirable antioxidant properties may depend on the balance between absorption by intestinal epithelial mono-carboxylic acid transporters and metabolism by the gut microflora(Reference Gonthier, Verny and Besson50, Reference Fardet, Llorach and Orsoni52). As illustrated in Fig. 5, the first steps in the degradation of dietary phenolics in the present study are likely to be the result of colonic microbial activity, which suggests that precursor molecules must be entering the large intestine in both breeds. Thus, the differences in concentration of phenolic breakdown products in urine could result from a more efficient absorption of intact dietary flavonoids and cinnamates into the blood stream in the upper gastrointestinal tract in miniature Schnauzers, as reported previously for chlorogenate in rats and human subjects(Reference Lafay, Gil-Izquierdo and Manach53). Alternatively, the presence of much higher levels of phenolics in urine from Labrador retrievers suggests either a more efficient catabolism of diet-derived flavonoids and cinnamates by the colonic microflora or differential absorption in the colon. Whole grain wheat and maize, rice and sugarbeet pulp, together with bran derived from both maize and soya, comprise a large proportion of the raw ingredients used in the manufacture of the commercial dog foods used in the present study. As whole grains cereals and bran products contain high levels of polyphenols and are rich in cinnamates, coumarates, chlorogenate, caffeic acid and ferulate(Reference Fardet, Llorach and Orsoni52, Reference Kim, Tsao and Yang54), then it is possible that the differential utilisation of these potentially ‘bioactive’ plant secondary metabolites might have implications for animal health(Reference Blaut and Clavel16) and thus commercial pet foods optimised for individual breeds, in some instances, may prove beneficial(Reference Swanson, Schook and Fahey7).
The major contribution of phenolic signals discriminating miniature Schnauzers and Labrador retrievers in classification models based on FIE-MS data was confirmed independently by GC-MS analysis. In addition to animal carcass meal, a significant component of commercial pet foods is derived from complex fat-based by-products, including liquid poultry fat, beef tallow and vegetable oils(Reference Nguyen, Dumon and Biourge55) together, with pure compounds such as glycerol that are used as moisture stabilisers(Reference Warmbier, Schnickels and Labuza56). Although differences in the levels of organic acids derived from butyric acid were more associated with sex, it is possible that the non-targeted profiling GC-MS methodology in the present study did not adequately cover all classes of organic acids and fatty acids. Indeed, a previous NMR study suggested that metabolites related to 2-hydroxybutyrate may differ in urines from these two breeds(Reference Viant, Ludwig and Rhodes19), and the present GC-MS data highlighted at least one further unknown organic acid as discriminatory. Thus, further differences in fatty acid metabolism as tentatively suggested by FIE-MS fingerprinting, particularly relating to butyrate derivatives or carnitine derivatives of larger fatty acids, may be significant between breeds. Related to this possibility, GC-MS analysis also revealed much higher levels of glycerol in urine derived from miniature Schnauzers. As diet-derived glycerol is a rich energy source, it would be surprising if this compound was excreted unless supply is greatly in excess of need, and so this observation, together with possible differences in fatty acid excretion, may be worthy of further investigation. The levels of the trisaccharides raffinose and kestose followed the same trend as glycerol, being present at substantially higher levels in miniature Schnauzers. Raffinose and kestose represent part of the indigestible ‘soluble fibre’ components of animal diets that are only degraded by microbial activity in the lower gastrointestinal tract. Thus, excretion of these trisaccharides may again reflect stable and substantial differences in the microbial populations within the gastrointestinal tract of these two breeds(Reference Rastall57–Reference Suchodolski, Ruaux and Steiner59). This hypothesis is supported by research characterising the canine gut microbiome (C. Wallis, unpublished results). In that study, bacterial populations in faecal samples from different breeds have been shown to differ in the proportion of the major phyla identified. As inulin-type metabolite prebiotics are now part of specialist commercial animal feeds available on the market(Reference Verdonk, Shim and van Leeuwen60, Reference Strickling, Harmon and Dawson61), then knowledge relating to such potential breed-specific differences may prove important to optimise diets and improve health.
It is concluded that substantial potential exists to investigate differences in nutrition-related metabolism by urine metabolite fingerprinting, especially if the animals can be maintained on the same diet before sampling, similar to human studies(Reference Walsh, Brennan and Pujos-Guillot31). Such information could be valuable for developing diets designed to suit classes of dog breeds(Reference Swanson, Schook and Fahey7, Reference Viant, Ludwig and Rhodes19, Reference Suchodolski, Ruaux and Steiner59).
Acknowledgements
The authors state that there are no conflicts of interest. We thank Emily Duval for technical support and FIE-MS analysis, and Robert Darby for maintenance of laboratory infrastructure. We thank colleagues at the WALTHAM Centre for Pet Nutrition involved in the care of the dogs. M. B. was supported jointly by a Research Councils UK Fellowship and Aberystwyth University. Analytical chemistry and data analysis were carried out in the Aberystwyth High Resolution Metabolomics Laboratory funded by the WALTHAM Centre for Pet Nutrition. M. B. designed and supervised the analytical chemistry aspects of the research, contributed to overall experimental design and co-wrote the paper. P. G. J. led the US veterinary clinic study. D. P. E. analysed metabolomics data and D. P. O. investigated metabolite signal annotations using the ARMeC database. I. M. S. contributed to overall experimental design, data analysis and interpretation and edited the manuscript. D. A. designed and coordinated animal sampling in the Waltham Centre for Pet Nutrition, contributed to biological interpretation of metabolome models and co-wrote the paper. J. D. coordinated activity between Aberystwyth university researchers and WALTHAM Centre for Pet Nutrition, led biological interpretation of metabolome models and co-wrote the paper.


