


Classical symptoms of vitamin D deficiency are associated with rickets in growing animals and children and with osteomalacia in adults( 1 – Reference DeLuca 3 ); however, the prolonged effects of maternal dietary vitamin D3 (D) on neonatal and adolescent development are less characterised. Even less characterised are the relationships and interactions between maternal and offspring dietary inputs, specifically D, Ca and P. The implications of vitamin D deficiency during pregnancy on fetal, neonatal and adolescent outcomes are of growing concern in humans( Reference Liu and Hewison 4 , Reference Dror and Allen 5 ). Mahon et al.( Reference Mahon, Harvey and Crozier 6 ) concluded that fetal femur development is correlated with maternal vitamin D status and that changes could be detected by week 19 of gestation. Hatun et al.( Reference Hatun, Ozkan and Orbak 7 ) concluded that infants at the greatest risk for rickets were those born to mothers with poor vitamin D stores. In a longer-term observational study, Javaid et al.( Reference Javaid, Crozier and Harvey 8 ) followed-up children born to mothers whose body type, nutrition and vitamin D status had been characterised during pregnancy. Reduced serum 25-OHD3 status during late pregnancy was associated with reduced whole-body and lumbar bone mineral content (BMC) at 9 years of age. These studies and other human studies, which focus on understanding the relationships of D during pregnancy with offspring outcomes, were based on observational epidemiological studies( Reference Liu and Hewison 4 , Reference Kovacs 9 ). Major limitations of these studies include confounding effects such as maternal ethnicity, weight gain during pregnancy and season of pregnancy, which lead to discrepancies in interpretations among studies( Reference Dror and Allen 5 ). Experiments in an animal model such as swine allow control of the confounding variables, which limit studies with humans.
Investigations into an unexplained incidence of kyphosis, an idiopathic disease characterised by abnormal outward spinal curvature, in the University of Wisconsin Swine Research and Teaching Center (SRTC) herd led to implications of a D deficiency that involved maternal diets( Reference Rortvedt and Crenshaw 10 ). In the previous experiment, 20–30 % of 9-week-old pigs displayed visual evidence of kyphosis if born from sows fed diets with no or marginal additions of supplemental D during gestation and lactation and if the pigs were fed diets low in D, Ca and P during a nursery growth period. Classical signs of rickets were not evident in these pigs, but lesions in the spinal column and femur growth plates were observed.
Studies that have investigated the effects of maternal vitamin D status on offspring vitamin D status, as measured by serum 25-OHD3 levels, reveal a close relationship( Reference Goff, Horst and Littledike 11 , Reference Halloran, Barthell and DeLuca 12 ). The inferences from these studies were based on injections or mega-doses of vitamin D rather than physiologically relevant dietary D supplements to maternal diets. Most of the studies focused on offspring responses at birth or at weaning and did not report animal responses at later stages of growth. To our knowledge, a few, if any, studies have investigated the relationships and interactions between maternal and offspring dietary inputs of D, Ca and P. Knowledge of maternal dietary influences on bone and soft tissue growth in offspring challenged with marginal nutritional deficiencies of D, Ca and P during neonatal and later growth stages would provide a foundation for recommendations of nutritional supplements in maternal diets, which would benefit animals and humans.
Limited evidence from controlled experiments is available to characterise the interaction between maternal dietary D during gestation and lactation and subsequent bone and soft tissue responses in offspring. Results from our earlier studies have provided evidence that dietary D deficits during gestation and lactation had carry-over effects on neonatal pig growth and bone integrity( Reference Rortvedt and Crenshaw 10 ). The ability to nutritionally induce bone abnormalities under controlled experimental conditions provides a unique opportunity to further understand the role of D, Ca and P in pig bone development that could be applied to other domesticated animal species and humans. The current study was designed to assess maternal dietary D carry-over effects on the early stages of skeletal and soft tissue characteristics in the neonatal pig and to assess molecular characteristics in these tissues that may mediate the responses. The experiment was completed in the early neonatal and growth periods before visual evidence of kyphosis would be expected. Thus, no effort was made in this experiment to assess the incidence of kyphosis.
Methods
Ethics statement
All animal procedures were approved (protocol A00865) by the College of Agricultural and Life Sciences Animal Care and Use Committee, University of Wisconsin-Madison. Animals selected for tissue collections were humanely euthanised by electrical stunning followed by exsanguination.
Experimental design and maternal diets
The current experiment was designed to assess the effects of maternal dietary D concentrations on subsequent growth and bone traits in neonatal and young growing pigs. An overview of the experimental design that involved gestation, lactation and nursery phases is outlined in Fig. 1. Cross-bred (PIC Large White×Landrace), first-parity sows (n 22) were bred by artificial insemination with semen collected from an individual Line 19 boar (PIC Inc.). All sows and the boar were housed at the SRTC throughout the trial. At breeding, sows were randomly assigned (six, seven and nine sows per treatment, respectively) to one of three dietary treatments that varied in D supplementation to provide either 0, 8·125 or 43·750µg vitamin D3/kg diet.
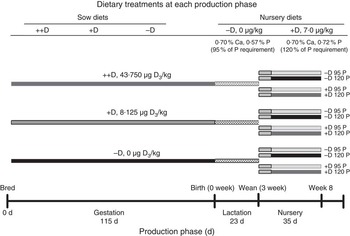
Fig. 1 Timeline of dietary treatments fed to sows during gestation and lactation and diets fed to nursery pigs. Maternal diets were formulated to supply either 0 (−D), 8·125 (+D), or 43·750, (++D) µg vitamin D3/kg diet in complete diets fed from breeding through the lactation phase. Nursery diets were formulated to supply either 0 µg vitamin D3/kg (−D) or 7·0µg vitamin D3/kg (+D) and either 95 % (95P) or 120 % of the P requirement (120P) for 10–20 kg pigs. Pigs were fed an adjustment diet during the 1st week of nursery, which was consistent with routine diets fed to the herd (whey, maize, soyabean meal and oat groats), except that the diet contained no supplemental vitamin D.
Serum and milk samples were collected from sows and pigs during the experiment, but were discarded because of a freezer malfunction. Therefore, serum and milk analysis were not possible.
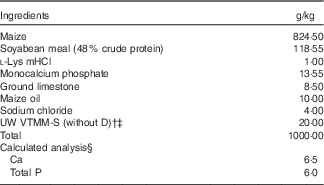
The gestation and lactation diets routinely fed to sows at the SRTC were used with the exception of D concentrations (Table 1). Routine SRTC diets are formulated to provide 8·125µg D3/kg diet from supplemental D additions to the vitamin premix. This routine supplementation slightly exceeds the 5.0µg D3/kg minimum recommendation( 13 ). In this experiment, D was omitted from the standard vitamin premix and added separately during diet mixing to provide either 0 (−D), 8·125 (+D) or 43·750 (++D) µg vitamin D3/kg diet. These levels represent a negative control, the standard SRTC level and a level that is more consistent with concentrations fed to sows in the commercial swine industry, respectively.
Table 1 Ingredients and nutrient composition of the maternal gestation and lactation diet (as-fed basis)Footnote *
NRC, National Research Council.
* Diet formulations were based on the standard gestation and lactation diets routinely used at the UW Swine Research and Teaching Center with the exception of the use of maize oil v. Max-Fat (a blend of animal and vegetable fats; Maxco Inc.) and the inclusion of vitamin D. Sows were fed 2·2 kg/d during gestation and allowed continuous access to feed during lactation.
† The University of Wisconsin vitamin trace mineral mix-sow (UW VTMM-S), without D is a custom-mixed vitamin–trace mineral premix for gestation and lactation without vitamin D. The premix provided the following nutrients (mg/kg diet): retinol, 1680; cholecalciferol, 0 (see footnote ‡); dl-α-tocopherol, 54; menadione nicotinamide bisulphite, 0·75; nicotinamide, 22; biotin, 0·40; choline, 1350; folic acid, 2·2; pantothenic acid, 24; riboflavin, 11; cyanocobalamin, 0·043; Cu, 4; I, 0·3; Fe, 74; Se, 0·2; Mn, 22; and Zn, 90.
‡ Vitamin D3 was added to UW VTMM-S to supply either 0 (−D), 8·125 (+D) or 43·750 (++D) µg D3/kg complete diet for the +D gestation and lactation diets (1 IU of vitamin D3 is defined as the biological activity of 0·025 µg cholecalciferol) but was omitted in the −D diets.
§ Calculated analysis based on nutrient composition of feed ingredients in NRC( 13 ). Analysed values averaged across diet mixes were as follows: 6·5 g Ca/kg diet; 6·0 g P/kg diet; 2·975, 10·375 and 40·500µg D3/kg for –D, +D and ++D diets, respectively. Calculated standardised total tract digestible PO4 was 3·7 g P/kg diet based on NRC( 26 ).
The assigned diet was fed (2·2 kg/d) to gestating sows from breeding (0 d) until parturition (Fig. 1). Sows were allowed to farrow naturally, without induction of parturition. At parturition, sows continued within their respective treatment groups, but they were allowed continuous access to feed throughout a 23±2-d lactation period. Sows were allowed continuous access to water throughout the gestation and lactation periods. The SRTC is an environmentally controlled building with no direct sunlight exposure during any stage of the life cycle. Fluorescent lights were controlled to provide cycles of 16 h light–8 h dark during gestation and 12 h light–12 h dark during farrowing and nursery phases.
Nursery diets and housing
Piglets were housed with the sow from birth through the lactation phase and allowed uncontrolled access to the sow for milk consumption. No creep feed was provided for piglets during lactation. Pigs were weaned after a 23±2-d lactation period (3 weeks) and randomly assigned within a litter to one of four nursery treatment groups (Fig. 1). Pigs were fed an adjustment diet with no supplemental D for 1 week before being fed treatment diets for 4 weeks. Nursery treatment diets (Table 2) were formulated to supply either 0 (−D) or 7·0 (+D) µg vitamin D3/kg, each with 95 % (95P) or 120 % (120P) of the P requirement for 10–20 kg pigs( 13 ). No phytase was added to nursery diets. Dietary inputs were based on results from previous studies that revealed a stronger association between vitamin D and P than between vitamin D and Ca in the bone characteristics measured( Reference Rortvedt and Crenshaw 10 ). The range in dietary P (95–120 % of requirements) was selected as a range that would not be expected to induce changes in growth or bone traits( 13 , Reference Aiyangar, Crenshaw and Au 14 ). This method allowed exploration of the effects due to slight changes in dietary P fed to pigs produced by sows fed no supplemental D. Final observations and tissue samples were collected from pigs at 58±2 d of age (8 weeks) after a 5-week nursery phase.
Table 2 Ingredients and nutrient composition of nursery diets (as-fed basis)Footnote *
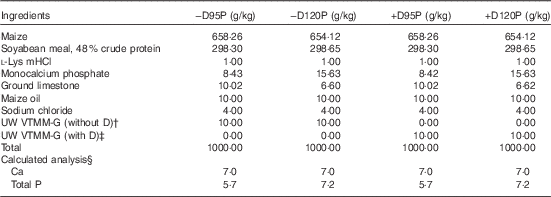
−D95P, 0 µg D3/kg and 95 % of P requirement; −D120P, 0 µg D3/kg and 120 % of P requirement; +D95P, 7·0µg D3/kg and 95 % of P requirement; +D120P, 7·0µg D3/kg and 120 % of P requirement (1 IU of vitamin D3 is defined as the biological activity of 0·025 µg cholecalciferol); NRC, National Research Council.
* Diets were formulated to supply either 0 (−D) or 7·0 (+D) µg vitamin D3/kg each with either 95 % (95P) or 120 % (120P) of the P requirement and 100 % of the Ca requirement for 10–20 kg pigs. The P requirement for 10–20 kg pigs is 6·0 g/kg( 13 ).
† The University of Wisconsin vitamin trace mineral mix-grower (UW VTMM-G) without D is a custom-mixed vitamin–trace mineral premix for growth without vitamin D. The premix provided the following nutrients (mg/kg diet): retinol, 840; cholecalciferol, 0; dl-α-tocopherol, 14; menadione nicotinamide bisulphite, 0·75; nicotinamide, 22; pantothenic acid, 12; riboflavin, 8; cyanocobalamin, 0·033; Cu, 1·5; I, 0·3; Fe, 38; Se, 0·2; and Zn, 90.
‡ The UW VTMM-G with D provided the same nutrients per kg of diet as indicated in footnote Footnote † with the exception of the addition of vitamin D3, 7·0µg.
§ Calculated analysis based on nutrient composition of feed ingredients in NRC( 13 ). Analysed values for one diet mix were as follows: 6·0 g Ca/kg; 4·8 and 6·5 g P/kg for 95P and 120P diets, respectively; 0·35 and 7·45µg D3/kg diet for –D and +D diets, respectively. Calculated standardised total tract digestible PO4 was 0·32 and 0·45 g P/kg diet for 95P and 120P diets, respectively, based on NRC( 26 ).
At weaning, pigs (two, three or four pigs per pen) were removed from the lactating sows and housed in nursery pens (1·4×2·4 m) for 5 weeks (nursery phase). Pigs were allowed ad libitum access to their assigned dietary treatments and water throughout the nursery phase. Body weight (BW) was recorded at birth (0 week), 3 weeks and weekly during the 5-week nursery period.
Whole body and femur dual-energy X-ray absorptiometry scans
At 0 week (n 23), 3 weeks (n 22) and 8 weeks (n 185), pigs were selected for whole-body dual-energy X-ray absorptiometry (DXA) scans and tissue collection. Selected pigs were euthanised before scans to facilitate tissue collection. The entire pig was scanned in a ventral position using DXA (software version 12.20; GE Lunar Prodigy) while in rigour. Selected DXA scan modes were based on pig BW as described earlier( Reference Rortvedt and Crenshaw 10 ) to optimise the accuracy of whole-body BMC. In this experiment, two scan modes were used (<20 kg, small animal mode; 20 to 46 kg, adult standard mode) to determine BMC (grams of bone ash per pig) and bone mineral density (BMD; grams of bone ash per square centimetre of skeletal tissue). The BMC values reflect the amount of ash in the entire skeleton, and BMD values reflect an adjustment in BMC for the size (area) of skeletal tissue. After whole-body DXA scans, femurs were excised and subsequently scanned using DXA (small animal scan mode) to determine femur BMC and BMD. Femurs were sealed in plastic bags and stored at −20°C until mechanical test procedures were completed.
Geometrical and mechanical test of femurs
Mechanical tests of femurs were completed as described earlier( Reference Rortvedt and Crenshaw 10 ). Excised femurs from pigs euthanised at 0 and 3 weeks were tested using a three-point bending test. Excised femurs from pigs euthanised at 8 weeks were tested using a four-point bending test. Before the mechanical test, the femurs were scanned using a computed tomography scanner (GE Lightspeed 16; GE Medical System) to determine the cross-sectional moment of inertia (MOI) as described earlier( Reference Aiyangar, Crenshaw and Au 14 ). Data from the load deformation curves and MOI results were used to calculate the bone mechanical properties as previously defined( Reference Crenshaw, Peo and Lewis 15 ).
Quantitative real-time PCR
Sections of the kidney (cortex), intestine (duodenum) and bone (right metatarsal) tissue were collected immediately upon euthanasia of each pig, frozen in liquid N2 and stored at −80°C until quantitative PCR (qPCR) analysis. The RNA isolation and qPCR analyses of bone, kidney and intestinal tissue samples were completed as described previously(
Reference Laporta, Peters and Merriman
16
) with a few modifications. Hypoxanthine phosphoribosyltransferase 1 (HPRT1) was used as the reference gene for kidney and intestinal tissues. A geometrical average of ribosomal protein S15 and ribosomal protein S18 was used as the reference gene for bone tissue. These reference genes were verified to be stably expressed across treatments within their respective tissues. The qPCR data were analysed using the
 $$2^{{{\minus}\Delta \Delta C_{t} }} $$
method(
Reference Schmittgen and Livak
17
), with the pigs produced by sows fed –D diets serving as the control for samples at 0 and 3 weeks and the pigs produced by sows fed –D diets and –D95P nursery diets serving as the control for samples at 8 weeks. The genes of interest associated with vitamin D, Ca and P homoeostasis were 1-α hydroxylase (CYP27B1), 24-hydroxylase (CYP24A1), the vitamin D receptor (VDR), transient receptor potential cation channel subfamily V member 6 (TRPV6) and fibroblast growth factor 23 (FGF23). The genes of interest associated with bone metabolism were receptor activator of NF-κB ligand (RANKL), osteocalcin (OCN) and osteoprotegerin (OPG). The primer sequences are listed in Table 3. Primer sequences were designed using Primer3 program based on gene sequences obtained from the National Center for Biotechnology Information except for VDR
(
Reference Hittmeier, Grapes and Lensing
18
) and HPRT1
(
Reference Nygard, Jorgensen and Cirera
19
). The purity of RNA isolates was confirmed by spectrophotometric analysis with a NanoDrop 2000c Spectrophotometer (Thermo Fisher Scientific).
$$2^{{{\minus}\Delta \Delta C_{t} }} $$
method(
Reference Schmittgen and Livak
17
), with the pigs produced by sows fed –D diets serving as the control for samples at 0 and 3 weeks and the pigs produced by sows fed –D diets and –D95P nursery diets serving as the control for samples at 8 weeks. The genes of interest associated with vitamin D, Ca and P homoeostasis were 1-α hydroxylase (CYP27B1), 24-hydroxylase (CYP24A1), the vitamin D receptor (VDR), transient receptor potential cation channel subfamily V member 6 (TRPV6) and fibroblast growth factor 23 (FGF23). The genes of interest associated with bone metabolism were receptor activator of NF-κB ligand (RANKL), osteocalcin (OCN) and osteoprotegerin (OPG). The primer sequences are listed in Table 3. Primer sequences were designed using Primer3 program based on gene sequences obtained from the National Center for Biotechnology Information except for VDR
(
Reference Hittmeier, Grapes and Lensing
18
) and HPRT1
(
Reference Nygard, Jorgensen and Cirera
19
). The purity of RNA isolates was confirmed by spectrophotometric analysis with a NanoDrop 2000c Spectrophotometer (Thermo Fisher Scientific).
Table 3 Primer sequences for housekeeping genes and genes of interest for quantification by real-time quantitative PCR (qPCR)Footnote *
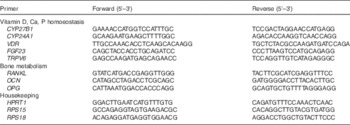
CYP27B1, 1-α hydroxylase; CYP24A1, 24-hydroxylase; VDR, vitamin D receptor; FGF23, fibroblast growth factor 23; TRPV6, transient receptor potential cation channel subfamily V member 6; RANKL, receptor activator of NF-κB ligand; OCN, osteocalcin; OPG, osteoprotegerin; HPRT1, hypoxanthine phosphoribosyltransferase 1; RPS15, ribosomal protein S15; RPS18, ribosomal protein S18.
* Forward and reverse sequences for primers used to analyse mRNA content using qPCR.
Statistical analysis
Data were analysed by regression analysis using mixed models, general linear models and rank procedures (for discrete variables generated by qPCR assays if data were not normally distributed) using SAS version 9.2 (SAS Inst. Inc.). Analysis of data collected from pigs at 0 and 3 weeks involved a randomised block design. Analysis of data from samples collected from pigs at 8 weeks involved a nested design in which nursery treatment groups (−D95P, −D120P, +D95P, +D120P) were nested within maternal treatment groups (−D, +D, ++D). The nested design was analysed as a 3×4 factorial design to allow evaluation of pig responses to the main effects of the three maternal diets, four nursery diets and the interaction of maternal diets×nursery diets. Even though maternal diets were fed to sows, the sow responses to the diets were not evaluated in this experiment. Therefore, the individual pig was considered as the experimental unit. Only response criteria measured on individual pigs were considered. Differences due to pig sex were not considered in the analysis. Results are reported as the average of pigs within a treatment group. Inferences among treatment groups were based on orthogonal contrasts used to identify the main effects attributed to variation among maternal diets (−D v. +D, ++D and +D v. ++D), effects due to nursery diets (D effect (−D v. +D), P effect (95P v. 120P) or the interaction between P×D) and effects due to the interaction between maternal and nursery diets. Significance was considered at P<0·05 and trends at P<0·15. Results are reported as the average values for each trait within 3 (birth and weaning) or 12 (8 weeks) dietary treatment groups with a pooled standard error of the means. The standard error of the mean was calculated by dividing the root mean square of the random error term in the regression model by the square root of the number of observations within treatment groups.
Results
One sow from the +D treatment group and her litter were removed from the study midway through lactation because of lack of milk production. No other unexplained deaths or early terminations occurred over the study period.
Litter size responses
This study was not designed to evaluate reproductive traits because of the limited number of sows; however, litter traits were reported as an observational assessment of the animal performance standards. Differences were not detected in the number of live births, still births, mummified fetuses or total births (defined as live births plus still births) among the three maternal dietary treatments (Table 4). The average number of live births (14·3, sem=0·72) was a respectable average for first parity females compared with current commercial swine industry standards.
Table 4 Effect of maternal diet on litter size, birth weight and weaning weightFootnote *
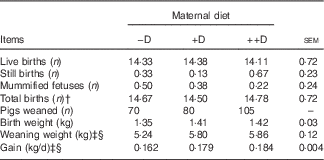
−D, 0; +D, 8·125; or ++D, 43·750µg vitamin D3/kg (1 IU of vitamin D3 is defined as the biological activity of 0·025 µg cholecalciferol).
* Live births, still births, mummified fetuses and total births were counted at farrowing. Values are averages from six, eight and nine sows per treatment, respectively, with their pooled standard errors. Birth (0 week) weight and weaning (3 weeks) weight are averages based on individual values from all pigs. Gain was calculated from weight gained (kg/d) between 0 and 3 weeks divided by the actual days from birth to weaning for each litter.
† Total births equal the number of live births plus the number of still births.
‡ Difference due to maternal treatment (P<0·05).
§ Maternal treatment −D v. +D and ++D differ (P<0·05).
Growth responses
Differences in pig BW at 0 week (Table 4) were not detected, indicating that maternal gestation diet did not influence fetal growth. Differences were detected in BW at 3 weeks and BW gain from 0 to 3 weeks (P<0·05). At 3 weeks, pigs of –D sows had a 10 % reduction in BW and an 11 % reduction in gain compared with pigs of +D and ++D sows, but no differences were detected between pigs of +D and ++D sows. Therefore, the lack of supplemental D in maternal diets fed during gestation and lactation decreased weaning weight and gain from birth to weaning. Because of the study design, whether this response was attributed to direct effects on the piglet growth imposed during gestation, maternal milk nutrient composition or the quantity of milk provided or a combination of these effects cannot be discerned. However, excess D (++D) during gestation and lactation did not further increase pig weight or gain above that of pigs produced by sows fed marginal D (+D).
Differences due to nursery dietary treatment (P<0·05) were detected in BW gain during the 35-d nursery period (Table 5). Pooled across maternal dietary treatments, pigs fed –D nursery diets had an 11 % reduction in BW gain from 3 to 8 weeks. Differences due to vitamin D were not expected over such a short time as fat-soluble vitamins are presumed to have a longer half-life than water-soluble vitamins, and thus require longer periods before deficiencies are induced. Pigs fed 120P diets had increased gain when fed +D diets but decreased gain when fed –D diets (nursery dietary D×P interaction, P<0·05). Therefore, a slight increase in dietary P (120 % of requirement) further compromised growth in pigs fed diets with no supplemental D. No overall maternal dietary effects were detected in BW gain during the nursery period. There was a trend towards significance for a maternal×nursery diet interaction (P=0·13). The nursery dietary D×P interaction previously discussed was evident in pigs produced by –D or +D sows, but not in pigs produced by ++D sows, implying that excess maternal dietary D provided a compensatory or protective response in the absence of nursery dietary D and excess P.
Table 5 Pig body weight (BW) and growth at 8 weeks in response to maternal and nursery dietsFootnote †
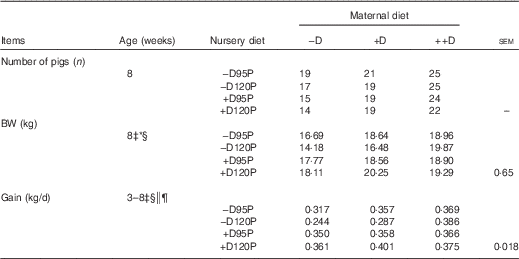
−D, 0; +D, 8·125; or ++D, 43·750µg vitamin D3/kg (1 IU of vitamin D3 is defined as the biological activity of 0·025 µg cholecalciferol); −D95P, 0 µg D3/kg and 95 % of P requirement; −D120P, 0 µg D3/kg and 120 % of P requirement; +D95P, 7·0µg D3/kg and 95 % of P requirement; +D120P, 7·0µg D3/kg and 120 % of P requirement.
* P<0·15.
† BW values are based on pen averages, with their pooled standard errors. Gain was calculated from the weight gained (kg/d) between 3 and 8 weeks and is based on pen averages.
‡ Difference due to nursery treatment (P<0·05).
§ Nursery treatment vitamin D effect (P<0·05).
|| Nursery treatment P×vitamin D interaction (P<0·05).
¶ Interaction between maternal and nursery treatments (P<0·15).
Whole-body dual-energy X-ray absorptiometry responses
Whole-body DXA scans are commonly used to predict the risk of osteoporosis in humans. In pigs, whole-body DXA scans were used to detect recovery of skeletal bone mineral after periods of dietary Ca and P deficits( Reference Aiyangar, Crenshaw and Au 14 ). In the current study, differences in both whole-body BMC and BMD were detected among dietary treatment groups. As dietary treatments induced differences in pig BW as previously discussed, BMD, which corrects for the area of skeletal tissue, provides a trait that allowed comparisons among pigs that differed in BW. Differences in whole-body BMC and BMD responses (Table 6) were not detected at 0 or 3 weeks, indicating that maternal diets during gestation and lactation did not influence the amount of skeletal ash at these ages.
Table 6 Whole body skeletal mineralisation of pigs at 0, 3 and 8 weeks in response to maternal and nursery diets (Values are averages of six to nine pigs per treatment at 0 weeks (birth) and 3 weeks (weaning) and twelve to eighteen pigs per treatment at 8 weeks with their pooled standard errors)
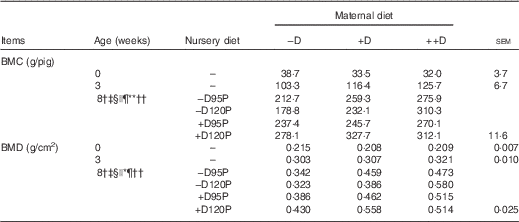
−D, 0; +D, 8·125; or ++D, 43·750µg vitamin D3/kg (1 IU of vitamin D3 is defined as the biological activity of 0·025 µg cholecalciferol); −D95P, 0 µg D3/kg and 95 % of P requirement; −D120P, 0 µg D3/kg and 120 % of P requirement; +D95P, 7·0µg D3/kg and 95 % of P requirement; +D120P, 7·0µg D3/kg and 120 % of P requirement; BMC, bone mineral content; BMD, bone mineral density.
† Difference due to maternal treatment (P<0·05).
‡ Maternal treatments −D v. +D and ++D differ (P<0·05).
§ Difference due to nursery treatment (P<0·05).
|| Nursery treatment P effect (P<0·05 and * P<0·15).
¶ Nursery treatment vitamin D effect (P<0·05).
** Nursery treatment P×vitamin D interaction (P<0·05).
†† Interaction between maternal and nursery treatments (P<0·05).
Differences due to maternal diet were unexpectedly detected (P<0·05) in whole-body BMC and BMD at the end of the nursery period (Table 6). Pooled across nursery treatments, pigs produced by –D sows had a 19 % reduction in BMC and a 25 % reduction in BMD compared with pigs produced by +D and ++D sows, but no differences were detected between pigs produced by +D and ++D sows. These differences were not expected as no maternal diet effects were detected at birth or weaning. Evidence that the maternal diet continued to affect skeletal mineralisation responses of pigs at the end of the nursery period, regardless of nursery dietary treatment, implies the maternal influence was present in the young pig, but responses were either not expressed or were not detectable by gross, densitometry measures in pigs at birth and weaning. Differences in pig whole-body BMC and BMD due to nursery treatments were detected; however, the differences were dependent upon maternal dietary treatment (maternal×nursery diet interaction, P<0·05). Pigs fed –D120P diets had reduced BMC and BMD if produced by –D or +D sows, but increased BMC and BMD if produced by ++D sows. This response indicates that excess dietary P in pigs produced by sows fed no (−D) or marginal (+D) D did not compensate for the lack of nursery dietary D; rather, the slight excess in dietary P further compromised skeletal mineral accumulation compared with cohorts fed lower-P diets. The interaction between maternal and nursery diets was more evident in skeletal tissue compared with soft tissue growth, as previously discussed. The presence of both an overall maternal dietary influence and an interaction between maternal and nursery diets at the end of the nursery period provided evidence of a carry-over effect due to maternal dietary D concentrations during gestation and lactation on pig whole-body bone mineralisation traits.
Femur traits
The femur was identified as a single bone, compared with fibula and metacarpal or metatarsal bones, which provided a more reliable predictor of whole-body BMC and BMD values of growing pigs( Reference Crenshaw and Rortvedt-Amundson 20 ). Therefore, individual femurs were analysed using DXA procedures to confirm responses detected in the whole-body scans and to allow assessments of bone mechanical properties. Similar responses to maternal and nursery diets were detected in femur BMC and BMD (data not shown) as were presented for whole-body BMC and BMD responses.
Lack of dietary D was expected to compromise femur length. Differences due to maternal dietary treatment in pig femur length (Table 7) were not detected at birth (0 week), but differences were evident at 3 weeks (P<0·05). Pigs produced by –D sows had >5 % reduction in femur length compared with pigs produced by +D and ++D sows. However, no differences were detected between pigs produced by +D and ++D sows, consistent with growth and DXA responses. At the end of the nursery period, differences due to maternal dietary treatment were still detected (P<0·05). Pooled across nursery treatments, a linear increase in femur length across maternal treatments was evident (Table 7). Differences due to nursery dietary treatment were also detected (P<0·05) but were dependent on maternal treatment (maternal×nursery diet interaction, P<0·05). Pigs fed –D120P diets had decreased femur length if produced by –D or +D sows but increased length if produced by ++D sows. These responses are similar to responses observed in growth and DXA traits.
Table 7 Pig femur length and mechanical properties at 0, 3 and 8 weeks in response to maternal and nursery diets (Averages of six to nine pigs per treatment at 0 and 3 weeks and twelve to eighteen pigs per treatment at 8 weeks with their pooled standard errors)
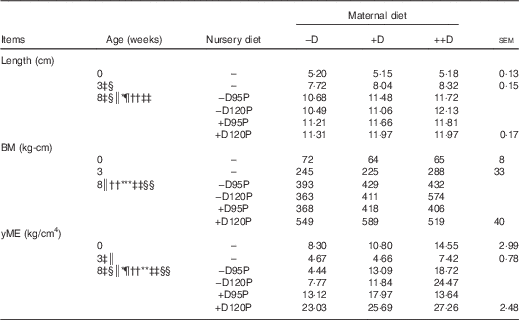
−D, 0; +D, 8·125; or ++D, 43·750µg vitamin D3/kg (1 IU of vitamin D3 is defined as the biological activity of 0·025 µg cholecalciferol); −D95P, 0 µg D3/kg and 95 % of P requirement; −D120P, 0 µg D3/kg and 120 % of P requirement; +D95P, 7·0µg D3/kg and 95 % of P requirement; +D120P, 7·0µg D3/kg and 120 % of P requirement; BM, bending moment; yME, yield modulus of elasticity.
‡ Difference due to maternal treatment (P<0·05).
§ Maternal treatments –D v. +D and ++D differ (P<0·05).
|| Maternal treatments +D v. ++D differ (P<0·05 and * P<0·15).
¶ Difference due to nursery treatment (P<0·05).
** Nursery treatment vitamin D effect (P<0·05 and * P<0·15).
†† Nursery treatment P effect (P<0·05).
‡‡ Interaction between maternal and nursery treatments (P<0·05).
§§ Nursery treatment P×vitamin D interaction (P<0·05).
In our earlier study to assess recovery of whole-body BMC from periods of dietary Ca and P deficiency, the mechanical properties of femurs were recovered, even in pigs that had not fully recovered BMC( Reference Aiyangar, Crenshaw and Au 14 ). Thus, a direct assessment of bone mechanical properties may offer additional insights into responses to dietary inputs on bone integrity. Excised femurs were subjected to a three- or four-point bending test to determine bending moment (BM) and the yield modulus of elasticity (yME) at the yield point of the load deformation curves.
Differences in BM due to maternal dietary treatment were not detected in pig femurs at 0 or 3 weeks. However, at 8 weeks, differences due to nursery dietary treatment were detected (Table 7). Differences in BM were reflective of the differences evident in femur length, although BM is adjusted for the length to which the load is applied during the mechanical test( Reference Crenshaw, Peo and Lewis 15 , Reference Turner and Burr 21 ). Therefore, after correcting for length, differences were still detected in the amount of load withstood by the femur before irreversible damage was invoked. The BM of femurs from pigs fed –D nursery diets tended (P<0·15) to be reduced compared with that of pigs fed +D. Pigs fed 95P diets had reduced (P<0·05) femur BM compared with pigs fed 120P. Consistent with growth and DXA traits, an interaction between maternal and nursery dietary treatments was detected in BM (P<0·05). Pigs fed –D120P had decreased BM if produced by −D or +D sows but increased BM if produced by ++D sows.
The yME provides an assessment of bone strength properties, which include adjustments in the load withstood during the mechanical test for length, the distribution of mass around the centroid (area MOI) of the material tested and an assessment of the stiffness (strain) of the material. With exception to the yME responses of pigs at 3 weeks, the femur responses to dietary treatments were consistent with responses observed in BM, implying that changes were due to the amount of bone, rather than a change in the size and shape, or stiffness of the bone (Table 7). At 3 weeks, the yME of femurs from pigs produced by ++D sows was greater than that of pigs produced by –D or +D sows. No differences were detected in the BM of femurs of pigs at 3 weeks, implying that the overall traits included in the yME parameter reflected the cumulative bone integrity responses to maternal and nursery diets.
Quantitative PCR responses
The mRNA expressions of genes associated with vitamin D, Ca and P homoeostasis (CYP27B1, CYP24A1, VDR, FGF23 and TRPV6) and bone metabolism (RANKL, OCN and OPG) were evaluated in tissues from pigs at 0, 3 and 8 weeks. Analysis of genes in each tissue is represented in Tables 8–10. Figures are also provided for genes of interest with key differences for better visual representation.
Table 8 Pig kidney relative mRNA expressionFootnote * at 0, 3 and 8 weeks in response to maternal and nursery dietsFootnote † (Values are averages of six to nine tissues per treatment with their pooled standard errors)
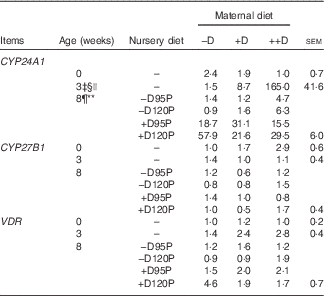
−D, 0; +D, 8·125; or ++D, 43·750µg vitamin D3/kg (1 IU of vitamin D3 is defined as the biological activity of 0·025 µg cholecalciferol); −D95P, 0 µg D3/kg and 95 % of P requirement; −D120P, 0 µg D3/kg and 120 % of P requirement; +D95P, 7·0µg D3/kg and 95 % of P requirement; +D120P, 7·0µg D3/kg and 120 % of P requirement; CYP24A1, 24-hydroxylase; CYP27B1, 1-α hydroxylase; VDR, vitamin D receptor.
* Values reflect averages of the relative fold change compared with the control. The control treatment was pigs produced by sows fed –D at 0 and 3 weeks and pigs produced by sows fed –D and –D95P during the nursery period at 8 weeks. Hypoxanthine phosphoribosyltransferase 1 was used as the housekeeping gene for kidney tissues.
† The data were analysed using the
$$2^{{{\minus}\Delta \Delta C_{t} }} $$
method(
Reference Schmittgen and Livak
17
).
‡ Difference due to maternal treatment (P<0·05).
§ Maternal treatments −D v. +D and ++D differ (P<0·05).
|| Maternal treatments +D v. ++D differ (P<0·05).
¶ Difference due to nursery treatment (P<0·05).
** Nursery treatment vitamin D effect (P<0·05).
Table 9 Pig intestinal relative mRNA expressionFootnote * at 0, 3 and 8 weeks in response to maternal and nursery dietsFootnote † (Values are averages of six to nine tissues per treatment with their pooled standard errors)
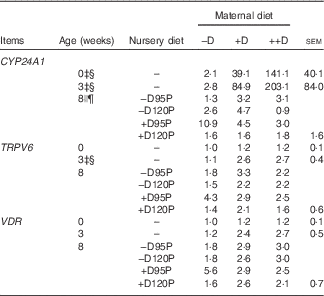
−D, 0; +D, 8·125; or ++D, 43·750µg vitamin D3/kg (1 IU of vitamin D3 is defined as the biological activity of 0·025 µg cholecalciferol); −D95P, 0 µg D3/kg and 95 % of P requirement; −D120P, 0 µg D3/kg and 120 % of P requirement; +D95P, 7·0µg D3/kg and 95 % of P requirement; +D120P, 7·0µg D3/kg and 120 % of P requirement; CYP24A1, 24-hydroxylase; TRPV6, transient receptor potential cation channel subfamily V member 6; VDR, vitamin D receptor.
* Values reflect averages of the relative fold change compared with the control. The control treatment was pigs produced by sows fed –D at 0 and 3 wk and pigs produced by sows fed –D and –D95P during the nursery period at 8 wk. Hypoxanthine phosphoribosyltransferase 1 was used as the housekeeping gene for intestinal tissue.
† The data were analysed using the
$$2^{{{\minus}\Delta \Delta C_{t} }} $$
method(
Reference Schmittgen and Livak
17
).
‡ Difference due to maternal treatment (P<0·05).
§ Maternal treatments −D v. +D and ++D differ (P<0·05).
|| Difference due to nursery treatment (P<0·05).
¶ Nursery treatment P effect (P<0·05).
Table 10 Pig bone relative mRNA expressionFootnote * at 0, 3 and 8 week in response to maternal and nursery diets (Values are averages of six to nine tissues per treatment with their pooled standard errors)
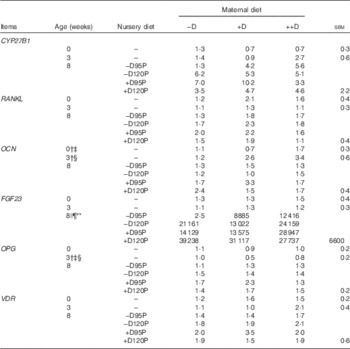
−D, 0; +D, 8·125; or ++D, 43·750µg vitamin D3/kg (1 IU of vitamin D3 is defined as the biological activity of 0·025µg cholecalciferol); −D95P, 0µg D3/kg and 95 % of P requirement; −D120P, 0µg D3/kg and 120 % of P requirement; +D95P, 7·0µg D3/kg and 95 % of P requirement; +D120P, 7·0µg D3/kg and 120 % of P requirement; CYP27B1, 1-α hydroxylase; RANKL, receptor activator of NF-κB ligand; OCN, osteocalcin; FGF23, fibroblast growth factor 23; OPG, osteoprotegerin; VDR, vitamin D receptor.
* Values reflect averages of the relative fold change compared with the control. The control treatment was pigs produced by sows fed –D at 0 and 3 weeks and pigs produced by sows fed –D and –D95P at 8 weeks. The geometrical average of ribosomal protein S15 and ribosomal protein S18 was used as the housekeeping gene for bone tissue.
† Difference due to maternal treatment (P<0·05).
‡ Maternal treatments +D v. ++D differ (P<0·05).
§ Maternal treatments −D v. +D and ++D differ (P<0·05).
|| Difference due to nursery treatment (P<0·05).
¶ Nursery treatment P effect (P<0·05).
** Nursery treatment vitamin D effect (P<0·05).
Kidney mRNA expression of CYP24A1 was up-regulated in pigs produced by sows fed +D or ++D diets (P<0·05) at 3 weeks, inferring a maternal dietary D effect on the degradative capacity of vitamin D by pigs at weaning (Table 8, Fig. 2). Given the current experimental design, the gestation v. lactation stages of dietary exposure to maternal influences cannot be separated, as mentioned in earlier traits. As expected, kidney mRNA expression of CYP24A1 was also up-regulated in pigs fed +D nursery diets at 8 weeks (P<0·05); however, no maternal effect was detected at this age (Table 8, Fig. 2). No differences in kidney mRNA expression of CYP27B1 or VDR were detected at any age, inferring that vitamin D is more tightly regulated at the level of degradation v. activation or receptor availability.
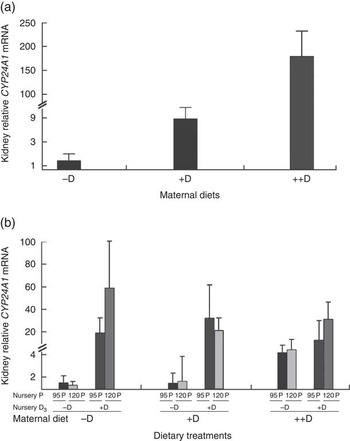
Fig. 2 Effect of maternal and nursery diets on pig kidney mRNA expression of 24-hydroxylase (CYP24A1) at 3 and 8 weeks. Values are averages of the relative fold change compared with the control of six to nine tissues per treatment normalised to hypoxanthine phosphoribosyltransferase 1, with their standard errors. The control at 3 weeks was pigs produced by –D sows and at 8 weeks was pigs produced by −D sows fed −D95P nursery diets. (a) Pigs produced by +D or ++D sows had greater kidney mRNA expression of CYP24A1 (P<0·05) at 3 weeks. (b) Pigs fed +D nursery diets had greater kidney mRNA expression of CYP24A1 (P<0·05) at 8 weeks.
Surprisingly, intestinal mRNA expression of CYP24A1 was also up-regulated in pigs produced by sows fed +D and ++D diets (P<0·05) at 0 and 3 weeks, demonstrating potential regulation of vitamin D metabolism at the intestinal level along with the classical regulation in the kidney (Table 9, Fig. 3). Unexplainably, intestinal mRNA expression of CYP24A1 was also up-regulated in pigs fed 95P nursery diets at 8 weeks (P<0·05). Further characterisation of CYP24A1 in the intestine is necessary in order to verify and understand the current, unexpected results.
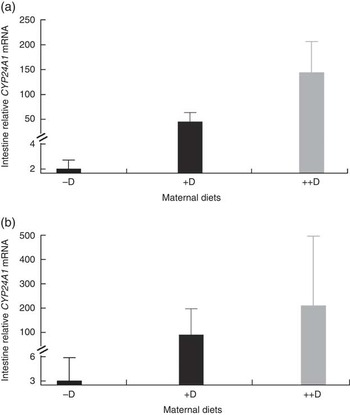
Fig. 3 Effect of maternal diet on pig intestinal mRNA expression of 24-hydroxylase (CYP24A1) at 0 and 3 weeks. Values are averages of the relative fold change compared with the control of six to nine tissues per treatment normalised to hypoxanthine phosphoribosyltransferase 1, with their standard errors. The control at 0 and 3 weeks was pigs produced by −D sows. (a) Pigs produced by +D and ++D sows had greater intestinal mRNA expression of CYP24A1 (P<0·05) at 0 week. (b) Pigs produced by +D and ++D sows had greater intestinal mRNA expression of CYP24A1 (P<0·05) at 3 weeks.
Intestinal mRNA expression of TRPV6 was only up-regulated in pigs produced by +D and ++D sows at 3 weeks (Table 9). Thus, pigs at 3 weeks demonstrated a potential for increased ability to absorb Ca, dependent upon D being present in the sow diet. The response to sow dietary treatment cannot be attributed only to the sow milk as the housing arrangements did not preclude the piglet consumption of sow feed during the lactation period. The up-regulation was not observed in pigs at 0 week. Pig nursery diet did not influence the intestinal mRNA expression of TRPV6. As with the kidney, no differences were detected in the intestinal mRNA expression of VDR at any age.
Bone mRNA expression of OCN was up-regulated in pigs produced by ++D sows compared with pigs produced by –D and +D sows (P<0·05) at 0 weeks and in pigs produced by +D and ++D sows compared with pigs produced by –D sows (P<0·05) at 3 weeks (Table 10, Fig. 4). No differences were detected in OCN expression during the nursery period. Osteocalcin mRNA expression is bone tissue specific and is up-regulated in mineralising bone matrix and in response to active (1,25(OH)2D3) vitamin D( Reference Lian, Stewart and Puchacz 22 ). Thus, our results indicate that at 0 and 3 weeks an increase in maternal dietary D coincides with an increase in bone matrix mineralisation evident at a molecular level, but not at the whole-body mineralisation level as measured by DXA.
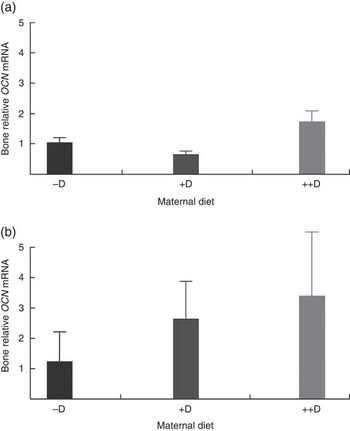
Fig. 4 Effect of maternal diet on pig bone mRNA expression of osteocalcin (OCN) at 0 and 3 weeks. Values are averages of the relative fold change compared with the control of six to nine tissues per treatment normalised to the geometric average of ribosomal protein S15 and S18, with their standard errors. The control at 0 and 3 weeks was pigs produced by −D sows. (a) Pigs produced by ++D sows had greater bone mRNA expression of OCN (P<0·05) at 0 week. (b) Pigs produced by +D and ++D sows had greater bone mRNA expression of OCN (P<0·05) at 3 weeks.
Bone mRNA expression of OPG was down-regulated in pigs produced by +D or ++D sows (P<0·05) at 3 weeks (Table 10). The apparent down-regulation of OPG would infer a potential increase in osteoclastic activity. In rapidly growing animals, bone re-absorption may not necessarily infer a lack of bone accumulation, as the rate of bone formation may be up-regulated to a greater extent and still allow a net accumulation of bone minerals.
Bone mRNA expression of FGF23 was only up-regulated (P<0·05) in pigs at 8 weeks if fed +D or 120P nursery diets (Table 10, Fig. 5). Our results are consistent with the endocrine role of bone in FGF23 production. Both active vitamin D and P increase FGF23 ( Reference Lanske, Densmore and Erben 23 – Reference Sitara, Razzaque and St-Arnaud 25 ). The relative fold increase in the expression of FGF23 was dramatically different among treatment groups as was the variation within groups. Differences were detected that were consistent with expected responses, but the reason for the magnitude of the responses remains questionable. One possible explanation is that the expression of FGF23 mRNA in the control bone was extremely low, thus skewing the magnitude of change between the control and the other treatments. Bone FGF23 expression is thought to be low in non-pathogenic tissue( Reference Lanske, Densmore and Erben 23 ). To our knowledge, this is the first report of FGF23 mRNA expression in pig bone.
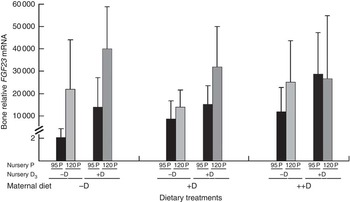
Fig. 5 Effect of nursery diet on pig bone mRNA expression of fibroblast growth factor 23 (FGF23) at 8 weeks. Values are averages of the relative fold change compared with the control of six to nine tissues per treatment normalised to the geometric average of ribosomal protein S15 and S18, with their standard errors. The control at 8 weeks was pigs produced by −D sows and fed −D95P nursery diets. Pigs fed +D or 120P nursery diets had greater bone mRNA expression of FGF23 (P<0·05) at 8 weeks.
The qPCR analyses carried out in this experiment were intentionally selected to provide an overall assessment of genes commonly associated with vitamin D, Ca and P homoeostasis and bone metabolism in pigs as an approach to identify the potential cellular signals involved in bone deformities observed in the hypovitaminosis D-induced kyphotic pig model. Additional efforts are needed to identify specific genes that lead to the induction of the bone abnormalities in response to dietary treatments.
Discussion
The ability to reproduce kyphosis in an earlier experiment( Reference Rortvedt and Crenshaw 10 ) has allowed further characterisation of the abnormalities in affected animals. Kyphosis was induced in pigs produced by sows fed no (0µg D3/kg diet) or marginal (8·125µg D3/kg diet) supplemental D during gestation and lactation if pigs were subsequently fed nursery diets with no supplemental D and marginal Ca and P( Reference Rortvedt and Crenshaw 10 ). On the basis of the previous results, we chose to only alter nursery dietary P in the current study. Results from the current experiment implied the presence of a maternal dietary carry-over effect on pig growth and skeletal integrity. An abnormal outward spinal curvature was not the only bone abnormality evident in pigs that developed kyphosis in our model. Other bones such as the femur presented abnormalities upon visual examination of the growth plate of excised bones. Therefore, the overall objective of this study was to characterise the interaction between maternal and neonatal dietary inputs and their effects on pig bone and growth traits. The incidence of kyphosis was not evaluated in this study as only the minimum number of pigs required to adequately assess tissue and skeletal integrity traits were included.
The typical SRTC gestation and lactation diets contain 8·125µg D3/kg diet, a marginal level compared with the newly established 2012 National Research Council( 26 ) recommendation of 20·0µg D3/kg diet. Therefore, one might speculate that an excess of maternal dietary D could potentially alleviate bone abnormalities in pigs produced by sows fed no or marginal supplemental D, providing the basis for inclusion of the ++D sow treatment in the current study.
Growth, skeletal, cellular and bone mechanical traits all provided evidence for a maternal dietary carry-over effect on nursery pig response. With the exception of kidney mRNA expression of CYP24A1 at 3 weeks, no evidence was provided for differences between pigs produced by sows fed marginal (+D) and excess (++D) D in overall maternal dietary effects at 0, 3 or 8 weeks on the measured traits. However, pigs responded to nursery diets differently if produced by sows fed ++D during gestation and lactation compared with pigs produced by sows fed −D or +D (maternal×nursery diet interaction). This implies that the excess D fed to sows during gestation and lactation may offer a level of protection for pigs, should they encounter a diet-induced stress during the early growth and development stages. The mechanism for this hypothesis requires further examination.
Although evidence for maternal dietary carry-over effects at the end of the nursery period was detected for several traits, evidence for maternal effects on pigs at birth and weaning was limited. The differences in growth at weaning, but not whole-body BMC and BMD, imply that soft tissue growth was compromised at an earlier age than skeletal tissue growth in response to limited maternal dietary D. The lack of differences at birth and weaning in the traits measured does not eliminate the possibility of a maternal dietary affect at these times. Both growth and bone densitometry measurements were evaluated at a gross, whole-body level. Our results are consistent with those found in mouse and human studies of vitamin D and pregnancy in that differences due to maternal vitamin D status in offspring are not always evident immediately at birth( Reference Kovacs 9 , Reference Miller, Halloran and DeLuca 27 ). Therefore, methods to assess gross skeletal mineralisation may not be sufficiently sensitive to detect responses at birth( Reference Liu and Hewison 4 ).
Data from the current study provided evidence for an influence of maternal diets on molecular (mRNA expression) characteristics in pig tissues as early as birth. The genes examined in the current study may not fully explain the bone abnormalities observed in this model. However, the current results provide evidence of early molecular changes in response to maternal dietary inputs without gross manifestation of abnormalities. Further exploration is necessary to fully describe the effects of maternal and neonatal dietary inputs on the underlying cellular signals of bone growth and development.
In the traits evaluated, a slight excess of dietary P in the absence of D in the nursery diets was more detrimental than marginally deficient P levels, which was exacerbated if the pigs were produced by sows fed no or marginal D. These responses are not completely explained by the classical vitamin D, Ca and P pathway( Reference Crenshaw, Rortvedt and Hassen 24 ). Traditionally, adequate or excess Ca and P have been used to ‘rescue’ animals that were fed D-deficient diets from bone abnormalities( Reference Johnson and DeLuca 28 ). According to the accepted homoeostatic regulation of vitamin D, Ca and P, excess P and adequate Ca in the nursery diets would be expected to compensate for the lack of D to maintain bone mineralisation, soft tissue growth and bone mechanical integrity. Although vitamin D has traditionally been indirectly associated with bone development through regulation of Ca homoeostasis, a newly discovered hormone, FGF23, has provided additional insights into vitamin D and P homoeostasis, which directly involves bone( Reference Lanske, Densmore and Erben 23 , Reference Sitara, Razzaque and St-Arnaud 25 ). Traditional pathways for vitamin D-mediated regulation of Ca and P homoeostasis have focused on regulation of vitamin D by parathyroid hormone in response to fluctuations in serum Ca concentrations. These hormones induce changes in the kidney, gastrointestinal tract and bone. More recently, evidence for a direct role of vitamin D in bone development was provided through identification of the VDR in bone cells( Reference DeLuca 29 ) and by new insights into cellular signalling pathways that control P homoeostasis( Reference Crenshaw, Rortvedt and Hassen 24 ). The phosphaturic hormone, FGF23, has been characterised in mouse and cell culture models( Reference Hittmeier, Grapes and Lensing 18 , Reference Lanske, Densmore and Erben 23 , Reference Martin, Liu and David 30 ). FGF23 is responsible for P homoeostasis through a pathway that involves negative-feedback regulation between FGF23, vitamin D and P (Fig. 6). FGF23 is produced by osteoblast and osteocyte cells and is regulated by vitamin D and P( Reference Lanske, Densmore and Erben 23 , Reference Crenshaw, Rortvedt and Hassen 24 , Reference Martin, Liu and David 30 ). Active vitamin D or P increases FGF23 production in bone, which then acts systemically to down-regulate renal Na–P transporters to decrease P re-absorption, thus decreasing circulating P. FGF23 down-regulates the 1α-hydroxylase enzyme and reduces activation of vitamin D, resulting in the negative-feedback loop between FGF23, vitamin D and P. Our exploration into the molecular mechanisms altered in this model revealed evidence of an up-regulation of bone mRNA expression of FGF23 in response to nursery dietary D or P, consistent with mouse and cell culture data.
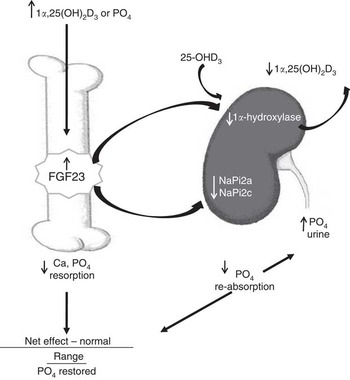
Fig. 6 Feedback regulation between fibroblast growth factor 23 (FGF23), vitamin D and phosphate in bone and kidney. Active vitamin D (1α,25(OH)2D3) or increased plasma phosphate stimulates an increase in FGF23 release from bone cells, which then acts systemically to down-regulate renal sodium–phosphate transporters (NaPi2a and NaPi2c) and decrease phosphate re-absorption, thus decreasing circulating phosphate. FGF23 down-regulates the 1α-hydroxylase enzyme and reduces activation of vitamin D, resulting in a negative-feedback loop between FGF23, vitamin D, and phosphate. Figure modified from our previous publication( Reference Crenshaw, Rortvedt and Hassen 24 ).
This pathway offers one explanation for our experimental responses. Pigs produced by sows fed no or marginal supplemental D would be assumed to have low stores of vitamin D. Therefore, an increase in dietary P, and subsequently serum P, in those pigs would potentially cause an increase in FGF23, which would negatively feedback on the activation of vitamin D due to increased P. Therefore, the lack of D in the nursery diet was further compromised by decreased activation of vitamin D. Pigs produced by sows fed excess D would be assumed to have greater vitamin D stores; therefore, decreased activation of vitamin D due to increased P would not be as detrimental to these pigs. This hypothesis requires further tests to determine whether pig vitamin D stores are influenced by maternal dietary D and whether the FGF23 pathway is controlled in pigs in a similar manner as demonstrated by mouse, human and cell culture models( Reference Lanske, Densmore and Erben 23 , Reference Sitara, Razzaque and St-Arnaud 25 , Reference Martin, Liu and David 30 ).
As previously mentioned, the design of this experiment did not allow for distinction between the effects evoked during gestation v. lactation. An elaborate cross-foster experiment conducted by Clements & Fraser( Reference Clements and Fraser 31 ) that involved labelled vitamin D injections provided evidence that, for the first 10 d of life, the neonate depended on vitamin D metabolites obtained in utero v. through milk. Human and bovine milk has limited antirachitic activity( Reference Weisman, Bawnik and Eisenberg 32 , Reference Hollis, Roos and Draper 33 ). Injection of a single pharmacological dose (125×103 µg) of vitamin D3 to sows before parturition was positively correlated with an increase in milk D3 concentrations( Reference Goff, Horst and Littledike 11 ). Although Goff et al.( Reference Goff, Horst and Littledike 11 ) provided evidence for the ability for sow milk vitamin D levels to be altered, we did not impose a pharmacological dose of vitamin D in this study. At present, we do not know whether the dietary levels fed would evoke a similar increase in sow milk vitamin D. Therefore, we assume that the gestational diets imposed in the current study did play a role in the maternal carry-over effects evident at 3 and 8 weeks. However, the contribution of gestation diets in relation to a lactation effect cannot be completely separated based on results from the current experiment. In addition, stores of vitamin D acquired in utero or during lactation may not be the only factor involved in the maternal dietary carry-over effects. Molecular changes imposed on the fetus or neonate during gestation or lactation may also play a role. Examples of this possibility are provided by changes in kidney and intestine mRNA expression of CYP24A1 and bone mRNA expression of OCN at 0 and 3 weeks.
The vertebrae are not the only bones compromised in the hypovitaminosis D kyphotic pig model, as mentioned earlier. Long bones from those pigs appeared from gross observations to have abnormally wide and variable growth plates. This implies a possible uncoupling in the process of endochondral ossification, of which the rate-limiting step is modelling and re-modelling of the extracellular matrix( Reference Ortega, Behonick and Werb 34 , Reference Stickens, Behonick and Ortega 35 ). Therefore, additional efforts are needed to identify molecular signals involved in the intricate steps of endochondral ossification and matrix turnover in order to better explain the origin of the spinal column and long bone deformities imposed by lack of supplemental D in maternal and neonatal diets.
Conclusions
In conclusion, the current controlled animal study revealed evidence for maternal dietary D carry-over effects on subsequent pig growth, bone mineralisation and integrity, and tissue molecular characteristics. Changes in some traits were present as early as birth, but other traits were not evident until 3 or 8 weeks of age. Specifically, the most dramatic evidence for maternal dietary D carry-over was provided by responses in bone mineralisation traits of pigs at the end of the nursery period (8 weeks of age). Compared with responses of pigs produced by ++D sows, pigs produced by –D sows had a 25 % reduction in BMD. Nursery dietary D or P did not completely prevent or restore the responses to maternal diets. Not only was an overall maternal diet effect evident, a maternal by nursery diet interaction implied that the responses were mediated by dietary inputs at both phases. The ability to consistently induce bone abnormalities in pigs by alterations in maternal and nursery dietary inputs allows examination of both gross and molecular characteristics in growth and bone development of young growing animals. An animal model of bone abnormalities can be used to alleviate the problems associated with observational human studies and permit inferences about humans and other animal species. Studies to further characterise the molecular effects of maternal dietary D on pig bone growth and development are warranted.
Acknowledgements
The authors acknowledge the University of Wisconsin Swine Research and Teaching Center staff for their meticulous animal care.
Funds to support this project were provided by the University of Wisconsin Hatch fund (PRJ42HD) and an unrestricted research fund (233-Q893) to support swine nutrition research. DSM Nutritional Products North America donated the supplemental vitamin D3 used in diet supplements, but had no role in the experimental design, analysis or writing of the manuscript. Vitamin D3 analyses of the dietary vitamin premixes were provided by DSM.
L. A. A. and T. D. C. designed the research trial, conducted the study and interpreted the results. L. A. A. wrote the manuscript and conducted the laboratory analysis with input from L. L. H. and J. L. on the development of quantitative PCR assays. All the authors read and approved the final version of the manuscript.
The authors declare that there are no conflicts of interest.


