


Osteoporosis is a major public health problem and a costly disease worldwide. From a nutritional point of view, the importance of adequate vitamin D and Ca intake for bone health is well established(Reference Tang, Eslick and Nowson1–Reference Welten, Kemper and Post3). Nevertheless, less consensus exists about whether the intake of Ca and P, the main bone-forming minerals, must exist in a certain ratio in adult diets to ensure optimal bone health. Based on calculations of recommended dietary Ca and P intakes, the optimal dietary Ca:P molar ratio is suggested to be 1(4–7), corresponding to a Ca:P weight ratio of 1·3. However, in many countries, dietary P intake is two- to threefold higher than recommended levels(Reference Paturi, Tapanainen and Reinivuo8–Reference Calvo11), while total dietary Ca intake remains below nutritional recommendations(Reference Calvo11–Reference Salamoun, Kizirian and Tannous16). These dietary habits lead to the lower dietary Ca:P ratios observed in various countries in recent years(Reference Paturi, Tapanainen and Reinivuo8, Reference Calvo11, Reference Brot, Jorgensen and Madsen17–Reference Takeda, Sakamoto and Yokota19).
The hypothesis of adverse effects of diets with a low Ca:P ratio originated from animal model studies, where animals fed a low Ca:P ratio diet manifested secondary hyperparathyroidism, loss of bone and osteopenia(Reference Calvo and Park6). In addition, a high Ca:P ratio due to low P intake was found to be favourable for bone mineralisation in adult rats, as it increased Ca absorption(Reference Koshihara, Katsumata and Uehara20). Relative to the number and quality of animal studies, the effects of dietary Ca:P ratios on Ca and bone metabolism in human subjects have been investigated little. Furthermore, whether the dietary Ca:P ratio is clinically significant in adult human subjects has been debated(Reference Sax21, 22). Some earlier findings in young females have supported the importance of a sufficient dietary Ca:P ratio in bone health in epidemiological(Reference Metz, Anderson and Gallagher23, Reference Teegarden, Lyle and McCabe24), intervention(Reference Calvo, Kumar and Heath25) or short-term controlled studies(Reference Kemi, Kärkkäinen and Lamberg-Allardt26, Reference Kemi, Kärkkäinen and Karp27).
Parathyroid hormone (PTH) is a major regulator of Ca, P and bone metabolism. Ca and P have opposite effects on serum PTH (S-PTH) concentration, as dietary P has been found to increase S-PTH concentrations(Reference Calvo, Kumar and Heath25, Reference Kemi, Kärkkäinen and Lamberg-Allardt26) by decreasing serum-ionised Ca (S-iCa) concentration(Reference Herfarth, Schmidt-Gayk and Graf28) and by directly affecting PTH secretion(Reference Slatopolsky, Finch and Denda29), probably through the Na-phosphate co-transporter in the parathyroid gland(Reference Miyamoto, Tatsumi and Segawa30), while Ca administration has been demonstrated to decrease S-PTH(Reference Kärkkäinen, Lamberg-Allardt and Ahonen31, Reference Sadideen and Swaminathan32) through an increase in S-iCa(Reference Herfarth, Schmidt-Gayk and Graf28). Intermittent administration of PTH stimulates bone formation(Reference Liu and Kalu33) and increases trabecular bone mass(Reference Hodsman, Steer and Fraher34), while continuous excessive PTH secretion increases bone turnover(Reference Tam, Heersche and Murray35, Reference Schiller, Dippolito and Roos36) and releases Ca and P from bone.
Ca and P metabolism is tightly bound together, which is reflected in, for instance, the S-PTH-mediated regulation of urinary Ca (U-Ca) and urinary phosphate (U-Pi) excretions. In normal physiological conditions, an increase in S-PTH concentration results in lower U-Ca and higher U-Pi excretion. Understandably, as both dietary Ca and P intakes affect S-PTH, an increase in dietary Ca intake elevates U-Ca excretion(Reference Kemi, Kärkkäinen and Karp27, Reference Charles37), while high P intake per se (Reference Whybro, Jagger and Barker5, Reference Bell, Draper and Tzeng38) or together with low Ca intake(Reference Kemi, Kärkkäinen and Lamberg-Allardt26, Reference Kemi, Kärkkäinen and Karp27) decreases U-Ca excretion. Decreased S-PTH concentration, in turn, leads to higher U-Ca and lower U-Pi excretion. U-Pi excretion diminishes, as decreased S-PTH inhibits the activity of Na-phosphate co-transporters in kidneys(Reference Murer, Forster and Hernando39).
Our objective here was to examine how habitual dietary Ca:P ratio affects S-PTH concentration and other Ca metabolism markers in healthy premenopausal women. We hypothesised that low dietary Ca:P ratios have a more deleterious impact than high Ca:P ratios on Ca metabolism. Since dietary Ca intake in Scandinavian countries generally meets nutritional recommendations, we were able to determine whether the optimal dietary Ca:P molar ratio of 1 is achieved among participants whose habitual dietary Ca intake is at the recommended level ( ≥ 800 mg/d)(4).
Participants and methods
Participants
Our participants represent a subgroup of randomly selected 31- to 43-year-old Finnish women. Details about these cross-sectional study participants have been provided elsewhere(Reference Lamberg-Allardt, Outila and Kärkkäinen40). Only women with no illnesses or medications affecting Ca metabolism were included. Women with no or irregular menstruation as well as those with incomplete 4-d food records were excluded. Our final study group comprised 147 healthy premenopausal women, whose oestrogen status was presumed to be reasonable normal due to regular menstruation. Before the study, each participant gave her informed consent to the procedures, which were conducted in accordance with the Helsinki Declaration. The Helsinki University Ethics Committee approved the study protocol.
Questionnaire and dietary assessment
A questionnaire was used to collect information on weight, height, smoking habits and alcohol consumption of participants. In addition, the questionnaire requested information on age, age at menarche, past medical history (e.g. contraceptives used) and menstruation cycle.
To gather data on habitual energy and nutrient intakes, participants were instructed on how to keep a 4-d food record, which included three weekdays and 1 d of the weekend. Participants were advised to maintain their habitual food intakes during this period and to record all foods and beverages immediately after consumption. A nutritionist together with the participant checked the 4-d food record. We calculated participants' habitual dietary intakes with a computer-based program, the Unilever Dietary Analysis Program (Becel Palvelu Paasivaara Oy, Finland, 1989), based on the food composition database (Fineli) of the Finnish National Public Health Institute.
Study design
Participants' dietary Ca:P ratios were calculated based on the information of Ca (mg/d) and P (mg/d) intakes provided in the 4-d food record. Weight Ca:P ratios were converted into molar ratios by using molecular weight of Ca (40·08 g/mol) and P (30·97 g/mol). Both molar and weight ratios of each Ca:P quartile are presented in Table 1. To examine the effects of different dietary Ca:P ratios on S-PTH and Ca metabolism markers, we divided participants into quartiles according to their dietary Ca:P molar ratios. Characteristics of quartiles are presented in Table 1. In addition, since we found that the 1st quartile differed from all other quartiles in effects on S-PTH and several other Ca metabolism markers and the 2nd, 3rd, and 4th quartiles had similar effects, we also compared the 1st quartile to the combined group of the other quartiles.
Table 1 Basic characteristics of all study participants (n 147) and of participants in each dietary molar Ca:P quartile
(Mean values of daily nutrient intakes with their standard errors)

NS (P>0·05) with ANOVA.
* Ca:P molar ratio ≤ 0·50 (corresponds to Ca:P weight ratio ≤ 0·65).
† Ca:P molar ratio 0·51–0·57 (corresponds to Ca:P weight ratio 0·66–0·74).
‡ Ca:P molar ratios 0·58–0·64 (corresponds to Ca:P weight ratio 0·75–0·83).
§ Ca:P molar ratio ≥ 0·65 (corresponds to Ca:P weight ratio ≥ 0·84).
∥ Between the Ca:P quartiles with ANOVA.
Sampling and biochemical measurements
On the study days, blood samples were taken anaerobically between 07.30 hours and 09.15 hours after a 12-h overnight fast. In addition, 24-h urine was collected three times during the study. The urine and separated serum samples were stored at − 20°C until analysed. The S-iCa concentration was analysed with an ion-selective analyser (Microlyte 6, Thermo Electron Corporation, Vantaa, Finland). The intra-assay CV was 1·6 % for S-iCa. The serum-intact PTH concentration was measured using an immunoradiometric assay (Nichols Institute, Juan San Capistrano, CA, USA), with 10–65 ng/l as the reference range. Intra- and interassay CV for serum-intact PTH were 3·7 and 1 %, respectively. The serum 25-hydroxy vitamin D (S-25(OH)D) concentration was measured by a RIA (Dia Sorin, Inc., Stillwater, MN, USA). The intra- and interassay CV were 10·1 and 14·9 %, respectively. Serum Ca (S-Ca) and phosphate (S-Pi), and U-Ca and phosphate (U-Pi) concentrations were measured by routine laboratory methods using an Elan Automatic Analyser (Eppendorf–Netheler–Hinz GmbH, Hamburg, Germany). CV % for S-Ca and U-Ca was 1·20–1·60 %, and for S-Pi and U-Pi it was 2·90 %. To calculate U-Ca and U-Pi values, the averages of three separate urine collections, corrected with urinary creatinine excretion, were used.
Statistical analysis
Statistical approaches
Power calculation based on S-PTH concentration (expected difference between quartiles in mean S-PTH concentration 12 ng/l), assuming 90 % power with α = 0·05, indicated that a sample size of eleven in each group was adequate(Reference Kärkkäinen, Outila and Lamberg-Allardt41). Subject characteristics between quartiles were compared by ANOVA. The differences in the averages of the dependent variables between the Ca:P quartiles were compared with ANOVA and analysis of covariance (ANCOVA). ANCOVA was used because it enables inclusion of both categorical (e.g. use of contraceptives) and continuous (e.g. S-iCa) explanatory variables. Furthermore, ANCOVA was used to exclude the possibility that differences found with ANOVA are not due to differences in relevant covariates. For pairwise comparison when ANOVA or ANCOVA P-values were below 0·05, Fisher's least significant difference method (Fisher's LSD) was used. We used an SPSS software program (version 15.0, SPSS, Inc., Chicago, IL, USA, 2006) in a Windows environment for all statistical analyses. Results were considered statistically significant at P < 0·05. Data are presented as means and standard error of means.
Covariates
Several factors are known to affect S-PTH concentration. Among these are serum variables (S-25(OH)D and S-iCa) and the use of contraceptives(Reference Teegarden, Legowski and Gunther42). When the means of S-iCa, S-Ca and S-Pi were compared, S-PTH was included in covariates (Table 2). In addition, S-Pi was included in covariates when comparing the means of S-iCa and S-Ca (Table 2). Na intake is known to affect U-Ca and U-Pi excretion; therefore, when the means of U-Pi and U-Ca were compared, Na intake was included in covariates. We excluded age from the covariates, as all participants represented the same age group and all were premenopausal females. Energy intake was also excluded because Ca and P intakes correlated well with energy intake. Since body weight and BMI had no effects on the variables measured, they were excluded from the covariates. In summary, we chose covariates that correlated with the outcome parameter or covariates known to affect outcome according to the literature.
Table 2 Mean values of serum-ionised calcium (S-iCa), calcium (S-Ca) and phosphate (S-Pi) concentrations
(Mean values with their standard errors)

ANCOVA, analysis of covariance; S-PTH, serum parathyroid hormone; S-25(OH)D, serum 25-hydroxy vitamin D; S-Pi, serum phosphate.
* P < 0·05 with ANCOVA adjusted for S-PTH, S-25(OH)D and S-Pi concentrations, and use of contraceptives.
† NS (P>0·05) with ANCOVA adjusted for S-PTH, S-25(OH)D and S-Pi concentrations, and use of contraceptives.
‡ NS (P>0·05) with ANCOVA adjusted for S-PTH, S-iCa and S-25(OH)D concentrations, and use of contraceptives.
§ Medix Laboratoriot (http://www.medix.fi).
Results
Baseline characteristics
The baseline characteristics of the 147 participants are displayed in Table 1.
Habitual dietary calcium and phosphorus intake
Participants' average dietary intake of Ca and P, and P intake from milk and cheese are presented in Table 1. Forty-four participants had a dietary Ca intake below recommended levels(4, 43); their mean intake was 647 mg/d (sem 21·6). In the Ca:P quartiles, the number of participants with a dietary Ca intake below recommendations varied, being the highest in the 1st quartile (n 26, n 13, n 0 and n 5 in the 1st, 2nd, 3rd and 4th quartiles, respectively; Table 1). Among all study participants, the lowest individual dietary Ca intake was 200 mg/d and the highest was 2739 mg/d, while the lowest individual P intake corresponded exactly to nutritional recommendations for P(4, 43) and the highest (3010 mg/d) exceeded the recommendations fivefold(43). The 5th, 50th and 95th percentiles of Ca and P intake in each Ca:P quartile are presented in Fig. 1.
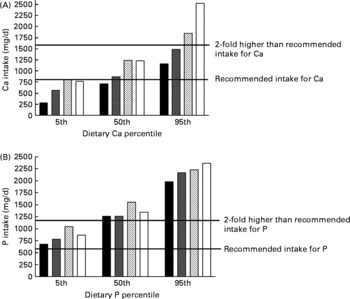
Fig. 1 The 5th, 50th and 95th percentiles of dietary calcium (mg/d; panel A) and phosphorus (mg/d; panel B) intakes in each calcium:phosphorus quartile. Calcium:phosphorus molar ratios were ≤ 0·50, 0·51–0·57, 0·58–0·64 and ≥ 0·65 in the 1st, 2nd, 3rd and 4th quartiles, respectively. ■, 1st quartile; ![]() , 2nd quartile;
, 2nd quartile; ![]() , 3rd quartile; □, 4th quartile.
, 3rd quartile; □, 4th quartile.
Habitual dietary calcium:phosphorus ratio
In line with the National FINDIET 2007 Survey results(Reference Paturi, Tapanainen and Reinivuo8), the average habitual dietary Ca:P ratio of our participants (Table 1) corresponded to the ratio in Finnish females. The molar ratio of dietary Ca:P varied between 0·22 and 0·91, corresponding to a Ca:P weight ratio of 0·29–1·18; thus, none of the participants achieved the suggested dietary Ca:P molar ratio of 1(4–7). The mean molar Ca:P ratios of study participants in each quartile of dietary Ca and P intakes are presented in Fig. 2. Among all participants, the Ca:P molar ratio at the 5th percentile intake was 0·38 (weight ratio 0·49) and at the 95th percentile intake was 0·74 (weight ratio 0·96).

Fig. 2 The mean molar dietary calcium:phosphorus ratios (y-axis) in each calcium (x-axis) and phosphorus (z-axis) intake quartile. Dietary calcium intake in calcium quartiles was < 770, 771–997, 998–1251 and >1251 mg/d in the 1st, 2nd, 3rd and 4th quartiles, respectively. Dietary phosphorus intake in phosphorus quartiles was < 1122, 1122–1347, 1348–1643 and >1643 mg/d in the 1st, 2nd, 3rd and 4th quartiles, respectively.
Effect of dietary calcium:phosphorus ratios on serum parathyroid hormone
The mean S-PTH concentration differed significantly between the Ca:P quartiles (P = 0·014, ANOVA), being higher in the 1st quartile than in the others. To exclude the possibility that these differences are not due to differences in relevant covariates, we adjusted the S-PTH means for the following variables (S-iCa and S-25(OH)D concentrations and use of contraceptives). After these adjustments, the S-PTH differences remained practically the same, as did their statistical significance (P = 0·021, ANCOVA). The mean S-PTH values and the statistical differences of the 2nd, 3rd and 4th quartiles from the 1st quartile are shown in Fig. 3. The mean S-PTH concentration was 30 % higher in the 1st quartile than in the combined group of the 2nd, 3rd and 4th quartiles (P = 0·002). No differences in the mean S-PTH concentrations were present among the 2nd, 3rd and 4th quartiles, and the smallest P-value among quartiles in the ANCOVA model was only 0·88.

Fig. 3 Effects of calcium:phosphorus ratios on serum parathyroid hormone (S-PTH) concentration (means with their standard errors) in the different quartiles. The covariates included serum 25-hydroxyvitamin D and ionised calcium concentrations, and use of contraceptives. Analysis of covariance (ANCOVA) was performed. Mean value was significantly different from that of the 1st quartile: *P = 0·014, † P = 0·07, ‡ P = 0·017 (Fisher's least significant difference comparison, ANCOVA). ■, 1st quartile; ![]() , 2nd quartile;
, 2nd quartile; ![]() , 3rd quartile; □, 4th quartile.
, 3rd quartile; □, 4th quartile.
Effect of dietary calcium:phosphorus ratios on urinary excretion of calcium and phosphate
The dietary Ca:P ratio significantly affected the 24-h U-Ca excretion (P = 0·047, ANOVA). The mean U-Ca excretion in the 1st quartile was higher than in the other quartiles. After adjusting the U-Ca means for the following relevant covariates (dietary Na and protein intakes, S-PTH and S-25(OH)D concentrations, and use of contraceptives), similar effects remained in the U-Ca differences and in their statistical significance (P = 0·051, ANCOVA). The mean U-Ca values are shown in Fig. 4. When comparing the 2nd, 3rd and 4th quartiles as a combined group with the 1st quartile, the mean U-Ca excretion was about 30 % higher in the latter (P = 0·006, ANCOVA). In addition, the mean U-Ca excretion did not vary between the 2nd, 3rd and 4th quartiles (ANCOVA; P = 0·58–0·90).
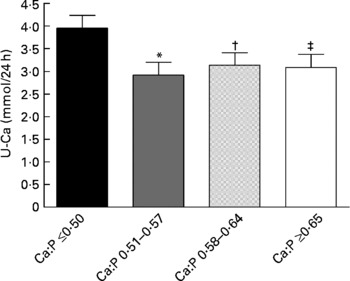
Fig. 4 Effects of calcium:phosphorus ratios on 24-h urinary calcium (U-Ca) excretion (means with their standard errors) in the different quartiles. The covariates included serum 25-hydroxyvitamin D and parathyroid hormone concentrations, dietary sodium and protein intakes, and use of contraceptives. Analysis of covariance (ANCOVA) was performed. Mean value was significantly different from that of the 1st quartile: *P = 0·010, † P = 0·040, ‡ P = 0·035 (Fisher's least significant difference comparison, ANCOVA). ■, 1st quartile; ![]() , 2nd quartile;
, 2nd quartile; ![]() , 3rd quartile; □, 4th quartile.
, 3rd quartile; □, 4th quartile.
The mean 24-h U-Pi excretion did not differ between the Ca:P quartiles (P = 0·33, ANOVA). However, after adjustment for relevant covariates (dietary Na intake, S-PTH and S-25(OH)D concentrations, and use of contraceptives), the mean U-Pi excretion tended to be different between the quartiles (P = 0·13, ANCOVA). In the 1st quartile, U-Pi excretion was 6–17 % higher than in the 2nd, 3rd and 4th quartiles. Furthermore, when comparing the 2nd, 3rd and 4th quartiles as one group with the 1st quartile, the mean U-Pi excretion was about 13 % higher in the 1st quartile (P = 0·055, ANCOVA).
Effect of dietary calcium:phosphorus ratios on serum-ionised calcium, calcium and phosphate
The mean S-iCa concentration differed significantly between the quartiles (P = 0·027, ANOVA), being the highest in the 4th quartile. S-iCa concentration in the 4th quartile differed significantly from all other quartiles (P = 0·050, P = 0·006 and P = 0·013 in the 2nd, 3rd and 4th quartiles, respectively, Fisher's LSD comparisons, ANOVA). After adjusting the S-iCa means for the relevant variables (S-PTH, S-25(OH)D and S-Pi concentrations, and use of contraceptives), the S-iCa differences remained practically the same, as did their statistical significance (P = 0·040, ANCOVA; Table 2). However, the 1st quartile did not differ significantly from the 4th quartile (P = 0·242, Fisher's LSD comparisons, ANCOVA), although the 2nd (P = 0·010, Fisher's LSD comparisons, ANCOVA) and 3rd (P = 0·022, Fisher's LSD comparisons, ANCOVA) quartiles did (Table 2).
While no differences existed in S-Ca concentration between the Ca:P quartiles by ANOVA (P = 0·27), S-Ca concentration tended to differ between quartiles (P = 0·061, ANCOVA) after adjustment for relevant covariates (S-PTH, S-25(OH)D and S-Pi concentrations, and use of contraceptives; Table 2).
The mean S-Pi concentration did not differ between the quartiles (P = 0·85, ANOVA). After adjusting the S-Pi means for relevant covariates (S-PTH, S-25(OH)D and S-iCa concentrations, and use of contraceptives), no differences between the quartiles were found (P = 0·87, ANCOVA; Table 2).
Discussion
In this cross-sectional study, low habitual dietary Ca:P ratios interfered with Ca metabolism in healthy women with an adequate dietary Ca intake. Interestingly, the lowest quartile (Ca:P molar ratio ≤ 0·50) differed from all other quartiles by increasing both S-PTH concentration and U-Ca excretion. In fact, quartiles other than 1st one had similar effects on the markers measured, except on S-iCa concentration. The present findings imply that a cut-off Ca:P ratio may exist, lower than suggested Ca:P molar ratio of 1(4–7), below which the effects on mineral metabolism and bone health are more severe. It is noteworthy that dietary Ca intake among our participants was mostly adequate or high (mean Ca intake 1056 mg/d). Even in the 1st quartile, the mean Ca intake was nearly 750 mg/d. This intake reflects the high dairy product consumption of participants. More details of participants' consumption of dairy products have been provided elsewhere(Reference Kemi, Rita and Kärkkäinen44). Nevertheless, none of the participants achieved the suggested Ca:P molar ratio of 1 in their diets. This is mainly due to the excessive P content in their habitual diets, rather than low dietary Ca intake, as mean dietary P intake exceeded 2·4-fold, and mean dietary Ca intake 1·3-fold the Nordic nutritional recommendations for P (600 mg/d) and Ca (800 mg/d)(43). These intakes corresponded to the average intake of Ca and P in Finnish females in 2007(Reference Paturi, Tapanainen and Reinivuo8).
Speculation has arisen as to whether the dietary Ca:P ratio is clinically significant in adult human subjects(Reference Sax21). In infants and children, a dietary Ca:P weight ratio of 1·5 is considered to be ideal for optimal growth(9). However, in adult diets, the Ca:P ratio varies, being highest in dairy products(45). P is present in a wide range of foods, while about 75 % of Ca comes from dairy products(Reference Paturi, Tapanainen and Reinivuo8). In addition, P is added to foods as a phosphate-containing food additive, further increasing already high P intake. Although, some foods rich in P are also good sources of Ca, e.g. dairy products, many others contain very little Ca. Among the participants in the present study, the intake of P from milk and cheese was higher in the 3rd and 4th Ca:P quartiles indicating that dairy products represent a higher proportion of the total P intake in these quartiles. Therefore, if the habitual diet lacks dairy products, the dietary Ca:P ratio will easily drop below optimal levels. Very low Ca:P ratios ( ≤ 0·25) have been reported in diets of young girls and boys in Poland(Reference Chwojnowska, Charzewska and Chabros18), as well as in teenagers and young adults in USA(Reference Calvo11).
Calvo et al. (Reference Calvo, Kumar and Heath46) found that a high-P (1700 mg/d), low-Ca diet (400 mg/d) consumed by young adults for 8 d resulted in elevated S-PTH. Interestingly, S-PTH concentrations increased more in females than in males. In an additional 4-week study in young females only, S-PTH levels increased in response to a high-P, low-Ca diet, but no changes occurred in another central regulator of Ca and bone metabolism, serum 1,25-(OH)2D concentration, which usually increases in response to low Ca intake(Reference Calvo, Kumar and Heath25). The authors suggested that the usual homoeostatic mechanism used when dietary Ca is limited is disturbed by chronic high P intake. Similar results were observed in a 24-h controlled study in healthy young females, whose S-PTH concentrations increased in a dose-dependent manner in response to increasing P intake and decreasing Ca:P ratio, although no changes in serum 1,25-(OH)2D concentrations occurred(Reference Kemi, Kärkkäinen and Lamberg-Allardt26). Unfortunately, serum 1,25-(OH)2D concentrations were not measured in the present study, but in line with observations in earlier interventions(Reference Calvo, Kumar and Heath25, Reference Calvo, Kumar and Heath46) and short-term controlled studies(Reference Kemi, Kärkkäinen and Lamberg-Allardt26, Reference Kemi, Kärkkäinen and Karp27), higher S-PTH concentrations were found in participants with low dietary Ca:P ratios (Ca:P molar ratio ≤ 0·50). While the mean intake of P in all quartiles was over twofold higher (>1200 mg/d) than dietary guidelines(4, 43), the mean intake of Ca was slightly below recommended levels(4, 43) in the 1st quartile only (742 mg/d). In fact, excluding the 1st quartile revealed similar effects on S-PTH in the other quartiles. This similarity may be explained by higher intake of Ca, as Ca intake has been observed to decrease absorption of P in the intestine(Reference Nolan and Cunibi47) and to suppress S-PTH concentration induced by high P intake(Reference Kemi, Kärkkäinen and Karp27). S-PTH concentration is apparently lower in the mornings(Reference Herfarth, Schmidt-Gayk and Graf28). In line with this, we have previously demonstrated that P-containing meals increase S-PTH above the higher reference limit on study days, with S-PTH values remaining elevated the following mornings(Reference Kemi, Kärkkäinen and Lamberg-Allardt26), indicating the presence of a transient secondary hyperparathyroidism. In the present study, higher S-PTH concentrations could have been noted if samples other than morning fasting samples had also been collected. Nevertheless, the finding of increased mean S-PTH only in the 1st quartile supported the importance of higher dietary Ca:P ratios and the vital role of adequate Ca intake simultaneously with high dietary P intake in habitual diets.
An unexpected physiological increase in 24-h U-Ca excretion was observed in the 1st quartile. This was unexpected, since the mean dietary Ca intake and Ca:P ratio in the 1st quartile were the lowest. Furthermore, the mean S-PTH concentration in this quartile was the highest. The present finding is interesting, as in normal physiological conditions elevated S-PTH leads to decreased U-Ca excretion. In primary hyperparathyroidism, an increase in U-Ca excretion is, however, often seen(48). The U-Ca finding suggests that low dietary Ca:P ratios in habitual diets somehow interfere with the homoeostasis of Ca metabolism. An increase in S-PTH due to a low Ca:P ratio would be expected to increase bone resorption, and some of the extra Ca, which has been released from bone, to be excreted in urine. Elevated U-Ca excretion might therefore reflect an increase in bone resorption.
U-Ca excretion is an important determinant of Ca retention in the healthy human body. In a controlled situation, U-Ca excretion has been strongly correlated with acute Ca intake(Reference Charles37). In a controlled short-term study, when dietary P intake was high (1850 mg/d), U-Ca excretion increased with increasing dietary Ca intake and Ca:P ratio in a dose-dependent manner in healthy women(Reference Kemi, Kärkkäinen and Karp27). In addition, 24-h U-Ca excretion was similar with P intakes of 1245 and 1995 mg/d when Ca intake was very low (250 mg/d). These findings indicate that U-Ca excretion might not diminish after a certain high P intake, which may result in an unfavourable Ca balance(Reference Kemi, Kärkkäinen and Lamberg-Allardt26). Moreover, low Ca intake and high U-Ca excretion have been assumed to reduce Ca accretion in bone of young adults during growth and to have a negative impact on skeletal development(Reference Matkovic, Ilich and Andon49). In the present study, U-Ca excretion was expected to be the highest in the 3rd and 4th quartiles, as dietary P intake was high in all of the quartiles, but dietary Ca intake was significantly higher only in the 3rd and 4th quartiles. Furthermore, in the 1st quartile, the mean Ca intake was slightly below recommended levels ( ≥ 800 mg/d)(4, 43). In fact, after excluding the 1st quartile, the other quartiles were highly similar in their effects on U-Ca excretion. This implies that in habitual diets with excessive dietary P intake an adequate dietary Ca intake is needed to overcome the interfering effects of low Ca:P ratios on Ca excretion.
In summary, low dietary Ca:P ratios in habitual diets of healthy women affected both S-PTH and Ca metabolism. Interestingly, the lowest Ca:P quartile differed from all other quartiles in a negative manner. The results suggested that such low Ca:P ratios (Ca:P molar ratio ≤ 0·50) in diets may disturb Ca metabolism and negatively affect bone in healthy subjects, as indicated by higher S-PTH and U-Ca levels together. However, whether it is necessary to reach a Ca:P molar ratio of 1 in diets is unknown. Even participants with a high dietary Ca intake did not achieve the suggested Ca:P ratio of 1. The present results imply that a Ca:P molar ratio higher than 0·50 is sufficient when dietary Ca intake is at the recommended level. However, higher Ca:P ratios might be needed if dietary Ca intake drops markedly below the nutritional recommendations. The present study also indicated that consumption of a large excess of dietary P is not optimal for mineral metabolism and bone health. In Western diets, low Ca:P ratios are common. Thus, more attention should be focused on decreasing excessively high P intake and increasing Ca intake to meet dietary guidelines. In Western diets, dairy products consumption will easily ensure adequate Ca intake. High dietary P intake, in turn, will be reduced by restricting the consumption of highly processed foods and increasing the consumption of raw and unprocessed foods. Nevertheless, increasing dietary Ca intake far beyond the nutritional recommendations should be avoided, as it might lead to other health risks. Identifying persons at risk of having low Ca:P ratios in their habitual diets would be useful. Also, because dietary Ca intake was generally adequate among our participants, additional studies are needed to investigate the impact of dietary Ca:P ratios in populations where low dietary Ca intake is common.
Acknowledgements
The Academy of Finland, the Ministry of Education, the Finnish Graduate School on Applied Bioscience and the Juho Vainio Foundation financially supported the present study. M. U. M. K., M. M. L. L. and T. A. O. conducted the experimental work and laboratory analyses. V. E. K., M. U. M. K., H. J. R. and C. J. E. L.-A. designed the study. V. E. K. conducted the data analysis, carried out the statistical analysis and prepared the manuscript for publication. C. J. E. L.-A., M. M. L. L., M. U. M. K., H. J. R. and T. A. O. assisted with the manuscript revision. C. J. E. L.-A. was the principal investigator of the study. None of the contributing authors had any financial or personal interests in any of the organisations sponsoring the present research. We thank all volunteers for their participation.


