


According to ‘Reference man’, whole-body skeletal muscle (SM) mass dramatically increases from 0·85 kg in newborns to 28·0 kg in adults(Reference Forbes1). The growth of SM mass in children is greatly influenced by nutritional intake and physical activity levels during daily living. In fact, SM mass has been used as a very important index for estimating nutritional status and predicting exercise performance during different growth stages. However, there are very few effective methods to accurately and non-invasively estimate SM mass in children.
Different techniques of evaluating SM tissue in children include X-ray photography(Reference Tanner, Hughes and Whitehouse2) and urinary creatinine excretion(Reference Malina3). However, these methods present some ethical and theoretical issues and only provide a limited amount of information about whole-body SM mass(Reference Remer, Neubert and Maser-Gluth4). Recently, the method of MRI has provided precise, reliable, and safe measurements of whole-body SM mass in adults, and does so in a relatively short period of time (i.e. it takes about 15 min to scan from the first cervical vertebra to the ankle joints with 1·0 cm slice thickness and 0 cm interslice gap in adults)(Reference Abe, Kearns and Fukunaga5). However, MRI methods for estimating SM mass need exclusive-use facilities and a great deal of time for analysing the MRI images. Because of these limitations and the need to be able to measure large groups of subjects, a field technique is warranted for being able to assess whole-body SM mass in children.
Recently, we have developed ultrasound-derived prediction equations for estimating total and regional (i.e. arm, trunk, thigh and lower leg) SM mass in adult males and females(Reference Sanada, Kearns, Midorikawa and Abe6). Ultrasound itself is a non-invasive, safe measure of muscle thickness of the extremities and trunk in children(Reference Abe, Kondo, Kawakami and Fukunaga7). In addition, a compact-type ultrasound machine is easily portable to use during field research when assessing SM mass for large groups of subjects. However, it is unknown whether these adult-based equations, which include height and muscle thicknesses, are a valid method to estimate SM mass in children. Thus, the purpose of the present study was to investigate the validity of the adult-based equations for total and regional SM mass in Japanese prepubertal children and adolescents.
Methods
Subjects
Ten Japanese prepubertal children (six boys, average age 9·2 (sd 0·3) years, and four girls, average age 10·3 (sd 0·7) years; Tanner stage 1 and not approaching peak height velocity) and twenty-one Japanese adolescents (eleven boys, average age 14·1 (sd 0·5) years, and ten girls, average age 13·8 (sd 0·9) years; over Tanner stage 2 and at the peak height velocity) were recruited for the study (Table 1). The maturational level of the subjects was assessed using the Tanner(Reference Tanner8) scale of pubertal stage development by questionnaire. All subjects were physically active (i.e. play outside every day) and did not include any athletes. None of the subjects reported any known pathologies or current medication use. All subjects and their guardians received a verbal and written description of the study and gave their informed consent to participate before testing. The study protocol was approved by the Ethical Committee of Tokyo Metropolitan University.
Table 1 Subject characteristics and ultrasound muscle thickness
(Mean values and standard deviations)

Body mass, wearing only minimal clothing, was measured on a digital balance to the nearest 0·1 kg and height was measured on a stadiometer to the nearest 0·1 cm. The BMI (kg/m2) was calculated as body weight in kg/(height in m)2.
Measured skeletal muscle mass by magnetic resonance imaging
Total body SM volume was measured using a General Electric Signa 1·5 Tesler scanner (Milwaukee, WI, USA). A T1-weighted spin-echo, axial-plane sequence was performed with a 500 ms repetition time during breath holding scans or 660 ms repetition time during normal breathing scans and a 7·4 ms echo time. Subjects rested quietly in the magnet bore in the supine position with their hands placed on their abdomen. Contiguous transverse images with 1·0 cm slice thicknesses (0 cm interslice gap) were obtained from the first cervical vertebra to the ankle joints for each subject. Four sets of acquisitions extended from the first cervical vertebra to the femoral head during breath holding (23 s). The other three sets of acquisitions were obtained from the femoral head to the ankle joints during normal breathing(Reference Abe, Kearns and Fukunaga5). All images (approximately 150 slices per individual) were traced by a highly trained technician (Fig. 1) from the segment of SM excluding connective tissue, blood vessels, fat tissue and abdominal organs. These traced images were then scanned into a personal computer and the anatomical cross-sectional areas were measured using image analysis software Scion Image (NIH Image version Beta 4.02; Scion Corp., Frederick, MD, USA). SM volume was calculated from the sum of cross-sectional area (cm2) determined by tracing the images and then multiplying by the slice thickness (cm). The volumes (cm3) were converted to masses (kg) by use of the following density: 1·041g/cm3 for SM(Reference Snyder, Cooke, Nasset, Karhausen, Howells and Tipton9). The estimated CV for SM mass measurements from a test–retest analysis was determined to be 2 %(Reference Abe, Kearns and Fukunaga5). The SM mass was also separated into discrete regions using anatomical landmarks visible in the scanned images: arm (the axillary fossa to the styloid process of the radius); trunk (the first cervical vertebra to the femoral neck); thigh (the femoral neck to the articular surface of medial condyle); and lower leg (the articular surface of medial condyle to the malleolus lateralis).

Fig. 1 Typical cross-sectional MRI through the neck (A), shoulders (B), body trunk (C), femoral neck (D), mid-thigh (E) and lower leg (F).
Predicted skeletal muscle mass by ultrasound
B-mode ultrasonographic muscle thicknesses were scanned using a real-time linear electronic scanner with a 5 MHz scanning head (SSD-500 Aloka, Tokyo, Japan). The scanning head was prepared with water-soluble transmission gel that provided acoustic contact without depression of the skin surface. The scanner was placed perpendicular to the tissue interface at the marked sites. Muscle thicknesses were taken at nine sites from the anterior and posterior surfaces of the body as described previously by Abe et al. (Reference Abe, Kondo, Kawakami and Fukunaga7). The sites included the lateral forearm, anterior and posterior upper arm, abdomen, subscapular, anterior and posterior thigh, anterior and posterior lower leg. Nine anatomical landmarks for the sites are noted as follows: lateral forearm is on the anterior surface, 30 % proximal between the styloid process and the head of the radius; anterior and posterior upper arm is on the anterior and posterior surfaces, 60 % distal between the lateral epicondyle of the humerus and the acromial process of the scapula; abdomen is at a distance 2–3 cm to the right of the umbilicus; anterior and posterior thigh is on the anterior and posterior surfaces, midway between the lateral condyle of the femur and the greater trochanter; and anterior and posterior lower leg is on the anterior and posterior surfaces, 30 % proximal between the lateral malleolus of the fibula and the lateral condyle of the tibia. The muscle thickness was measured directly from the screen using calipers and determined to be the distance from the adipose tissue–muscle interface to the muscle–bone interface (Fig. 2). The reliability of image reconstruction and distance measurements were confirmed by comparing the ultrasonic and manual measurements of tissue thicknesses in human cadavers, and the CV of this muscle thickness measurement from test–retest analysis was 1 %(Reference Fukunaga, Mastuo and Ishida10).

Fig. 2 Ultrasonographic image of the posterior region of the upper arm. AT, subcutaneous adipose tissue; SM, skeletal muscle tissue.
The predicted four regional SM masses were then calculated from ultrasound equations based on adult males and females, respectively (Table 2)(Reference Sanada, Kearns, Midorikawa and Abe6). Total body SM mass value was the sum of the four regional SM mass values. The parameters of the ultrasound-prediction equation for SM mass were determined as muscle thickness in cm × standing height in m.
Table 2 The adult predicted equations for skeletal muscle mass (kg) of regional segments(Reference Sanada, Kearns, Midorikawa and Abe6)
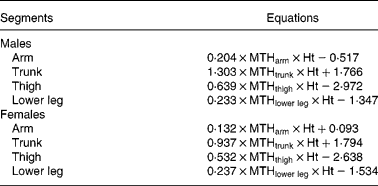
MTH, muscle thickness (cm); Ht, standing height (m).
Statistics
All results are presented as mean values and standard deviations. The difference between the measured SM mass and the predicted SM mass was examined using paired t tests. Agreement of SM mass between the measured and predicted values was further examined by plotting the difference in predicted values against the mean with limits of agreement (mean difference ± 2 sd of the differences; the 95 % limits of agreement, which gives an indication of the precision of the method), as suggested by Bland & Altman(Reference Bland and Altman11). Statistical analyses were performed using SPSS for Windows (version 14.0J; SPSS Inc., Chicago, IL, USA) and differences were regarded as significant when the probabilities were < 0·05.
Results
The physical characteristics and muscle thicknesses measured by ultrasound are shown in Table 1. The mean values of height and weight, which influenced the variability of SM mass, were comparable with the physical fitness standards of Japanese people(12), and the results indicated that the mass and distribution of SM for subjects in the present study were mostly representative of Japanese prepubertal children and adolescents.
The measured total body SM mass by MRI was 20·0 (sd 3·1) kg for adolescent boys, 14·6 (sd 1·8) kg for adolescent girls and 17·4 (sd 3·8) kg for all adolescents, not significantly different from the predicted total body SM mass by ultrasound of 20·8 (sd 3·3), 13·9 (sd 1·0) and 17·5 (sd 4·3) kg, respectively (Table 3). Moreover, the measured regional SM mass for adolescents was also not significantly different compared with the predicted regional SM mass for boys, girls, and all subjects (Table 3). However, there were a number of pairs between the measured and predicted SM mass in total and regional segments that were significantly different for prepubertal children (Table 3).
Table 3 The measured and predicted skeletal muscle (SM) mass in total and regional segments for prepubertal children and adolescents
(Mean values and standard deviations)

* Total body SM mass = arm+trunk+thigh+lower leg SM mass.
Bland–Altman analysis for all prepubertal children and adolescents did not indicate a bias in prediction of the total body and regional SM mass except for the thigh and lower leg segments for adolescents (Fig. 3). The 95 % limits of agreement between the measured and predicted SM mass in total and regional segments were relatively large both in prepubertal children and adolescents (Table 4, Fig. 3).

Fig. 3 Bland–Altman analysis for total body (A), arm (B), trunk (C), thigh (D) and lower leg (E) skeletal muscle (SM) mass (kg) in adolescent boys (●; n 11) and adolescents girls (○; n 10) (—) and in prepubertal boys (▲; n 6) and prepubertal girls (△; n 4) (…). Total body SM mass = arm+trunk+thigh+lower leg SM mass. For total body SM for adolescents, r 0·17 (NS); for prepubertal children, r − 0·26 (NS). For arm SM for adolescents, r 0·06 (NS); for prepubertal children, r 0·40 (NS). For trunk SM for adolescents, r 0·11 (NS); for prepubertal children, r − 0·12 (NS). For thigh SM for adolescents, r 0·49 (P < 0·05); for prepubertal children, r 0·02 (NS). For lower leg SM for adolescents, r 0·47 (P < 0·05); for prepubertal children, r − 0·54 (NS).
Table 4 Bias and 95 % limits of agreement for the measured and predicted skeletal muscle (SM) mass in total and regional segments for prepubertal children and adolescents

* Bias = predicted SM mass − measured SM mass.
† Total body SM mass = arm+trunk+thigh+lower leg SM mass.
Discussion
Currently, there are very few effective methods to accurately and non-invasively estimate SM mass in prepubertal children and adolescents. Under these conditions, the results from the present study indicated that adult ultrasound-derived prediction equations are useful for estimating total SM mass for adolescents at the group level, even though there was a relatively large range of the 95 % limits of agreement, which suggested limited reliability at the individual level. Among previous studies, prediction equations of total SM mass specific to children, using MRI measurements as the reference data, have only been reported by Kim et al. (Reference Kim, Shen, Gallagher, Jones, Wang, Wang, Heshka and Heymsfield13). The previously published study had reported that MRI-measured total SM mass for adolescents (average age 14·9 (sd 2·0) years for boys and 15·1 (sd 1·3) years for girls) was 27·4 (sd 5·9) kg for boys and 18·2 (sd 2·9) kg for girls, which was predicted well by the adult dual-energy X-ray absorptiometry model with high estimation accuracy (27·4 kg for boys and 18·0 kg for girls calculated from the average value in Kim et al. (Reference Kim, Shen, Gallagher, Jones, Wang, Wang, Heshka and Heymsfield13)). Although the estimation accuracy of the present study might be not quite as good as the previous study, the ultrasound-derived prediction total SM mass equation for adolescents still holds a great deal of potential as a technique for assessing SM in field settings.
Another original point of our ultrasound-derived SM mass prediction equations is that the measured regional SM mass for adolescents was not significantly different to the predicted regional SM mass for boys, girls, and all subjects. It has been used in the past for estimating the cross-sectional area of arm and calf bone-muscle regional SM tissue during growth(Reference Tanner, Hughes and Whitehouse2, Reference Boye, Dimitriou, Manz, Schoenau, Neu, Wudy and Remer14), but there was no method of predicting the volume of regional SM. In addition, even dual-energy X-ray absorptiometry methodologies are not capable of an accurate separation of SM mass from the trunk region. Therefore, these ultrasound-derived prediction equations are the first reported method for estimating regional SM mass in adolescents at the group level.
On the other hand, the adult ultrasound-SM prediction model was not valid for prepubertal children at the group or individual level in the present study. The reason for differences of applicability for predicting SM mass in prepubertal children and adolescents was unclear, but one possible explanation may be attributed to the maturation of SM mass. According to a previous study that estimated total SM mass for Japanese adults using MRI, the SM mass:standing height ratio (i.e. index of SM maturation), which influenced the variability of SM mass, was 13·0 kg/m for adult males and 8·4 kg/m for adult females (combined 10·7 kg/m)(Reference Abe, Kearns and Fukunaga5). Our data demonstrated that the total SM mass:height ratio was 12·1 kg/m for adolescent boys and 9·4 kg/m for adolescent girls (combined 10·8 kg/m), similar to the values for Japanese adults. However, in the case of the prepubertal children, the adult ultrasound-SM prediction model for prepubertal children in the present study, the ratios (boys, 7·0 kg/m; girls, 7·7 kg/m; combined, 7·3 kg/m) did not approach adult values.
Similarly, Kim et al. (Reference Kim, Shen, Gallagher, Jones, Wang, Wang, Heshka and Heymsfield13) found that an adult dual-energy X-ray absorptiometry-SM prediction model was applicable to adolescents (average age 14·9 years for boys and 15·1 years for girls) as mentioned above, but not in younger children aged 5–14 years. The total SM mass:height ratios in that study reported the ratios for adolescents (boys, 15·8 kg/m; girls, 11·3 kg/m; combined, 13·6 kg/m) to be relatively similar to adult values (adult males, 17·9 kg/m; adult females, 12·2 kg/m; combined, 15·1 kg/m). However, the ratios for children aged 5–14 years (boys, 8·8 kg/m; girls, 8·2 kg/m; combined, 8·5 kg/m) were approximately only half of the adult values. Based on the present results and previous findings, the SM prediction model for adults may only be applicable in adolescents near the age of 14 years, which is over Tanner stage 2 and at peak height velocity.
In summary, mean values between measured and predicted total and regional SM mass were not significantly different for adolescents, but not as favourable for prepubertal children. However, there is a relatively large range of the 95 % limits of agreement in both prepubertal children and adolescents. These results suggest that the adult ultrasound-derived prediction equations(Reference Sanada, Kearns, Midorikawa and Abe6) are useful for estimating total and regional SM mass for adolescents at the group level. Moreover, the present study has meaning as a potential pioneer of predicting total and regional SM mass for prepubertal children and adolescents. However, the relatively high degree of variability suggests limited usability at the individual level in both prepubertal children and adolescents. Furthermore, because of the small sample size, it was difficult to generalise the findings in the present study to all Japanese children and adolescents. Therefore, a larger study for developing a SM mass prediction model at the individual level is needed in prepubertal children and adolescents.
Acknowledgements
Heartfelt thanks are due to the subjects who participated in the present study and their guardians. The authors thank Dr Michael G. Bemben, University of Oklahoma, for his helpful comments and suggestions for the development of the manuscript. The present study was supported in part by The Ministry of Education, Science, Sports and Culture of Japan (grant no. 18800054). There is no conflict interest on the part of any of the authors. The contribution of each author to the manuscript was as follows: T. M. drafted the paper and did the data analysis; K. S. and A. Y. contributed to the drafting of the paper; T. A. designed the study.


