


Lipids are a major metabolic energy resource, but they also have an important structural role in the process of fish gonad development(Reference Izquierdo, Fernandez-Palacios and Tacon1,Reference Johnson2 ). The essential lipids for fish gonad development can be acquired from diet or mobilised from other tissues(Reference Wiegand3). Fish gonadal development and reproductive performance are affected by certain dietary nutrients, especially by lipids and fatty acids. For example, fecundity, oocyte diameter, number of mature oocytes and hatching rate can be improved by optimising dietary lipid levels(Reference Masrizal and Zein4) and utilising appropriate lipid sources(Reference Fernández-Palacios, Izquierdo and Robaina5,Reference El-Sayed, Mansour and Ezzat6 ). Furthermore, highly unsaturated fatty acids (n-3 and n-6) are also important for fish reproduction(Reference Liang, Lu and Qian7–Reference Luo, Ai and Li9).
To date, transcriptomics, proteomics and metabolomics have become the three most commonly used techniques in nutrition and physiology-based ‘omics’ research aimed at the understanding and characterisation of numerous biological processes associated with nutrition and diet(Reference Beale, Karpe and Ahmed10). The integration of transcriptomics and metabolomics in a single study for improved understanding of the underlying biology, and further insights into the mechanistic aspects of the system and the related methodology, has been reviewed(Reference Cavill, Jennen and Kleinjans11). Transcriptomics(Reference Chi, Gao and Hu12,Reference Gao, Zhang and Zhang13 ) and metabolomics(Reference Zhou, Zhao and Guan14), separately or in combination(Reference Xu, Du and Li15), have also been applied to identify the key signalling pathways and gene regulation networks affecting fish ovarian steroid hormones and ovarian development, and to better understand the complex process of fish reproduction.
Chinese sturgeon (Acipenser sinensis), an anadromous migratory fish distributed in the Yangtze River and East China Sea, is endangered due to overfishing and habitat degradation(Reference Zhuang, Kynard and Zhang16). Broodstock culture and artificial breeding of Chinese sturgeon have already been developed in China to restock the depleted wild populations. However, as opposed to males, which easily reach sexual maturity in captivity(Reference Wei, Li and Du17), few females reach stages III or IV of ovary development in captivity(Reference Zhou, Xu and Deng18,Reference Du, Zhang and Leng19 ), which severely hampers the efforts to breed this species. Studies have been conducted to improve the reproductive performance of Chinese sturgeon, including nutrient composition analyses of ovaries and eggs(Reference Li and Shen20,Reference Song, Zhuang and Zhang21 ), hormonal regulation(Reference Yue, Ye and Chen22), identification of differentially expressed genes (DEG) involved in gonadal differentiation and analysis of germ cell markers(Reference Ye, Li and Yue23–Reference Li, Gan and Chen25). It has been suggested that lipid accumulation during stages II and III of ovary development is vital for the reproductive performance of female Chinese sturgeon broodstocks(Reference Zhou, Leng and Tan26). Feeding Chinese sturgeon with seawater fish promoted ovary maturation and synchronous spawning(Reference Wei, Li and Du17). However, how dietary lipid affects the ovary development of Chinese sturgeon remains poorly understood. Therefore, the aim of this study was to investigate the effects of different dietary lipid levels on the ovary development of Chinese sturgeon and the related regulatory mechanisms. This was achieved via a periodic determination of growth performance, ovarian development status, serum biochemistry parameters, hormone levels and a combination of ovarian transcriptome analysis and serum metabolome analysis after 18 months of feeding trial. The results of this study will contribute to our knowledge of the reproductive biology of fish and facilitate captive breeding of Chinese sturgeon.
Experimental methods
Experimental design
Experimental diets
Three isonitrogenous experimental diets (46·5 % crude protein) were formulated to contain different lipid levels: L10 = 9·79 %, L14 = 13·96 % and L18 = 18·04 %. Fish meal, soyabean meal and chicken meal were used as protein sources, and fish oil and soyabean oil were used as main lipid sources. Lipid levels were manipulated by adding different levels of fish oil. Ingredients and proximate composition of the experimental diets are given in online Supplementary Table S1. Slow-sinking extruded feed with a cylindrical pellet (10 mm in diameter and 16 mm in length) was manufactured at Wuhan Coland Feed Co., Ltd.
Experimental fish and sample collection
The experimental fish were F1 generation of Chinese sturgeon, offspring of wild broodstock, which were cultured at the facilities of the Yangtze River Fishery Research Institute located near Jingzhou, Hubei Province. We selected seventy-two specimens (average body weight, 50·95 kg; average body length, 168·34 cm) with an average age of 10 years and gonads in developmental stage II. Gonad development was assessed using ultrasound imaging, in which the shape and echogenicity of the gonad and gonadal fat, the thickness of the whole reproductive organs (d) and the proportion of the ovary to the whole reproductive organs (p o) were the main ultrasonographic characteristics, as those are the best indicators of sex and gonadal maturity(Reference Du, Zhang and Leng19). Specimens were divided into three groups randomly (n 24 per group; female:male = 1·4:1) and cultured in a flow-through system, with a water flow rate of 3 litres/s, pH value of 7·0–8·0 and dissolved oxygen maintained between 6·5 and 7·5 mg/l. Fish were fed one of the three experimental diets at 0·2–1·5 % body weight, adjusted according to seasonal temperature fluctuations as previously described(Reference Wei, Li and Du17).
The experiment lasted 24 months, with physical examination and sample collection conducted twice a year: early spring and mid-autumn. This included growth index measurements, ultrasound imaging and sampling of blood, muscle and gonad tissues, conducted as described by Du et al.(Reference Du, Zhang and Leng19). Blood samples were taken from ten females in each group and centrifuged at 3000 g for 10 min to collect serum samples for biochemical analysis, and gonad and muscle samples were collected from five females per group for RNA extraction and histological analysis. Besides, after 18 months of feeding trial, serum samples were taken for metabolomic analyses, and stage II ovaries were collected from each group and pooled as one sample for transcriptome analysis.
Sample analysis
Diet composition, histological observation and serum biochemical analysis
Moisture, crude protein, crude fat and ash of the experimental diets were determined using standard methods(27). Gonadal development stages were examined according to ultrasound images or histological studies(Reference Du, Zhang and Leng19). For histological observation, gonad samples were sectioned at 5 μm and stained with haematoxylin–eosin(Reference Qu, Sun and Wan28). Muscle samples were sectioned at 8 μm and stained with oil-red O. The relative area (%) of lipid droplets in oil-red O staining was analysed by Image-Pro Plus 6.0(Reference Mehlem, Hagberg and Muhl29).
For serum biochemical analysis, oestradiol (E2) levels were measured by double antibody 125I RIA(Reference Sulikowski, Tsang and Howell30) using commercial kits from the North Institute of Biotechnology. Biochemical indices of serum samples, including TAG (glycerine phosphate oxidase peroxidase (GPO-PAP) method), total cholesterol (chemical colorimetry) and urea N (urease-glutamate dehydrogenase method), were determined using an automated biochemical analyser (Beckman) with commercial reagent kits.
Serum metabolomics
Serum sample (40 µl) was added to an Eppendorf tube with methanol (120 µl), vortexed for 1 min, precipitated for 30 min at –20°C and centrifuged at 4000 g for 20 min at 4°C to precipitate the proteins. Protein-free supernatant (25 µl) was collected and diluted with 50 % methanol (225 µl). Then, 20 µl of each diluted sample was pooled as the quality control (QC) sample; 60 µl of each diluted sample was used as the detection sample for metabolite analysis through chromatographic separation and MS detection.
Chromatographic separation was performed using an ultra-performance liquid chromatography system (2777C; Waters) with an ACQUITY UPLC BEH C18 analytical column (100 × 2·1 mm, 1·7 μm; Waters). The column oven was maintained at 50°C. The flow rate was 0·4 ml/min, and the mobile phase consisted of solvent A (water + 0·1 % formic acid) and solvent B (acetonitrile + 0·1 % formic acid). Gradient elution conditions were set as follows: 0–2 min, 100 % phase A; 2–11 min, 0–100 % B; 11–13 min, 100 % B; 13–15 min, 100 % A. The injection volume for each sample was 10 µl.
The metabolites eluted from the column were then detected by high-resolution tandem MS SYNAPT G2 XS QTOF (Waters), operated in both positive- and negative-ion modes. Capillary voltages were set at 2 and 1 kV for positive and negative modes, respectively. Sampling cone voltages were set at 40 V both for positive and negative modes. MS data were acquired in Centroid MSE mode. TOF mass range was from 50 to 1200 Da, and scan time was 0·2 s. During acquisition, the leucine-encephalin signal was acquired every 3 s to calibrate mass accuracy. Furthermore, QC samples were periodically analysed throughout an analytical run in order to provide robust quality assurance for each metabolic feature detected. Ten QC samples were run before the first serum sample and a QC sample was run after every ten samples; three QC samples were run at the end to calibrate for the drift in the retention time of all analyses due to the matrix effect.
Raw data acquired from UPLC-MS were converted to NetCDF format and then imported into Progenesis QI software (version 2.0) to construct a matrix of mass-to-charge ratio (m/z) v. retention time v. ion intensity for chemometric analyses. QC-based robust LOESS signal correction method was employed to correct the extracted data. In addition, relative standard deviation was calculated for all metabolic features in QC samples, and metabolic features with relative standard deviation >30 % were removed to ensure metabolic quality assurance. In order to adjust the importance of high and low abundance metabolites to an equal level, the data were preprocessed by conversion of log2 and variance-scaling prior to univariate and multivariate analysis(Reference Dunn, Broadhurst and Begley31).
Univariate analysis was performed by the method of t test and fold-change (FC) analysis using R language analysis package(Reference Wen, Mei and Zeng32). During statistical analysis, the P value was acquired from the t test and was corrected using the false discovery rate method to get the q value. The acquired data were processed by principal component analysis and partial least squares–discriminate analysis for multivariate analysis. Partial least squares–discriminate analysis was used to establish a relational model between experimental samples and the higher abundance amount to create a model prediction for the different samples, and the results were visualised in the form of score plots in order to display group clusters. Q 2 (predicted variation) and R 2 (explained variation) parameters were used to evaluate the models. In addition, the corresponding influence intensity and explanation capacity of each metabolite’s higher abundance mode effects for sample groups can be estimated by the value of variable importance of projection. Differential metabolites in the serum of different treatment groups were selected according to the following criteria: a variable importance of projection value >1, a q value <0·05 and a FC value >1·2 or <0·8. Metabolic pathway analyses were performed using Kyoto Encyclopedia of Genes and Genomes (KEGG) database (http://www.kegg.jp/).
Gonad transcriptome analysis
Total RNA was extracted using the TRIzol reagent (Invitrogen) following the manufacturer’s instructions. Total RNA quality was assessed using Agilent 2100 Bioanalyzer system, and samples with a RNA integrity number >9 were used for RNA library construction.
Three libraries from experimental groups were constructed with the mRNA-Seq Sample Preparation Kit (Illumina) as described by Liu et al.(Reference Liu, Qiao and Jiang33). Briefly, mRNA was purified from total RNA using oligo (dT) magnetic beads and then broken into short fragments using a fragmentation buffer. Then, cDNA was synthesised using mRNA fragments as templates. Short fragments were purified and resolved with EB buffer for end reparation and single nucleotide (A – adenine) addition. The suitable fragments were selected for PCR amplification, and PCR products were purified for constructing sample library, the quality of which was assessed with the Agilent Bioanalyzer 2100 system. The library was sequenced on the Illumina HiSeq 4000 platform (BGI).
Clean reads of high quality were obtained by removing reads containing adaptor, reads with ambiguous ‘N’ nucleotides (with ‘N’ >5 %) and low-quality reads (the percentage of base whose quality is <15 % is >20 % in reads). Clean reads were then assembled using Trinity software as described by Grabherr et al.(Reference Grabherr, Haas and Yassour34) to obtain unigenes. Then, unigenes were compared by Blastx (E value < 10–5) to NT, NR, Cluster of Orthologous Groups, KEGG and Swissprot databases(Reference Altschul, Gish and Miller35). Gene Ontology (GO) functional annotation was accomplished with Blast2GO software(Reference Conesa, Götz and García-Gwmez36), and InterPro annotation was carried out by Interproscan5(Reference Quevillon, Silventoinen and Pillai37).
Clean reads were mapped to unigenes using Bowtie2(Reference Langmead and Salzberg38), and then gene expression level was calculated by the RSEM method(Reference Li and Dewey39). The detection of DEG was performed by DEseq2 as described by Love et al.(Reference Love, Huber and Anders40), and the genes with an absolute value of log2 (FC) ≥ 1 and adjusted P value ≤ 0·05 were considered significantly differentially expressed between groups. All DEG were mapped to the GO and KEGG databases to conduct pathway and GO functional enrichment analyses.
Sixteen genes involved in oocyte growth, lipid transport, vitellogenesis, cholesterol biosynthesis pathway and steroid hormone biosynthesis pathway were selected to verify the RNA-Seq data by quantitative PCR (qPCR). Total RNA from three groups (n 3; three fish were sampled for each group) was extracted as described above. Total RNA was quantified spectrophotometrically, and the integrity was assessed by agarose gel electrophoresis. cDNA was synthesised using PrimeScriptTM RT Reagent Kit with gDNA Eraser (TakaRa). qPCR was carried out in a quantitative thermal cycler (MyiQTM 2 TwoColor Quantitative PCR Detection System; Bio-Rad) in a 20-µl reaction volume containing 10 µl SYBR® Green Real-Time PCR Master Mix (TOYOBO), 2 µl diluted cDNA (5-fold), 10 mm each of forward and reverse primers (0·8 µl each) and 6·4 µl double-distilled H2O. Primers are given in online Supplementary Table S2. qPCR parameters consisted of initial denaturation at 95°C for 30 s, followed by forty cycles at 95°C for 5 s, 57°C for 10 s and 72°C for 15 s. The expression levels of each tested gene were normalised to the expression level of β-actin and calculated by the 2–ΔΔCT method.
Statistics
Data were analysed using one-way ANOVA to detect the significance among three groups and four sample times; means were compared using Duncan’s multiple range tests with SPSS (version 19.0; SPSS Inc). Data were expressed as means with their standard errors, and P values < 0·05 were considered statistically significant. Log2 values (FC) between two compared groups were calculated to facilitate comparison with transcriptome data.
Results
Growth performance, gonadal development and muscle histology
During the 24-month-long feeding trial, the body weight of sturgeons in the L18 group remained stable, and the weight gain rate was very low, while body weights of fish in the L10 and L14 groups increased gradually during the feeding trial. Weight gain rate in the L10 group was significantly higher than in the L18 group (Table 1). The maturity stages of ovaries (inferred using ultrasound imaging) varied among the three groups after 12 months (Table 2). The L10 group exhibited very limited gonad development, with no specimens reaching stage II+ after 24 months. The L14 group exhibited slightly better results, with two specimens reaching stage II+ after 18 months. The L18 group exhibited the best results, with four specimens developing their ovaries into later stages after 24 months: two were at stage III after 12 months, one at stage III+ after 18 months and one at stage IV after 24 months (Table 2; Fig. 1(A), (B) and (C)).
Table 1. Effect of dietary lipid levels on growth performance*
(Mean values and standard deviations)
L10, 9·79 % lipid; L14, 13·96 % lipid; L18, 18·04 % lipid.
* n represents the number of weighed fish for average weight in each group. Average weight data are presented for the initial, final (24 months) and three interim time points. The weight gain rate of the 24-month period was calculated as follows: weight gain rate (%) = 100 × (weight at 24 months – initial weight)/initial weight.
a,b Mean values within a column with unlike superscript letters were significantly different (P < 0·05).
Table 2. Ovary development of Chinese sturgeon fed diets containing graded levels of lipids*
(Percentages and numbers)
L10, 9·79 % lipid; L14, 13·96 % lipid; L18, 18·04 % lipid.
* The values in each cell in the table are given as percentages of female at the specific stage in total female fish of the treatment (%) and absolute numbers of females (n) at different developmental stages at a certain time point.
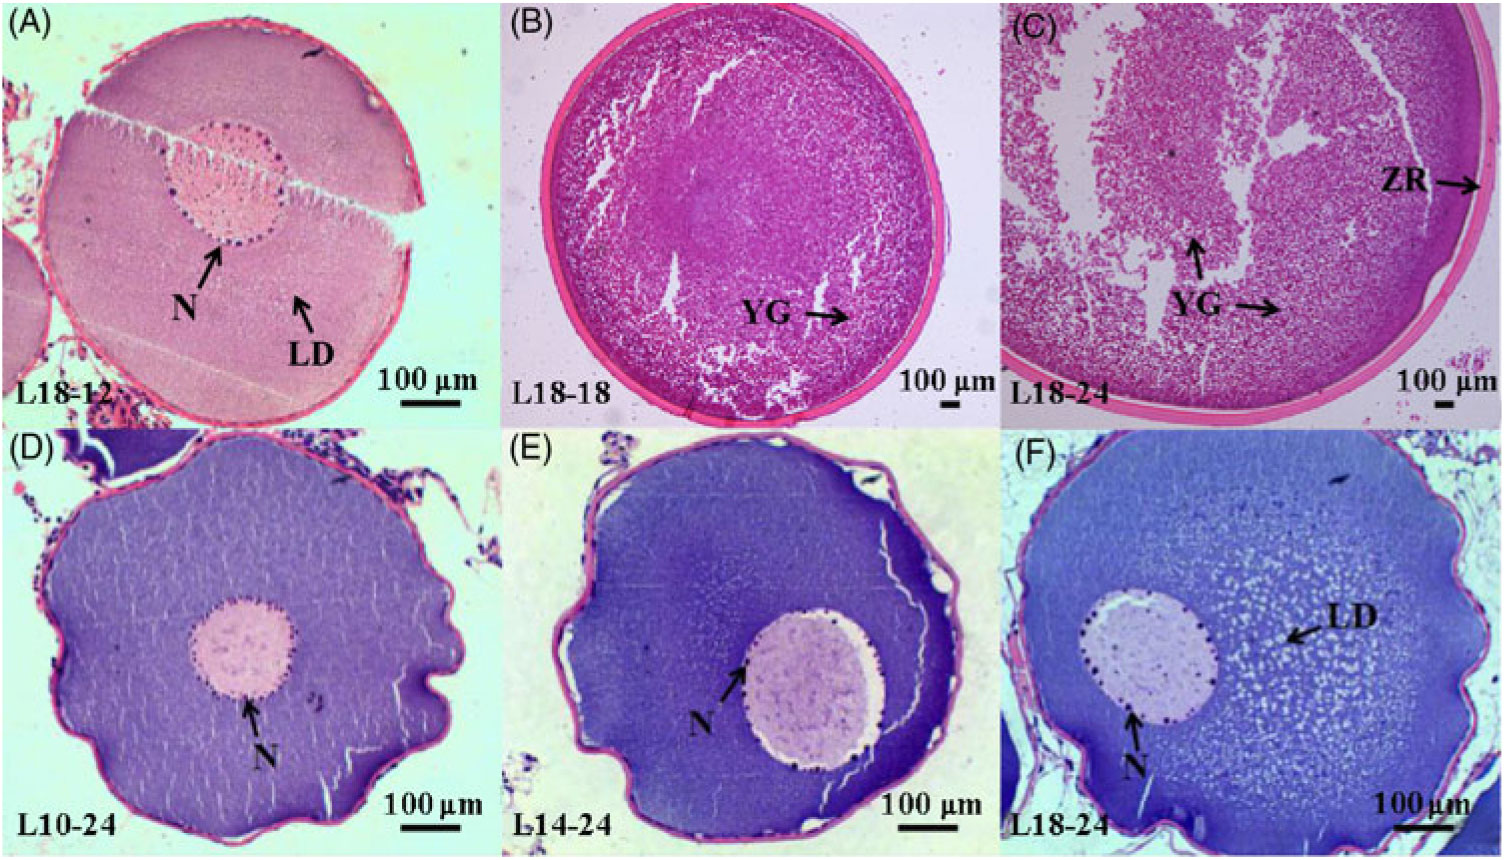
Fig. 1. Histology of oocytes at different developmental stages under different dietary treatments. (A–C) Oocytes at stages II, III and IV in the 18·04 % lipid (L18) group at 12, 18 and 24 months, respectively. (D–F) Oocytes at stage II from the 9·79 % lipid (L10), 13·96 % lipid (L14) and L18 groups at 24 months, respectively. LD, lipid droplet; N, nucleoli; YG, yolk globule; ZR, zona radiata.
Furthermore, among the ovaries at stage II at the end of the experiment (24 months), histological examination showed that the average oocyte diameter in the L18 group was significantly higher than in L10 and L14 groups (P < 0·05) (Fig. 2). The L18 group also exhibited a significant increase in the amount of lipid droplets in the ooplasm (Fig. 1(D), (E) and (F)).
Fig. 2. Diameters of oocytes at developmental stage II in three experimental groups at the 24-month time point. Three fish specimens with ovaries at stage II were sampled from each group, and the diameter of four oocytes from each ovary was measured. Values are means, with their standard errors represented by vertical bars (n 12). a,b Mean values with unlike letters were significantly different (P < 0·05). L10, 9·79 % lipid; L14, 13·96 % lipid; L18, 18·04 % lipid.
The results of oil-red O staining in muscles showed that the amount of lipid droplets was negatively correlated with dietary lipid level and feeding time after 12 months (P < 0·05) (Figs. 3 and 4). The amount of lipid droplets in muscles was significantly lower in the L18 group than in the L10 and L14 groups at 24 months (P < 0·05). Meanwhile, the amount of lipid droplets was significantly (P < 0·05) reduced between 12- and 18-month time points in L10 and L14 groups, and between 12- and 24-month time points in the L18 group.
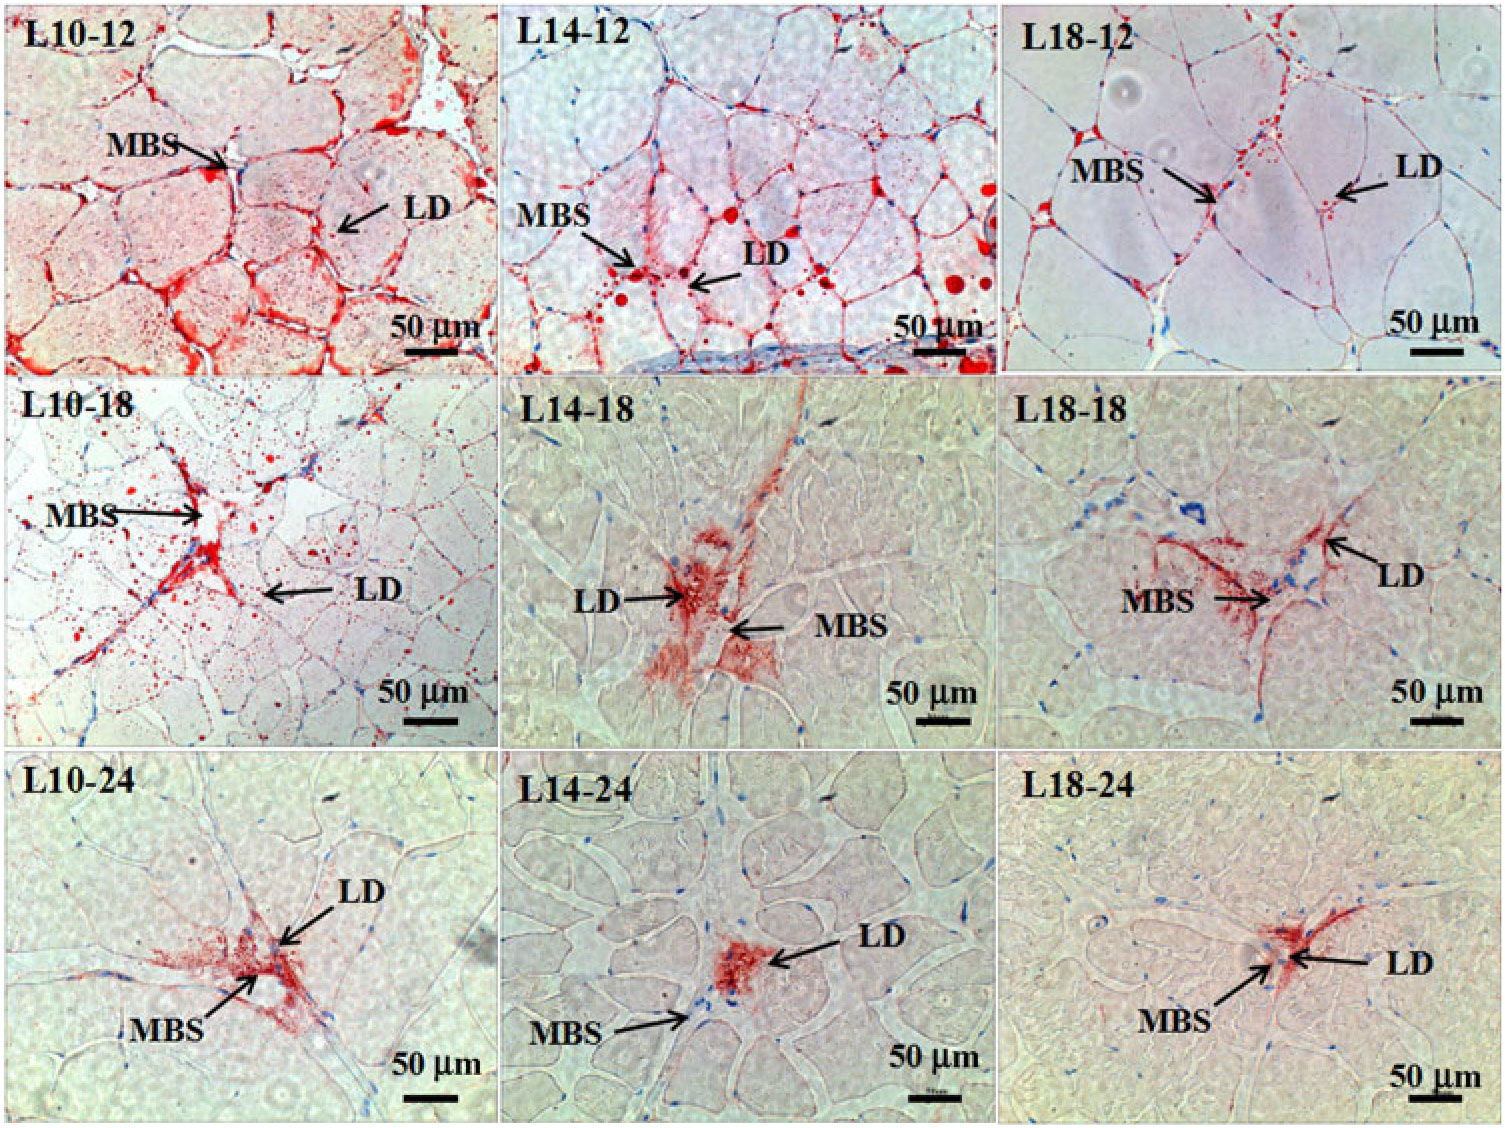
Fig. 3. Muscle histology (oil-red O staining, magnification ×200, bars 50 μm) at three time points in all three groups. Sample identities are shown in the upper-left corners; experimental groups: 9·79 % lipid (L10); 13·96 % lipid (L14); 18·04 % lipid (L18); sample time: 12, 18 and 24 months. LD, lipid droplet; MBS, muscle blood sinus.
Fig. 4. Relative areas (%) of lipid droplets in oil-red O-stained muscles in three different groups. Values are means, with their standard errors represented by vertical bars (n 12; four fish were sampled for each group at each time point, and three microscopic fields randomly examined for each sample). a,b,c Mean values with unlike letters were significantly different among groups with different dietary lipid levels (P < 0·05). A,B Mean values with unlike letters were significantly different among sampling time points (12, 18 and 24 months) for the same dietary lipid level. ![]() 9·79 % lipid (L10);
9·79 % lipid (L10); ![]() 13·96 % lipid (L14);
13·96 % lipid (L14); ![]() 18·04 % lipid (L18).
18·04 % lipid (L18).
Serum biochemistry
Serum E2 levels showed a gradually increasing trend during the experimental period in the three groups, and a significantly higher level of E2 was observed in the L14 group compared with the L10 and L18 groups at the first three sampling time points (P < 0·05) (Fig. 5(A)). Serum TAG levels declined after 18 months, but the L18 group exhibited a higher level of serum TAG compared with the L10 and L14 groups during a part of the experimental period (Fig. 5(B)). Serum cholesterol levels were very similar among the three groups at all studied time points: high at 6 months, followed by a notable drop at the remaining sampling times (Fig. 5(C)). Urea N level showed a decreasing trend both temporally and with increasing dietary lipid levels (Fig. 5(D)).
Fig. 5. Changes in (A) oestradiol, (B) TAG, (C) cholesterol and (D) urea nitrogen levels in the serum of female sturgeons fed three different dietary lipid levels. Values are means, with their standard errors represented by vertical bars for n 4 (four fish were sampled from each group at each time point). a,b,c Mean values with unlike letters were significantly different among three groups at each sampled time point. A,B,C Mean values with unlike letters were significantly different among time points for the same dietary lipid level. ![]() 9·79 % lipid (L10);
9·79 % lipid (L10); ![]() 13·96 % lipid (L14);
13·96 % lipid (L14); ![]() 18·04 % lipid (L18).
18·04 % lipid (L18).
Serum metabolic profiles
Raw data analysis
After preprocessing the acquired data, 6290 metabolite peaks (3546 peaks in ESI+ mode and 2744 peaks in ESI– mode) were selected from the final data table for subsequent analysis. The principal component analysis score plot showed three clusters for the data obtained from three groups in positive- and negative-ion scan modes (online Supplementary Fig. S1), but the L18 group exhibited somewhat different tendencies than the other two groups. Besides, partial least squares–discriminate analysis score plots showed an obvious separation between the L18 group and the remaining two groups: L10 (online Supplementary Fig. S2(A) and (B)) and L14 (online Supplementary Fig. S2(C) and (D)). This suggested that significant differences in metabolites existed between the L18 group and the other two groups.
Screening and identification of differentially regulated metabolites
There were ninety-one metabolites significantly up-regulated and five metabolites significantly down-regulated in L18 group compared with L14, whereas 198 metabolites were significantly up-regulated and sixty-four were significantly down-regulated in L18 compared to L10. There were no differentially regulated metabolites between L14 and L10 groups (Fig. 6(A)). Based on KEGG analysis, sixteen differentially regulated metabolic pathways were detected between L18 and L10 groups. These included arachidonic acid (ARA) metabolism, steroid hormone biosynthesis, terpenoid backbone biosynthesis, biosynthesis of unsaturated fatty acids, purine metabolism, etc. Five differentially regulated metabolic pathways were detected between L18 and L14 groups, including porphyrin metabolism, ubiquinone and other terpenoid-quinone biosynthesis, terpenoid backbone biosynthesis, purine metabolism and glutathione metabolism (Fig. 6(C)).
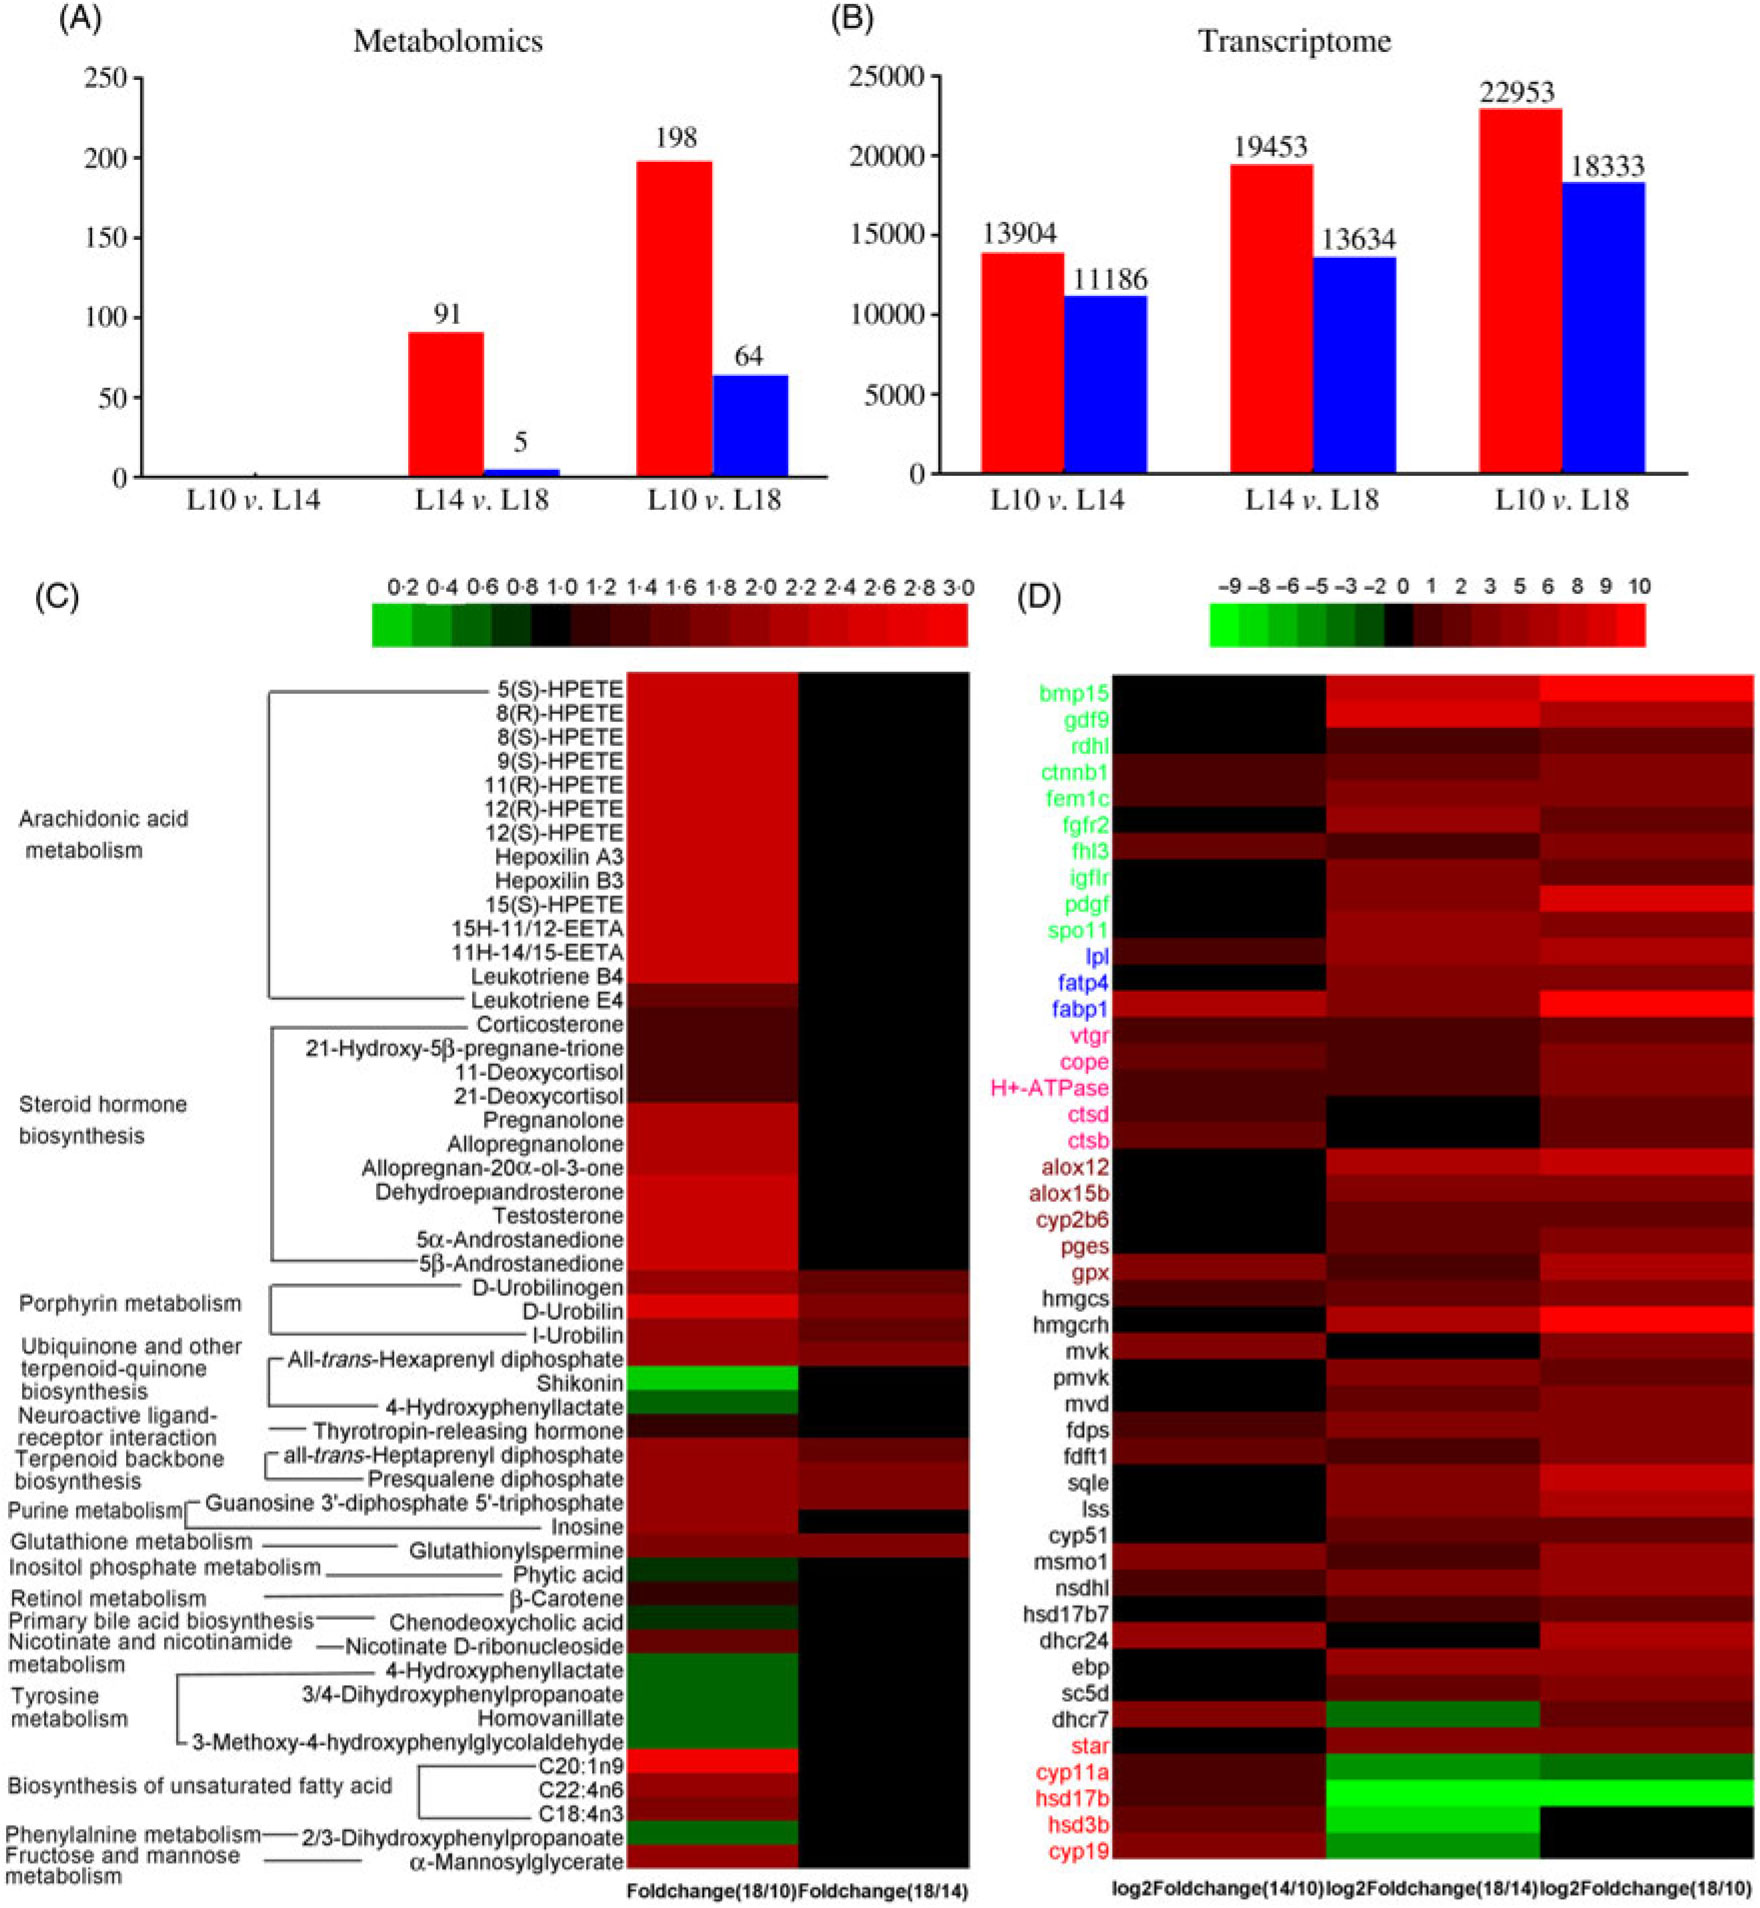
Fig. 6. Screening of metabolites and unigenes differentially expressed among the three groups. (A) Differentially expressed metabolites. (B) Differentially expressed unigenes. (C) Heat map of differentially expressed metabolites with Kyoto Encyclopedia of Genes and Genomes (KEGG) pathway annotation. (D) Heat map of differentially expressed unigenes involved in key pathways for gonad development. Colours in panel D correspond to different gene functions: genes with green, blue and pink colour are involved in oocyte growth, lipid deposition and vitellogenesis, respectively. Genes with brown, black and red colour are involved in arachidonic acid metabolism, terpenoid backbone and steroid biosynthesis, and ovarian steroidogenesis pathways, respectively. (A, B)  , Up-regulated;
  , down-regulated. L10, 9·79 % lipid; L14, 13·96 % lipid; L18, 18·04 % lipid.
Gonad transcriptome analysis
Illumina sequencing and sequence assembly
A total of three RNA samples, extracted from gonad tissues from the L10, L14 and L18 groups, were subjected to RNA sequencing (RNA-Seq), generating 44·39, 42·06, and 44·53 million clean reads, respectively (online Supplementary Table S3). Among these, 96·51 % clean reads had quality scores ≥Q20 (the base quality score of 20 means an error probability of 1 %, based on PHRED base-calling software). A total of 200 368 unigenes were identified using the Trinity assembly programme (online Supplementary Table S4). The mean unigene size and N50 were 706 and 1405 bp, respectively. The length distribution of all unigenes is shown in online Supplementary Fig. S3. All reads have been submitted to the Sequence Read Archive at NCBI under the Accession Number SRP130246.
Functional annotation and pathway assignment
A total of 200 368 unigenes were annotated to seven databases: Non-redundant protein (Nr), Non-redundant nucleotide (Nt), Swissprot, KEGG, Cluster of Orthologous Groups, InterPro and GO (online Supplementary Table S5). The overall annotation ratio of all unigenes was 53·66 %. In GO annotation, 15 430 unigenes were classified into three major functional categories (‘biological process’, ‘cellular component’ and ‘molecular function’) (online Supplementary Fig. S4). The terms ‘cellular process’ and ‘metabolic process’, ‘cell’ and ‘cell part’, ‘binding’ and ‘catalytic activity’ were dominant in the three major categories (biological processes, cellular component and molecular function, respectively). KEGG pathway analysis of 57 040 unigenes identified a diverse range of pathways, among which five most represented pathways were ‘signal transduction’, ‘global and overview maps’, ‘cancers: overview’ and ‘endocrine system’ (online Supplementary Fig. S5). Among these, ‘endocrine system’ is an important pathway in gonad development. In addition, other identified differentially regulated pathways involved in gonad development included ‘lipid metabolism’, ‘energy metabolism’ and ‘nervous system’.
Identification of differentially expressed genes
A total of 13 904 genes were significantly up-regulated and 11 186 were significantly down-regulated in L14 compared with L10; 22 953 genes were significantly up-regulated and 11 186 genes were significantly down-regulated in L18 compared with L10; and 19 453 genes were significantly up-regulated and 13 634 genes were significantly down-regulated in L18 compared with L14 (Fig. 6(B)). The results of GO functional annotation for DEG between different pairs of the three experimental groups revealed that the DEG in functional subcategories of ‘cellular process’, ‘cell’ and ‘binding’ were dominant in the main categories ‘biological process’, ‘cellular components’ and ‘molecular function’, respectively (online Supplementary Figs. S6, S7, S8). To further functionally characterise the DEG, pathway analyses were conducted using the KEGG database. The results revealed a diverse range of pathways, with 14 857 DEG between L10 and L14 assigned to 304 pathways, 24 853 DEG between L10 and L18 assigned to 306 pathways, and 21 086 DEG between L14 and L18 assigned to 306 pathways. Among these pathways, we focused on six important pathways involved in lipid metabolism, steroidogenesis and energy metabolism (online Supplementary Table S6), and a part of DEG involved in female gonad development. A heat map was constructed using the value of log2 (FC) to visualise the expression patterns of DEG involved in oocyte growth, lipid deposition, vitellogenesis, ARA metabolism, terpenoid backbone biosynthesis, steroid biosynthesis and ovarian steroidogenesis pathways among the three groups (Fig. 6(D)).
Validation of transcriptome data by quantitative PCR
The expression of sixteen genes (roughly associated with six metabolic pathways) selected from the transcriptome was verified using qPCR: oocyte growth (bmp15, dfg9), lipid deposition (lpl, fatp4, fabp1), vitellogenesis (vtgr, cstb, cstd), terpenoid backbone biosynthesis (hmgcr, lss, mvk), ARA metabolism (pges, lox12) and ovarian steroidogenesis (star, 17β-hsd, cyp19a). Among these, fourteen genes showed similar trends between RNA-Seq and qPCR analyses. Exceptions were only bmp15 (bone morphogenetic protein 15) and hmgcr (hydroxymethylglutaryl-CoA reductase) genes (online Supplementary Table S7).
Discussion
Throughout a fish’s life, the total energy available is allocated to basic metabolic requirements, somatic growth, storage and reproduction(Reference Bunnell and Marschall41). Dietary lipids also have an important role in the maturation of oocytes(Reference Bobe and Labbé42), probably by providing energy and essential fatty acids for gonad development(Reference Masrizal and Zein4,Reference Liang, Lu and Qian7 ), or as precursors of substances with endocrine roles in the induction of oocyte maturation(Reference Sorbera, Asturiano and Carrillo43–Reference Lister and Van Der Kraak45). In our study, lower WGR, higher serum TAG content (at 12 and 18 months), decreased amount of muscle lipid droplets (12 months) and better gonadal development status in the L18 group indicated that an increased amount of dietary energy was mainly employed for gonadal development (both as energy and stored lipids within the eggs). This is in agreement with the observation that muscle lipid storage gradually decreased with gonad development in wild Chinese sturgeon during migration(46). On the contrary, higher weight gain rate and relatively poor gonadal development status in the L14 and L10 groups indicated that ingested dietary energy was largely used by somatic tissues. This implies that L18 diet was most successful at promoting the gonadal development of female Chinese sturgeon. These results are in agreement with those observed in other fish species when fed high-lipid (180–200 g/kg) diets, for example, higher egg diameter in snakehead murrel(Reference Ghaedi, Kabir and Hashim47) and increased fecundity in rabbit fish (Siganus guttatus) and yellowfin sea bream(Reference Duray, Kohno and Pascual48,Reference Zakeri, Marammazi and Kochanian49 ). It has been suggested that the onset of puberty in fish is linked to absolute levels or rates of accumulation of lipid stores(Reference Taranger, Carrillo and Schulz50). However, whether a higher dietary lipid availability directly acts as a reproduction inducer signal in fish needs to be further investigated.
Urea N is one of the metabolites of protein degradation, so a decrease in urea N levels with increasing dietary lipid levels and prolongation of the feeding period suggests a decline in protein degradation for energy supply, further indicating an increase in lipid metabolism for energy supply allocated for gonad development in higher dietary lipid groups(Reference Ye, Liu and Wang51). Cholesterol is a basic substance for the biosynthesis of steroids, which can be synthesised in all steroid-producing tissues and cells, especially in ovarian tissues under hormonal regulation(Reference Payne and Hales52). Cholesterol biosynthesis from acetyl-CoA through a series of complex enzymatic steps requires the participation of numerous enzymes(Reference Sanderson53). Three rate-limiting enzymes, hydroxymethylglutaryl-CoA reductase (Hmgcr), mevalonate kinase (Mvk) and lanosterol synthase (Lss), play key roles in the cholesterol biosynthesis pathway(Reference Espenshade and Hughes54,Reference Brown and Goldstein55 ). In this study, the ovarian expression of genes encoding for these three rate-limiting enzymes, and most other genes involved in this pathway, were significantly up-regulated in L14 v. L10, and in L18 v. L14 (Fig. 6(D) and online Supplementary Fig. S9), which implies that dietary lipid ratio is in a positive correlation with the magnitude of cholesterol biosynthesis in gonads of female Chinese sturgeon. Cholesterol accumulation in stages III to IV and IV to V has been reported in gonads of Coilia nasus and Odontesthes bonariensis, respectively(Reference Xu, Du and Li15). A significant decrease in serum cholesterol contents in the three groups at later studied time points compared with the 6-month time point also suggests enhanced cholesterol utilisation by gonads in later ovary development stages.
Steroid hormones, including progestins, androgens and oestrogens, are mainly synthesised from cholesterol by endocrine glands (such as testes and ovaries) and then released into the blood to regulate the reproductive cycle. E2 can promote hepatic vitellogenin (Vtg) synthesis and ovary development(Reference Payne and Hales52,Reference Tyler and Sumpter56 ). As shown in online Supplementary Fig. S9, the pathway of E2 synthesis from cholesterol includes the following key steps: delivery of cholesterol from the cytoplasm to the inner mitochondrial membrane by the steroidogenic acute regulatory protein (StAR, a rate-limiting enzyme in steroidogenesis), then conversion to pregnenolone by the cytochrome P450 cholesterol side-chain cleavage enzyme (Cyp11a1), subsequent metabolisation of pregnenolone to progesterone by 3β-hydroxysteroid dehydrogenase (3β-hsd) and then to androstenedione by 17α-hydroxyprogesterone deacetylase (Cyp17a), further conversion of androstenedione to testosterone by 17-β-hydroxysteroid dehydrogenase (17β-hsd), and finally E2 is produced from testosterone by aromatase (Cyp19a)(Reference Stocco57–Reference Swart, Lombard and Swart59). In this study, except for StAR, the expression levels of all other genes encoding for these key enzymes (Cyp11a1, 3β-hsd, Cyp17a, 17β-hsd and Cyp19a) in the steroid hormone biosynthesis pathway were significantly up-regulated in L14 compared with L10 and L18. L14 also exhibited significantly higher plasma E2 levels. Although we did not measure actual changes in enzyme activities or synthesis rates, we can indirectly infer from this that the 14 % dietary lipid level probably facilitated steroid hormone synthesis in female Chinese sturgeons.
Gonadal development from stage II to III includes primary and secondary growth of oocytes. During primary oocyte growth, the follicle of oocytes develops, the nucleus of the oocyte increases in size, nucleoli appear around the nucleus and their number increases(Reference Tyler and Sumpter56,Reference Patiño and Sullivan60 ). In addition, growth and differentiation factor 9 (Gdf9) and bone morphogenetic factor 15 (Bmp15) are considered key growth factors in the regulation of primary oocyte growth both in mammals and teleosts(Reference Lubzens, Young and Bobe61). In our study, the number of nucleoli was somewhat larger in L18 compared with L10 and L14 (Fig. 1(D), (E) and (F)), and transcriptome data showed that the expression of gdf9 and bmp15 was significantly up-regulated in L18 (Fig. 6(D)), which indicates that the 18 % dietary lipid level was comparatively beneficial to follicle growth. The growth phase of secondary oocyte is marked by the appearance of cortical alveoli (formerly yolk vesicles), followed by oocyte lipid deposition (lipid droplet stage) and vitellogenesis (yolk incorporation), which is the final phase of oocyte growth(Reference Tyler and Sumpter56,Reference Wessel, Brooks and Green62 ). During lipid deposition, Lpl is responsible for cleaving fatty acids from plasma lipoproteins, while Fatp1 and Fabp4 play important roles in the process of lipid transportation across the biological membranes for lipid deposition in oocyte cytoplasm(Reference Ibáñez, Peinado-Onsurbe and Sánchez63,Reference Pohl, Ring and Hermann64 ). In this study, a higher plasma TAG content (Fig. 5(B)), appearance of a large amount of lipid droplets in oocyte cytoplasm and up-regulated mRNA expression levels of lpl, fatp1 and fabp4 in L18 (Fig. 6(D)), all illustrated that oocytes in L18 entered the lipid deposition stage. During vitellogenesis, the vitellogenin receptor (Vtgr) regulates vitellogenin uptake on the surface of oocytes, while the coatomer protein epsilon subunit (Cope) is involved in encoding a coatomer protein complex for the uptake of vitellogenin by receptor-mediated endocytosis(Reference Schekman and Orci65). The proton pump, H+-ATPase, moves back and forth between the plasma membrane to regulate yolk production(Reference Raldúa, Fabra and Bozzo66). Cathepsin D (Ctsd) and cathepsin B (Ctsb) are key proteases responsible for cleaving vitellogenin into vitellin(Reference Patiño and Sullivan60). Although we did not observe yolk granules in oocyte sections, the expressions of these five genes mentioned above were significantly up-regulated in L14 and L18 compared with L10 (Fig. 6(D)), which indicates that oocytes in higher dietary lipid level groups are more likely to be in the previtellogenesis stage, or even early stages of vitellogenesis. In addition, a fish with nearly mature eggs was identified in L18 at 24 months (Fig. 1(C)), which further illustrates that the 18 % dietary lipid level benefited gonad development and egg maturation in female Chinese sturgeon. A possible explanation for the mature eggs that were observed in L18 is that a higher level of dietary fish oil provided abundance of PUFA for the accumulation in eggs and energy essential for egg maturation, as has been observed in European eel(Reference Baeza, Mazzeo and Vilchez67) and zebrafish(Reference Zhu, Tan and Zhang68).
In the present study, combining the results of differentially regulated metabolites and unigenes, many differentially regulated metabolites and DEG could be systematically annotated to steroid hormone biosynthesis (online Supplementary Fig. S9) and ARA metabolism (online Supplementary Fig. S10), which indicated that these may be considered as key metabolic pathways involved in gonad development of female Chinese sturgeons fed different dietary lipid levels. Similar key pathways were also observed in rare minnow(Reference Gao, Zhang and Zhang13).
ARA metabolism pathway, from ARA to eicosanoids, has an important role in reproduction(Reference Xu, Du and Li15,Reference Tocher69 ). The products of ARA metabolism are generated by three enzymatic systems: cyclo-oxygenase (Cox), lipoxygenase (Lox) and cytochrome P450 (Cyp)(Reference Panigrahy, Kaipainen and Greene70). In the COX pathway, PGE2 is converted from ARA through sequential reactions, including PGH2 forming under the regulation of Cox1 and subsequent conversion of PGH2 to PGE2 under the regulation of PGE synthase (Pges)(Reference Forsberg, Leeb and Thorén71). As PGE2 shares an important function in stimulating pituitary secretion of luteinising hormone and follicle-stimulating hormone, which play key roles in gonad development(Reference Wang and Ge72), the up-regulated expression level of the pges gene in L18 compared with L14 and L10 (Fig. 6(D)) might indicate an enhanced metabolisation of ARA to PGE2 to promote ovary maturation. Although more data would be needed to corroborate this hypothesis, it also coincides with observations in sea bass(Reference Sorbera, Asturiano and Carrillo44).
In the LOX pathway, 5-LOX, one of the three LOX isoforms (5-, 12-, and 15-LOX), converts ARA into 5-HPETE(Reference Funk73). In this study, the content of 5-HPETE in the plasma of L18 was significantly increased compared with L10 (Fig. 6(C)). 5-HPETE is required in the transcriptional expression of the star gene, which mediates steroidogenesis(Reference Stocco57). In addition, 5-HPETE also modulates the liver X receptor, which is involved in the regulation of cholesterol homeostasis(Reference Hoang, Jia and Jun74). Plasma TAG content was increased in L18, but plasma cholesterol content was not different among the three groups, which may be explained by a higher content of 5-HPETE. Besides, an increased expression of 5-HPETE in L18 may also have indirectly up-regulated the expression of star, thus promoting steroidogenesis.
Two isoforms of Lox12, Lox12a and Lox12b, convert ARA into 12(S)-HPETE and 12(R)-HPETE, respectively(Reference Funk, Furci and FitzGerald75). 12(S)-HPETE is further converted to hepoxilin A3 and hepoxilin B3(Reference Pace-Asciak and Martin76). In this study, the expression of lox12 in L18 was significantly up-regulated (Fig. 6(D)), and the contents of 12(S)-HPETE metabolites, hepoxilin A3 and B3, were also higher in L18 than in L10 (Fig. 6(C)). Hepoxilin A3 and B3 affect the secretion of insulin(Reference Pace-Asciak and Martin76) and promote the release of calcium from intracellular stores(Reference Dho, Grinstein and Corey77). Insulin stimulates star mRNA expression in theca-cells, and plasma calcium exhibits a linear relationship with plasma Vtg(Reference Linares-Casenave, Kroll and Van Eenennaam78). Thus, up-regulated plasma hepoxilin A3 and B3 in L18 might indicate that the synthesis of steroid hormones and hepatic Vtg was enhanced in this group.
Peroxisome proliferator-activated receptors are known to induce the gene expression of enzymes involved in lipid uptake and catabolism in their target tissues(Reference Schoonjans, Staels and Auwerx79). Two isoforms of Lox15, Lox15a and Lox15b, convert ARA into 15(S)-HPETE and 8(S)-HPETE(Reference Brash80), which act as ligands for Pparα and Pparγ(Reference Murakami, Ide and Suzuki81,Reference Huang, Welch and Ricote82 ). In this study, the expression of lox15b in L18 was significantly up-regulated (Fig. 6(D)), and the contents of metabolites of 15(S)-HPETE and 8(S)-HPETE in the plasma of L18 were significantly higher than in L10 (Fig. 6(C)). In combination with the discussion above regarding oocytes entering the lipid deposition stage in L18, our results suggest that a higher dietary lipid content in L18 promoted ARA metabolism, further enhanced lipid metabolism and increased lipid uptake in the oocytes of female Chinese sturgeon.
Conclusion
Growth, ovarian development status, biochemical indices, metabolomics analysis and transcriptomic analysis all suggest that dietary lipid levels can affect the development of ovaries in female Chinese sturgeon. We observed that the 18 % dietary lipid level was most beneficial for oocyte growth and lipid deposition in oocytes, and inferred that this occurred through the regulation of enhanced lipid metabolism and ARA metabolism. We also hypothesised that high dietary lipid levels were beneficial to steroid hormone synthesis. As we did not measure actual changes in enzyme activities, nor changes in cholesterol and fatty acid synthesis rates, some of our conclusions were indirectly inferred from gene expression and metabolite levels, so they should be further confirmed by future studies. Regardless of these limitations, the results of our study broaden our understanding of reproduction physiology and provide an important method for broodstock cultivation in cultured breeding of Chinese sturgeon.
Acknowledgements
The authors thank the participants who gave their time to this experiment.
This work was supported by the National Key Basic Research Program of China (grant no. 2015CB150702) and the Central Public-Interest Scientific Institution Basal Research Fund, CAFS (grant no. 2017JBF0102).
X. Leng, H. D., Q. T. and Q. W. were responsible for study design and conducted the animal trial; H. Z. and Q. T. performed sample analyses and prepared the manuscript; X. Leng, H. D. and Q. W. participated in editing the manuscript; X. Liang and S. H. contributed to sample analyses. J. W. assisted with the feeding experiment.
None of the authors has any conflicts of interest to declare.
Supplementary material
For supplementary materials referred to in this article, please visit https://doi.org/10.1017/S0007114519002010


