


Colon cancer is one of the major causes of cancer-related mortality in both men and women worldwide(Reference Janakiram and Rao1). Epidemiological studies have shown that dietary custom is among the leading causes of colon cancer in Western society(Reference Bruce, Giacca and Medline2). In addition, compelling evidence has been provided demonstrating that several flavonoid-rich foods could display relevant cancer-preventive effects. Thus, the isolation and characterisation of potential chemopreventive agents in fruits and vegetables have represented a major task in anticancer studies(Reference Cooke, Steward and Gescher3).
Grape seed extract (GSE) contains several active substances – such as epigallocatechins, anthocyanins, gallic acid and so forth – which have shown promising chemopreventive and/or anticancer efficacy in various cell cultures and animal models(Reference Clifton4, Reference Surh5).
GSE-based anticancer effects are generally ascribed to its antioxidant and/or scavenging effects, enabling cells to prevent macromolecule damage induced by free radical compounds(Reference Bagchi, Bagchi and Stohs6, Reference Katiyar7).
In addition, procyanidins and epigallocatechins have proven to be cytotoxic towards human breast, lung and gastric adenocarcinoma cells, while enhancing the growth and viability of normal human gastric mucosal cells(Reference Bagchi, Bagchi and Stohs6).
Indeed, GSE from Italia, Palieri and Red Globe cultivars significantly inhibits growth rate and induced apoptosis in Caco-2 human colon cancer cells, via apoptosis-inducing factor and caspase-dependent pathways(Reference Dinicola, Cucina and Pasqualato8). Yet, the detailed molecular mechanism of GSE-induced apoptosis in Caco-2 cells has not yet been elucidated.
Mounting evidence supports a physiological role for reactive oxygen species (ROS) as a ‘second messenger’ in the intracellular signalling cascade that controls cell growth, proliferation, migration and apoptosis(Reference Thannickal and Fanburg9), and, interestingly, ROS can activate mitogen-activated protein kinase (MAPK) pathways(Reference Torres and Forman10). Even intracellular Ca2+ and its association with mitochondrial function/dysfunction may mediate the involvement of MAPK(Reference Chen, Liu and Kao11).
A large number of natural compounds, derived from plants and animals, such as the alkaloid berberine, notexin (derived from snake venom), panaxydol from ginseng roots, tocotrienols (members of the vitamin E family), have been shown to induce apoptosis in cancer cell lines involving a complex intracellular crosstalking that included ROS production, intracellular Ca2+ fluxes and the modulation of mitochondrial functional activity as well as MAPK activation(Reference Chen, Liu and Kao11–Reference Kim, Yu and Oh14).
We therefore investigated cellular targets involved in the mechanism underlying early apoptotic processes triggered by GSE on Caco-2 cells. Namely, ROS levels were studied after stimulation with GSE obtained from different cultivars, and characterised by a different quantitative composition of flavan-3-ols (epigallocatechins and procyanidins). Apoptosis was further correlated with ROS production and mitochondrial membrane potential, and subsequently with Ca2+ flux changes. ROS-dependent apoptotic effects were dynamically recorded in the presence and absence of a ROS scavenger drug (N-acetyl cysteine, NAC). In turn, Ca2+-dependent programmed cell death was studied in the presence or absence of a Ca chelator (ethylene glycol tetraacetic acid, EGTA). Eventually, the involvement of extracellular signal-regulated kinase (ERK) phosphorylation status change was investigated during GSE stimulation, by inhibiting both ROS production and Ca2+ fluxes, in order to ascertain the contribution of the aforementioned processes to cancer cell apoptosis.
Experimental methods
Cell cultures
The undifferentiated and tumorigenic human colorectal cancer cell lines Caco-2 and HCT-8 were obtained from the European Collection of Cell Cultures. Primary human colon fibroblasts were isolated from a healthy biopsy by collagenase type II digestion. Cells were grown in Dulbecco's modified Eagle's medium supplemented with 10 % fetal calf serum and antibiotics (penicillin 100 IU/ml, streptomycin 100 μg/ml and gentamicin 200 μg/ml). The cultures were kept at 37°C in an atmosphere of 5 % CO2 in air and the medium was changed every 3rd day. At confluence, the cells were subcultured after removal with 0·05 % trypsin–0·01 % EDTA. Caco-2 cells were maintained at low density and trypsinised before reaching confluence to avoid differentiation.
Grape seed extract preparation
Italia white grape, Palieri and Red Globe red grape cultivars from the experimental vineyard located in the Puglia region (Italy) were kindly provided by the Agricultural Research Council – Research Unit for grape and winegrowing in the Mediterranean environment (CRA-UTV). Fresh grape berry samples were skinned and seeds were separated from pulp and then gently wiped with filter paper to eliminate pulp residues. Homogeneous and dry material from seeds was obtained, extracted with methanol, purified and analysed by electrospray ionisation-MS according to a previously published method(Reference Cavaliere, Foglia and Gubbiotti15). The three cultivars showed significant differences with respect to their composition: Italia GSE contained 2·5 mg/g catechins and 4·1 mg/g procyanidins; Palieri GSE contained 6·2 mg/g catechins and 5·6 mg/g procyanidins; Red Globe GSE contained 3·9 mg/g catechins and 3·9 mg/g procyanidins(Reference Cavaliere, Foglia and Gubbiotti15). GSE was resuspended in 70 % ethanol at a concentration of 30 mg/ml and stored in the dark at − 20°C. With the intention of obtaining the concentration of 100 μg/ml (the highest concentration of GSE used in the present experiment), GSE stock solutions were diluted 1:300.
Apoptotic cell death assay
Caco-2 cells were cultured at confluence into 25 cm2 flasks (Falcon; Becton Dickinson Labware) in a standard medium and stimulated with 70 % ethanol (1:300, control) or with Italia, Palieri or Red Globe GSE at 100 μg/ml and incubated at 37°C in an atmosphere of 5 % CO2 in air. After 3 and 24 h, the cells were trypsinised, washed twice with PBS and stained with fluorescein isothiocyanate-labelled annexin V and 7-aminoactinomycin-D according to the manufacturer's instructions (Instrumental Pro3 Laboratory). Then, the samples were analysed by flow cytometry (EPICS Coulter XL; Beckman Coulter, Inc.) for the quantification of apoptotic cells. Fluorescence of 20 000 events was measured and an excitation wavelength of 488 nm was used in combination with standard filters to discriminate between the fluorescence channels FL1 and FL3, forward scatter and side scatter. Where indicated, Caco-2 cells were also stimulated with GSE in the presence of 100 mm-NAC (after pre-incubation with 100 mm-NAC for 30 min) or in a Ca2+-free PBS in the presence of 0·5 mm-EGTA. In detail, cytometric analysis was performed after 3 and 24 h of GSE exposure in the presence of 100 mm-NAC or after 1 h of GSE exposure in the presence of 0·5 mm-EGTA in the Ca2+-free PBS. The same experiments were performed on HCT-8 cells and primary human colon fibroblasts. For each data point, three independent experiments were performed.
Determination of reactive oxygen species production
The accumulation of ROS in Caco-2 cells was measured using a modified version of the method described by Wang & Joseph(Reference Wang and Joseph16). Caco-2 cells were seeded (5 × 10³ cells/well) in growth medium into special-optics ninety-six-well plates (Corning Costar). Immediately before exposure to 25, 50 and 100 μg/ml GSE, cells were incubated for 40 min at 37°C in sterile normal external solution (NES: 140 mm-NaCl, 2·8 mm-KCl, 2 mm-CaCl2, 2 mm-MgCl2, 10 mm-glucose and 10 mm-HEPES, pH 7·3) containing 10 μm-dichlorodihydrofluorescein diacetate (H2DCF-DA; Molecular Probes). After incubating with H2DCF-DA, the cells were rinsed with NES and exposed to GSE for 5 min. Fluorescence was measured using a microplate reader (SpectraMax Gemini XS; Molecular Devices), maintaining temperature at 25°C. Excitation and emission filters were set at 490 and 520 nm, respectively (bandwidth ± 15 nm). Fluorescence was recorded from each well every 30 s for 5 min and acquired on a computer using SoftMax Pro (version 5.0; Molecular Devices). Fluorescence values for each sample are expressed as means with their standard errors of f/f c, where f is the fluorescence value acquired in the treated samples and f c is the fluorescence value acquired in the unexposed control samples. Where indicated, Caco-2 cells were also stimulated with GSE in the presence of 100 mm-NAC (after pre-incubation with 100 mm-NAC for 30 min) or in a Ca2+-free NES in the presence of 0·5 mm-EGTA. Then, the same fluorescence analyses were performed after GSE addition. The same experiments were performed on HCT-8 cells and primary human colon fibroblasts. For each experimental condition, eight repetitions were performed in three independent experiments(Reference Morabito, Rovetta and Bizzarri17).
Measurement of mitochondrial membrane potential
Mitochondrial membrane potentials were determined using JC-1 (5,5′,6,6′-tetrachloro-1,1′,3,3′- tetraethylbenzimidazolylcarbocyanine iodide/chloride; Molecular Probes), a cationic carbocyanine dye that accumulates in the mitochondria. When the transmembrane potential is high, as in normal cells, JC-1 forms dimers (J-aggregates) that emit red fluorescence. When the potential is low, an index of oxidative stress, the dye forms monomers that emit green fluorescence, and there is a concurrent decrease in red fluorescence. The red:green fluorescence ratio is dependent on the mitochondrial membrane potential and not on other factors (e.g. mitochondrial size, shape, density) that might influence single-component fluorescence signals.
Caco-2 colon cancer cells were plated at 5 × 10³ cells/well in special-optics ninety-six-well plates (Corning Costar) and, after adhesion, incubated without (controls) or with different stimuli (25, 50 and 100 μg/ml of GSE) for different times (10 min, 1 and 3 h), as indicated in the Results section. At the end of incubation, the cells were incubated in growth medium containing 10 μg/ml of JC-1 for 10 min at 37°C. After three rinses with NES, the fluorescence of loaded cells was detected on a Gemini SpectraMax XS fluorescence plate reader (Molecular Devices) using an excitation wavelength of 485 nm and recording the emissions of the JC-1 monomer and aggregate at 530 and 590 nm, respectively. For each experiment, the aggregate:monomer (red:green) ratios were calculated. The values of fluorescence acquired from each sample are expressed as means with their standard errors of f(r/g)/f c(r/g), where f(r/g) is the red:green fluorescence value acquired in the treated samples and f c(r/g) is the red:green fluorescence value acquired in the unexposed control samples. Where indicated, Caco-2 cells were also stimulated with GSE for 1 h in the presence of 100 mm-NAC (after pre-incubation with 100 mm-NAC for 30 min) or in a Ca2+-free NES in the presence of 0·5 mm-EGTA. Then, the same fluorescence analyses were performed after GSE addition. For each experimental condition, eight repetitions were performed in three independent experiments(Reference Mariggiò, Falone and Morabito18).
Ca2+ signalling analysis
Intracellular Ca2+ content was monitored using the Ca2+-sensitive fluorescent indicator fura-2-acetoxymethyl ester (Molecular Probes), and an inverted Olympus microscope connected to a high-speed wavelength switcher (Polychrome II; TILL Photonics), equipped with a 75 W stabilised xenon lamp (Ushio, Inc.) and a cooled, charge-coupled device camera (C6790 model; Hamamatsu Photonics). Caco-2 colon cancer cells were plated (5 × 10³ cells/well) on special-optics ninety-six-well plates (Corning Costar) and, after adhesion, loaded with 5 μm-fura-2-acetoxymethyl ester for 30 min at 37°C in NES, supplemented with 1 % (w/v) BSA. The cells were washed twice to remove extracellular dye.
Fura-2-acetoxymethyl ester-loaded cells were sequentially and repetitively excited at 340 and 380 nm. Fluorescence images were acquired with a charge-coupled device camera and stored on an interfaced computer. The acquisition time was one image ratio per s. The image ratio calculations were carried out pixel by pixel on a pair of corresponding 340 and 380 nm image files. Temporal plots (mean value of the fluorescence signal in a selected cellular area) were calculated from the image ratios (340/380). GSE were added during fluorescence acquisition in the standard NES or Ca2+-free NES (CaCl2 was substituted by 2 mm-MgCl2 and 0·5 mm-EGTA was added). For each experimental condition (100 μg/ml of different GSE, in the presence or absence of EGTA), at least five different wells were analysed(Reference Mariggiò, Falone and Morabito18). The same experiments were performed on HCT-8 cells.
Western blot
Caco-2 cells were incubated with 50 μg/ml of Palieri GSE, for 5, 10, 30 min, 1 and 3 h in (1) a standard medium, (2) the presence of 100 mm-NAC after pre-incubation with 100 mm-NAC and (3) the Ca2+-free PBS in the presence of 0·5 mm-EGTA. HCT-8 cells were incubated with 50 μg/ml of Palieri GSE, for 5, 10, 30 min, 1 and 3 h in (1) a standard medium and (2) the presence of 100 mm-NAC after pre-incubation with 100 mm-NAC. Following these treatments, the cells were washed twice with ice-cold PBS and scraped in the following lysis buffer: 50 mm-Tris–HCl, pH 7·4, 150 mm-NaCl, 0·2 % Nonidet P-40, 1 % CHAPS (3-[(3-Cholamidopropyl)dimethylammonio]-2-hydroxy-1-propanesulfonate) and 2 mm-EDTA dissolved in tetra-distilled water. A mix of protease inhibitors (Complete-Mini Protease Inhibitor Cocktail Tablets; Roche) was added just before use. Cellular extracts were then centrifuged at 14 000 rpm for 10 min. The protein content of supernatants was determined using the Bradford assay (Sigma Aldrich). The same protocol was applied to the cells pre-incubated with 100 mm-NAC for 30 min or 0·5 mm-EGTA for 10 min. For immunoblot analyses, 120 μg of cellular extracts were separated on SDS–PAGE gels with a concentration of acrylamide specific for the proteins studied. Proteins were blotted onto nitrocellulose membranes (BIO-RAD; Bio-Rad Laboratories) and probed with the following antibodies: phospho-ERK1/2 (no. 9106; Cell Signaling Technology, Inc.) and ERK1 (sc-94; Santa Cruz Biotechnology Inc.). Antigens were detected with an enhanced chemoluminescence kit (Amersham Biosciences) according to the manufacturer's instructions. For each data point, three independent experiments were performed.
Statistical analysis
Results from apoptosis analyses are expressed as means and standard deviations and statistical analysis was performed through ANOVA, followed by the Bonferroni post-test and through unpaired, two-tailed Student's t tests. Data from Western blot densitometry, ROS and mitochondrial membrane potential determinations are expressed as means with their standard errors and statistical analysis was performed through unpaired, two-tailed Student's t tests. Differences were considered as significant at the level of P< 0·05. Statistical analysis was performed using GraphPad Instat software (GraphPad Software, Inc.).
Results
Reactive oxygen species and Ca2+ mediate grape seed extract-induced apoptosis
ROS involvement in GSE-mediated apoptosis was assessed on Caco-2 human colon cancer cells. The cells were exposed for 3 and 24 h to 100 μg/ml of Italia, Palieri or Red Globe GSE in the absence or presence of the antioxidant NAC (100 mm), after pre-incubation of 30 min with the same 100 mm-NAC. Then, the cells were analysed by flow cytometry. The GSE concentration of 100 μg/ml was chosen because it was the most effective in inducing the biological effects. Both after 3 and 24 h, Italia, Palieri and Red Globe GSE triggered the apoptosis of Caco-2 colon cancer cells at a significant extent; the presence of NAC strongly inhibited the GSE effect on cell death (Fig. 1(a) and (b)). Furthermore, the participation of Ca2+ mobilisation in GSE-induced cell death was evaluated using the Ca2+ chelator EGTA (0·5 mm) in an extracellular Ca2+-free medium and exposing the cells to 100 μg/ml of Italia, Palieri or Red Globe GSE for 1 h, before cytometric analysis. The presence of EGTA significantly inhibited the effect of GSE on the Caco-2 apoptotic rate (Fig. 1(c)).
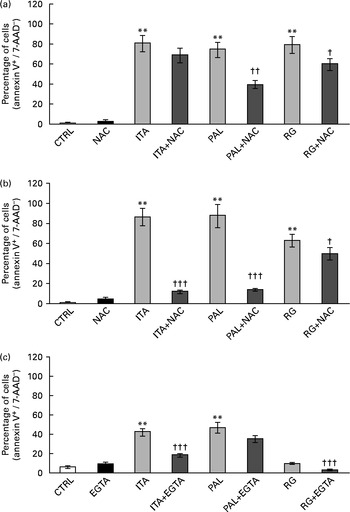
Fig. 1 Grape seed extract (GSE)-induced apoptosis in Caco-2 cells occurs via reactive oxygen species and Ca2+ involvement. Pretreatment with N-acetyl cysteine (NAC, 100 mm) inhibited GSE-induced apoptosis after (a) 3 h and (b) 24 h exposure to 100 μg/ml of Italia (ITA), Palieri (PAL) or Red globe (RG) GSE. The presence of ethylene glycol tetraacetic acid (EGTA, 0·5 mm) inhibited GSE-induced apoptosis after (c) 1 h exposure to 100 μg/ml of ITA, PAL or RG GSE. The percentage of apoptotic cells (annexin V+/7-aminoactinomycin (AAD)−), obtained through flow cytometry, is reported. Values are means of three independent experiments, with standard deviations represented by vertical bars. ** Mean value was significantly different compared with the control condition by ANOVA, followed by Bonferroni post-test (P< 0·01). Mean values were significantly different between the GSE-treated cells and GSE+NAC- or GSE+EGTA-treated cells by unpaired, two-tailed Student's t test: † P< 0·05; †† P< 0·01; ††† P< 0·001. CTRL, control.
These data suggested that, in Caco-2 colon cancer cells, GSE-induced apoptosis could be mediated by ROS and extracellular Ca2+. Moreover, simultaneous incubation with NAC+EGTA for 1 h did not trigger any additive effect on GSE-induced apoptosis, showing results not significantly different with respect to the treatment with NAC or EGTA alone (Fig. 2). These data seem to indicate that in Caco-2 cells, ROS generation and Ca2+ signalling could not act independently of each other in triggering apoptosis.
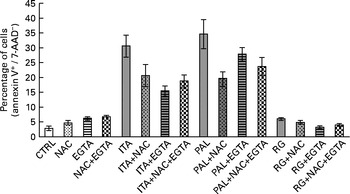
Fig. 2 No additive effect on the apoptosis inhibition of N-acetyl cysteine (NAC)+ethylene glycol tetraacetic acid (EGTA) v. NAC or EGTA alone. Simultaneous 1 h pretreatment with NAC (100 mm) and EGTA (0·5 mm) of 100 μg/ml of grape seed extract-stimulated Caco-2 cells did not induce an additive effect on the decreasing apoptotic rate with respect to NAC or EGTA alone. The percentage of apoptotic cells (annexin V+/7-aminoactinomycin (AAD)−), obtained through flow cytometry, is reported. Values are means of three independent experiments, with standard deviations represented by vertical bars. CTRL, control; ITA, Italia; PAL, Palieri; RG, Red Globe.
Grape seed extract triggers an increase in reactive oxygen species production
Considering the results shown in Fig. 1, we examined whether GSE could trigger intracellular ROS increase, using H2DCF-DA as a specific ROS probe. In fact, 50 and 100 μg/ml of Italia, Palieri and Red Globe GSE induced a statistically significant increase in ROS levels within the first 10 min of administration to cell cultures (Fig. 3(a)). Focusing on the lowest concentration (25 μg/ml), only the Palieri GSE-treated samples showed marked ROS production with respect to the control. The presence of the antioxidant NAC blocked the effect induced by GSE on intracellular ROS increase (Fig. 3(b)). After 1 and 3 h of incubation, no significant differences in ROS levels were detected between the controls and GSE-treated cells (data not shown).
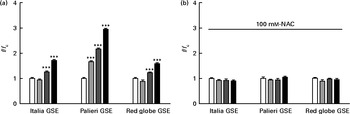
Fig. 3 Dose-dependent reactive oxygen species (ROS) generation in Italia, Palieri and Red Globe grape seed extract (GSE)-treated Caco-2 cells (a) without and (b) with N-acetyl cysteine (NAC, 100 mm). After incubating with dichlorodihydrofluorescein diacetate, the cells were rinsed with normal external solution and exposed to 25 μg/ml (![]() ), 50 μg/ml (
), 50 μg/ml (![]() ) and 100 μg/ml (■) of GSE for 10 min. The amount of intracellular ROS was estimated by using a microplate reader measuring fluorescence intensity at 490–520 nm. Data are expressed as fold increase with respect to the control (□). For each experimental condition, eight repetitions were performed in three independent experiments. Values are means, with their standard errors represented by vertical bars. *** Mean value was significantly different compared with the control conditions by unpaired, two-tailed Student's t test (P< 0·001). f, Fluorescence value acquired in the treated samples; f c, fluorescence value acquired in the unexposed control samples.
) and 100 μg/ml (■) of GSE for 10 min. The amount of intracellular ROS was estimated by using a microplate reader measuring fluorescence intensity at 490–520 nm. Data are expressed as fold increase with respect to the control (□). For each experimental condition, eight repetitions were performed in three independent experiments. Values are means, with their standard errors represented by vertical bars. *** Mean value was significantly different compared with the control conditions by unpaired, two-tailed Student's t test (P< 0·001). f, Fluorescence value acquired in the treated samples; f c, fluorescence value acquired in the unexposed control samples.
Grape seed extract induces a decrease in mitochondrial membrane potential
One of the most important hallmarks of apoptosis is the depolarisation of the mitochondrial membrane. In addition, mitochondria are the main source of ROS in the cells(Reference Thannickal and Fanburg9–Reference Chen, Liu and Kao11). Thus, we tested the biological effect of GSE on the mitochondrial membrane potential both after a few minutes of treatment and after 1 and 3 h, monitoring the fluorescence emission of JC-1. The results showed that within the first 10 min, 25, 50 and 100 μg/ml of Italia and Palieri GSE significantly reduced mitochondrial membrane potential; meanwhile, the Red Globe cultivar showed this effect only at the highest concentration (Fig. 4(a)). After 1 h of treatment, mitochondrial membrane potential was markedly decreased for all extracts at all the concentrations tested (Fig. 4(b)). At 3 h, only 100 μg/ml of Italia and 50 and 100 μg/ml of Palieri cultivars showed this effect; conversely, Red Globe GSE appeared to revert the effect (Fig. 4(c)).
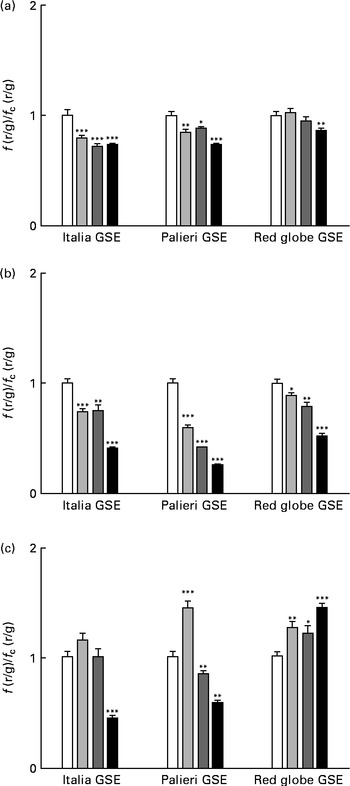
Fig. 4 Decrease in the mitochondrial membrane potential induced by Italia, Palieri and Red Globe grape seed extract (GSE) in Caco-2 cells in terms of dose and time response. The cells were incubated with GSE (25 μg/ml (![]() ), 50 μg/ml (
), 50 μg/ml (![]() ) and 100 μg/ml (■)) for (a) 10 min, (b) 1 h and (c) 3 h and stained with 5,5′,6,6′-tetrachloro-1,1′,3,3′- tetraethylbenzimidazolylcarbocyanine iodide/chloride (JC-1). The fluorescence of loaded cells was detected using an excitation wavelength of 485 nm and recording the emissions of the JC-1 monomer and aggregate at 530 and 590 nm, respectively. Data are expressed as fold increase with respect to the control. Eight repetitions were performed for each experimental condition in three independent experiments. Values are means, with their standard errors represented by vertical bars. Mean values were significantly different compared with the control conditions by unpaired, two-tailed Student's t test: * P< 0·05; ** P< 0·01; *** P< 0·001. f(r/g), red : green fluorescence value acquired in the treated samples; f c(r/g), red : green fluorescence value acquired in the unexposed control (□) samples.
) and 100 μg/ml (■)) for (a) 10 min, (b) 1 h and (c) 3 h and stained with 5,5′,6,6′-tetrachloro-1,1′,3,3′- tetraethylbenzimidazolylcarbocyanine iodide/chloride (JC-1). The fluorescence of loaded cells was detected using an excitation wavelength of 485 nm and recording the emissions of the JC-1 monomer and aggregate at 530 and 590 nm, respectively. Data are expressed as fold increase with respect to the control. Eight repetitions were performed for each experimental condition in three independent experiments. Values are means, with their standard errors represented by vertical bars. Mean values were significantly different compared with the control conditions by unpaired, two-tailed Student's t test: * P< 0·05; ** P< 0·01; *** P< 0·001. f(r/g), red : green fluorescence value acquired in the treated samples; f c(r/g), red : green fluorescence value acquired in the unexposed control (□) samples.
These results indicate that GSE-induced mitochondrial depolarisation occurred early in the dynamic process of apoptosis.
The administration of 100 mm-NAC (after 30 min pre-incubation with the antioxidant) or 0·5 mm-EGTA in the Ca2+-free medium significantly reverted (even if not completely) the mitochondrial membrane depolarisation induced by GSE after 1 h incubation (Fig. 5(a) and (b)). These data suggested a possible role of oxidative status and intracellular Ca2+ signalling in the control of mitochondrial membrane potential as well as in apoptotic cell death. Also in this experimental approach, the simultaneous incubation with NAC+EGTA evoked an effect similar to that observed in the treatment with NAC or EGTA alone (Fig. 5(c)). These data seem to indicate that, again, in Caco-2 cells, ROS generation and Ca2+ signalling could not act independently of each other in triggering mitochondrial depolarisation.
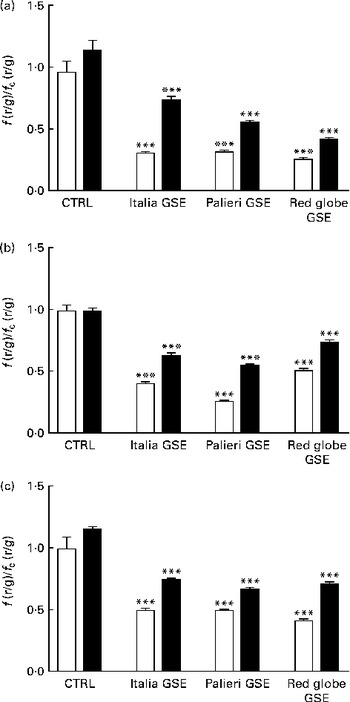
Fig. 5 Italia, Palieri and Red Globe grape seed extract (GSE)-induced mitochondrial membrane depolarisation in Caco-2 cells involves reactive oxygen species and intracellular Ca2+. Pre-incubation with (a) N-acetyl cysteine (NAC; − NAC (□);+NAC (■)) (100 mm) or (b) the presence of ethylene glycol tetraacetic acid (EGTA; − EGTA (□);+EGTA (■)) (0·5 mm) decreases the mitochondrial membrane depolarisation induced by 100 μg/ml of GSE after 1 h incubation. The presence of (c) NAC+EGTA (■) is not able to completely revert the effect induced by GSE. After the exposure to GSE, Caco-2 cells were stained with 5,5′,6,6′-tetrachloro-1,1′,3,3′-tetraethylbenzimidazolylcarbocyanine iodide/chloride (JC-1). □, None. The fluorescence of loaded cells was detected using an excitation wavelength of 485 nm and recording the emissions of the JC-1 monomer and aggregate at 530 and 590 nm, respectively. Eight repetitions were performed for each experimental condition in three independent experiments. Values are means, with their standard errors represented by vertical bars. *** Mean value was significantly different compared with the control (CTRL) conditions by unpaired, two-tailed Student's t test (P< 0·001). f(r/g), red : green fluorescence value acquired in the treated samples; f c(r/g), red : green fluorescence value acquired in the unexposed CTRL samples.
Effects of grape seed extract on Ca2+ signalling
Since Ca2+ signalling is involved in apoptosis, the modulation of intracellular Ca2+ signalling dynamics in Caco-2 cells was recorded during the administration of 100 μg/ml of GSE to fura-2-loaded cells, using a single-cell approach.
An increase in intracellular Ca2+ was detected after GSE stimulation even if with a different kinetic for each GSE: a rapid and sustained Ca2+ rise induced by Italia GSE, a slower increase induced by Palieri seed extract and a rapid and transient increase induced by Red Globe seed extract (Fig. 6(a)–(c), respectively). To determine whether GSE-induced intracellular Ca2+ variations were dependent on extracellular Ca2+ influx, we monitored fura-2-loaded Caco-2 cells during GSE addition in the presence of a Ca2+-free external medium containing 0·5 mm-EGTA. In the Italia and Palieri GSE-treated samples, only 16 or 20 % of the tested cells showed a transient increase in intracellular Ca2+ (Fig. 6(d) and (e)). Red Globe GSE failed to induce any intracellular Ca2+ variations in the presence of extracellular EGTA (Fig. 6(f)).
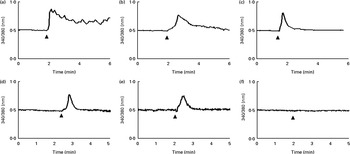
Fig. 6 Grape seed extract (GSE) induces intracellular Ca2+ increase in Caco-2 cells. After loading with fura-2-acetoxymethyl ester (5 μm), the cells, seeded on special-optics ninety-six-well plates, were excited at 340 and 380 nm and exposed to 100 μg/ml of (a) Italia (responsive cells, 100 %; tested cells, n 52), (b) Palieri (responsive cells, 100 %; tested cells, n 45) and (c) Red Globe (responsive cells, 100 %; tested cells, n 36) GSE. In the presence of EGTA (0·5 mm) and Ca2+-free medium, (d) Italia (responsive cells, 16 %; tested cells, n 70) and (e) Palieri (responsive cells, 20 %; tested cells, n 121) GSE showed a transient increase in intracellular Ca2+ only in 16 and 20 % of the cell population, respectively. (f) Red Globe (responsive cells, 0 %; tested cells, n 51) GSE did not induce any intracellular Ca2+ variations. For each experimental condition, at least five different wells were analysed.
These data indicated that Italia and Palieri GSE promote both extra- and intracellular Ca2+ mobilisation; meanwhile, Red Globe GSE primarily triggers extracellular Ca2+ uptake.
Grape seed extract-induced modulation of extracellular signal-regulated kinase/mitogen-activated protein kinase protein
Considering that GSE-induced apoptosis may be mediated by both ROS and Ca2+, we investigated some related signalling events induced by GSE in Caco-2 cells. In particular, the response of ERK/MAPK, a molecule sensitive and responsive to extracellular stimuli, was measured. Indeed, MAPK represent one of the major connection points among apoptosis, ROS and Ca2+ signalling(Reference Chen, Liu and Kao11, Reference Hsu, Hsieh and Kuo12). We monitored, in a time course analysis from 0 to 3 h, ERK phosphorylation and activation in the presence of 50 μg/ml of Palieri GSE, which proved to be the most effective cultivar in inducing Caco-2 cell death, as well as ROS production and mitochondrial membrane depolarisation. The 50 μg/ml GSE was chosen because cells treated with 100 μg/ml underwent massive apoptosis, making it difficult to recover viable samples for immunoblot analyses. ERK was strongly dephosphorylated in the presence of GSE (Fig. 7).
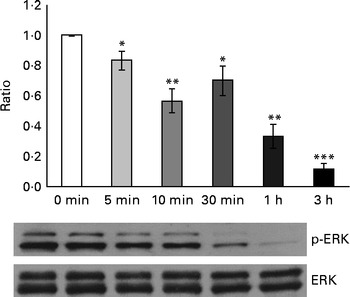
Fig. 7 Palieri grape seed extract (GSE) decreases extracellular signal-regulated kinase (ERK)/mitogen-activated protein kinase phosphorylation (p) in Caco-2 cells. Cells were exposed to GSE (50 μg/ml) in a time course from 0 to 3 h. Cells were harvested at different time points and cell lysates were prepared to determine the phosphorylated and total protein levels of ERK, using Western blot analysis. Values are means (three independent experiments) of the ratio between the optical density (OD) of the p-ERK band in the GSE-treated samples and the OD of the untreated control cell band (0 min), with their standard errors represented by vertical bars. Mean values were significantly different compared with the control condition by unpaired, two-tailed Student's t test: * P< 0·05; ** P< 0·01; *** P< 0·001.
The presence of 100 mm-NAC (after a 30 min pretreatment with the same NAC concentration) significantly inhibited the Palieri effect on ERK inactivation (Fig. 8). Moreover, Caco-2 stimulation by GSE in the Ca2+-free medium and in the presence of 0·5 mm-EGTA resulted in a significant increase in ERK/MAPK phosphorylation, showing the lack of the GSE-induced effect (Fig. 8).
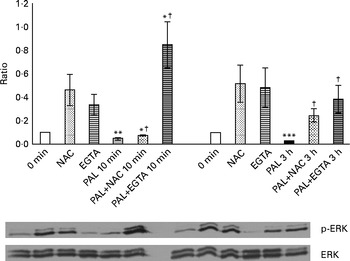
Fig. 8 Palieri (PAL) grape seed extract (GSE) decreases extracellular signal-regulated kinase phosphorylation (p-ERK) via reactive oxygen species and intracellular Ca2+ mobilisation in Caco-2 cells. Cells were exposed to GSE (50 μg/ml) with or without pretreatment with N-acetyl cysteine (NAC, 100 mm) or the presence of ethylene glycol tetraacetic acid (EGTA, 0·5 mm) for 10 min and 3 h. Cells were harvested at different time points and cell lysates were prepared to determine the phosphorylated and total protein levels of ERK, using Western blot analysis. Values are means (three independent experiments) of the ratio between the optical density (OD) of the p-ERK band in the NAC, EGTA, GSE and GSE+NAC or GSE+EGTA samples and the OD of the untreated control cells band (0 min), with their standard deviations represented by vertical bars. Mean values were significantly different compared with the control condition by unpaired, two-tailed Student's t test: * P< 0·05; ** P< 0·01; *** P< 0·001. † Mean value was significantly different between the PAL GSE-treated cells and the PAL+NAC or PAL+EGTA-treated cells by unpaired, two-tailed Student's t test (P< 0·05).
Taken together, these data suggested that ERK is involved in ROS- and Ca2+-mediated apoptosis triggered by GSE.
Grape seed extract effects on other colon cells
In order to assess whether GSE could exert its effects on other colon cells, we treated HCT-8 cancer cells and primary human normal colon fibroblasts with GSE. GSE-induced apoptosis has previously been reported for HCT-8, while the same effect was not present on colon fibroblasts(Reference Dinicola, Cucina and Pasqualato19). In the present study, ROS involvement in GSE-mediated apoptosis was assessed on both human colon cancer HCT-8 cells and normal primary human colon fibroblasts. The cells were exposed for 3 h to 100 μg/ml of Italia, Palieri or Red Globe GSE in the absence or presence of the antioxidant NAC (100 mm), after pre-incubation of 30 min with the same 100 mm-NAC. Then, the cells were analysed by flow cytometry. After 3 h, Italia, Palieri and Red Globe GSE triggered the apoptosis of HCT-8 colon cancer cells at a significant extent; the presence of NAC strongly inhibited the GSE effect on cell death (Fig. 9(a)). On the other hand, the viability of normal primary human colon fibroblasts was unmodified by the GSE treatment with respect to the control cultures (Fig. 10(a)).
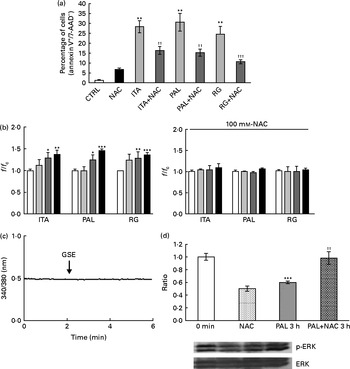
Fig. 9 Grape seed extract (GSE) effects on HCT-8 cells. (a) 100 μg/ml of GSE-induced apoptosis after 3 h of exposure, in the absence or presence of N-acetyl cysteine (NAC, 100 mm). The percentage of apoptotic cells (annexin V+/7-aminoactinomycin (AAD)−), obtained through flow cytometry, is reported. Values are means of three independent experiments, with standard deviations represented by vertical bars. ** Mean value was significantly different compared with the control condition by ANOVA, followed by Bonferroni post-test (P< 0·01). Mean values were significantly different between the GSE-treated cells and the GSE+NAC-treated cells by unpaired, two-tailed Student's t test: †† P< 0·01; ††† P< 0·001. (b) Dose-dependent reactive oxygen species (ROS) generation in the Italia (ITA), Palieri (PAL) and Red Globe (RG) GSE-treated HCT-8 cells without and with NAC (100 mm), assayed by means of dichlorodihydrofluorescein diacetate. Data are expressed as fold increase with respect to the control. For each experimental condition, eight repetitions were performed in three independent experiments. Values are means, with standard deviations represented by vertical bars. Mean values were significantly different compared with the control conditions by unpaired, two-tailed Student's t test: * P< 0·05; ** P< 0·01; *** P< 0·001.□, Control (CTRL);![]() , 25 μg/ml;
, 25 μg/ml;![]() , 50 μg/ml;■, 100 μg/ml. (c) GSE failed in inducing an intracellular Ca2+ increase in HCT-8 cells, monitored using fura-2-acetoxymethyl ester (5 μm). Total tested cells were as follows: forty-five ITA GSE-treated cells; sixty-seven PAL GSE-treated cells; fifty-three RG GSE-treated cells. (d) 50 μg/ml PAL GSE decreases extracellular signal-regulated kinase phosphorylation (p-ERK) via ROS in HCT-8 cells, assayed by Western blot analysis. values are means (three independent experiments) of the ratio between the optical density (OD) of the p-ERK band in the NAC, GSE and GSE+NAC samples and the OD of the untreated control cells (CTRL) band (0 min), with their standard errors represented by vertical bars. *** Mean value was significantly different compared with the control condition by unpaired, two-tailed Student's t test (P< 0·001). †† Mean value was significantly different between the PAL GSE-treated cells and the PAL+NAC-treated cells by unpaired, two-tailed Student's t test (P< 0·01). f, Fluorescence value acquired in the treated samples; f c, fluorescence value acquired in the unexposed control samples.
, 50 μg/ml;■, 100 μg/ml. (c) GSE failed in inducing an intracellular Ca2+ increase in HCT-8 cells, monitored using fura-2-acetoxymethyl ester (5 μm). Total tested cells were as follows: forty-five ITA GSE-treated cells; sixty-seven PAL GSE-treated cells; fifty-three RG GSE-treated cells. (d) 50 μg/ml PAL GSE decreases extracellular signal-regulated kinase phosphorylation (p-ERK) via ROS in HCT-8 cells, assayed by Western blot analysis. values are means (three independent experiments) of the ratio between the optical density (OD) of the p-ERK band in the NAC, GSE and GSE+NAC samples and the OD of the untreated control cells (CTRL) band (0 min), with their standard errors represented by vertical bars. *** Mean value was significantly different compared with the control condition by unpaired, two-tailed Student's t test (P< 0·001). †† Mean value was significantly different between the PAL GSE-treated cells and the PAL+NAC-treated cells by unpaired, two-tailed Student's t test (P< 0·01). f, Fluorescence value acquired in the treated samples; f c, fluorescence value acquired in the unexposed control samples.
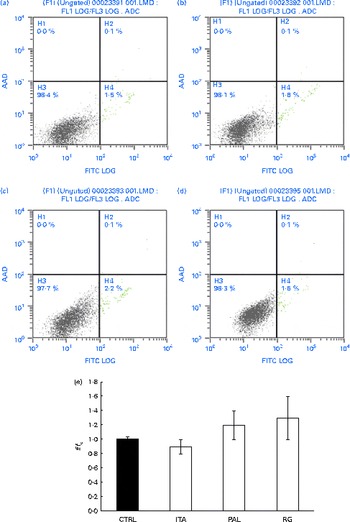
Fig. 10 Grape seed extract (GSE) effects on normal primary human colon fibroblasts. 100 μg/ml of GSE ((a) control, (b) Italia, (c) Palieri and (d) Red Globe) did not induce apoptosis in normal primary human colon fibroblasts. Dual-parameter flow cytometric density dot plots for the GSE-treated cells. Fluorescence intensity for annexin V–fluorescein isothiocyanate (FITC) is plotted on the x-axis and 7-aminoactinomycin-D (AAD) is plotted on the y-axis. The lower left quadrant cells (annexin V−/7-AAD−) were defined as viable cells, the lower right quadrant cells (annexin V+/7-AAD−) as apoptotic cells and the upper right quadrant cells (annexin V+/7-AAD+) as late apoptotic cells. (e) GSE failed to induce reactive oxygen species increase in normal primary human colon fibroblasts, assayed by means of dichlorodihydrofluorescein diacetate. Data are expressed as fold increase with respect to the control (CTRL). For each experimental condition, eight repetitions were performed in three independent experiments. ITA, Italia; PAL, Palieri; RG, Red Globe. (A colour version of this figure can be found online at http://www.journals.cambridge.org/bjn).
The HCT-8 treatment with 25, 50 and 100 μg/ml of Italia, Palieri and Red Globe GSE induced, within the first 10 min, a dose-dependent ROS increase (Fig. 9(b)). The same experiment was performed on normal primary human colon fibroblasts, and no significant ROS increase was detected in the GSE-treated cells with respect to the control cultures (Fig. 10(b)).
No increase in intracellular Ca2+ was detected after GSE stimulation in HCT-8 cells (Fig. 9(c)). Moreover, in these cells, after 3 h of incubation with 50 μg/ml of Palieri GSE, ERK was strongly dephosphorylated with respect to the untreated cells, and the addition of NAC completely reverted the GSE effect on ERK inactivation (Fig. 9(d)).
Discussion
Despite the increasing understanding of processes and mechanisms in colonic carcinogenesis, current therapies, including surgery, chemotherapy, radiotherapy and molecular-targeted therapy, are still of limited benefit in advanced tumours. Hence, a growing amount of scientific attention has been focused on investigating the potential role of dietary substances for both the prevention and control of colon cancer through chemopreventive strategies(Reference Pan, Lai and Wu20). Epidemiological studies have shown that fruit and vegetable consumption may correlate with the decreased risk of colon cancer(Reference Michels, Giovannucci and Chan21, Reference Kune and Watson22). Namely, grape fruits as well as grape-derived beverages (wine) have received much attention as preventive nutraceuticals(Reference Chao, Slezak and Caan23). Indeed, GSE is rich in flavonoids, and exhibits a broad spectrum of pharmacological properties: antioxidant, free radical-scavenging, anti-inflammatory, anti-carcinogenic, anti-viral, anti-bacterial, anti-thrombogenic and anti-atherogenic activities(Reference Pan, Lai and Wu20).
It is of utmost importance that GSE triggers apoptosis in Caco-2 cells via caspase-dependent and -independent pathways(Reference Dinicola, Cucina and Pasqualato8); the mechanisms culminating in apoptotic cell death remain still unclear, though. We hypothesised that ROS and Ca2+ influx could probably participate in such a mechanism.
Changes in the intracellular level of ROS have been reported to play an important role in the early step of apoptosis, anticipating loss of the mitochondrial membrane potential and release of those apoptotic-inducing factors, such as cytochrome c and activated caspases(Reference Teo, Tang and Chui24). Broad evidence has proved that drug-induced ROS production is responsible for apoptosis in different types of cancer such as cervical(Reference Lin, Yang and Lin25), pancreatic(Reference Zhang, Humphreys and Sahu26), gastric(Reference Qian, Li and Ding27), breast(Reference Xiao, Powolny and Singh28) as well as colon cancer and leukaemia(Reference Pan, Gao and Lai29, Reference Feng, Ni and Wang30).
In our cell model, Caco-2 cells, Italia, Palieri and Red Globe GSE also significantly increased ROS production, in a dose-dependent manner, within a few minutes of treatment. A GSE-induced ROS increase is a determinant partner in triggering cell apoptosis. As a proof of principle, addition of NAC, a well-known ROS scavenger, hampers ROS release and significantly decreases GSE-induced apoptosis.
The mitochondrial transmembrane potential is often used as an indicator of cellular viability, and metabolic activity, and its disruption has been involved in a variety of apoptotic phenomena(Reference Marchetti, Castedo and Susin31). Moreover, mitochondria have also been implicated in ROS generation during apoptosis. Indeed, reduced mitochondrial membrane potential has recently been shown to lead to increased generation of ROS and apoptosis(Reference Zamzami, Marchetti and Castedo32, Reference Finkel and Holbrook33). In Caco-2 cells, Italia, Palieri and Red Globe GSE induced a time- and dose-dependent mitochondrial membrane depolarisation, mainly after about 1 h of treatment.
Also in this case, pre-incubation with NAC significantly decreased GSE effects on mitochondria, supporting the hypothesis of the tight linkage between these organelles and the redox system.
The temporal analysis of GSE-induced effects leads to the speculation that ROS generation, observed within the first minutes of exposure, could participate, together with other signals, in the GSE-induced cellular pathway(s), as one of the first steps that, in turn, triggered mitochondrial membrane depolarisation, reaching its highest effect at 1 h of incubation.
Furthermore, mitochondria are central players in cellular Ca2+ signalling by shaping and buffering cellular Ca2+ signals(Reference Eager, Roden and Dulhunty34, Reference Boitier, Rea and Duchen35). It is widely recognised that Ca2+ displays growth-inhibiting and differentiation-promoting activities in a variety of normal and malignant epithelial cells, including cells of the gastrointestinal tract(Reference Lamprecht and Lipkin36). In the present experiment, intracellular Ca2+ rapidly increased after the addition of GSE to the culture. This effect might be due to the mobilisation of intracellular Ca2+ stores, or to the influx of extracellular Ca2+. In order to address these issues, Caco-2 cells were incubated in a Ca2+-free medium containing the Ca2+ chelator EGTA. Interestingly, by chelating Ca2+ in the culture medium, in the Red Globe-treated cells, intracellular concentration of Ca2+ was unchanged, showing that, in this very case, modification in intracellular Ca2+ was tightly dependent on extracellular Ca2+ influx. On the contrary, addition of EGTA to the medium reduced but did not completely inhibit the increase observed in Ca2+ intracellular levels, thus demonstrating that Ca2+ release after the treatment with Palieri- and Italia-derived GSE is partly due to the depletion of intracellular Ca2+ stores. These results suggest that different grape cultivars exert selective biological effects on Ca2+ physiology. In turn, Ca2+ shows to be essential for inducing apoptosis. Indeed, the Ca2+-free medium (after adding EGTA) significantly inhibited GSE-induced apoptosis as well as mitochondrial depolarisation, thus suggesting the two phenomena are entrenched.
The different chemical composition of each grape extract could probably explain the differences observed in their molecular effects(Reference Cavaliere, Foglia and Gubbiotti15).
Moreover, the simultaneous incubation with NAC and EGTA did not trigger any additive effect on apoptosis or mitochondrial depolarisation modulated by GSE. As reported by Feissner et al. (Reference Feissner, Skalska and Gaum37), a crosstalk signalling between Ca2+ and ROS exists. In fact, ROS may regulate the activity of Ca2+-activated channels and, at the same time, increased Ca2+ levels could promote ATP synthesis-induced ROS generation. In our model, ROS generation and Ca2+ signalling did not appear to act independently of each other in triggering apoptosis and mitochondrial depolarisation. In fact, inhibiting both ROS and Ca2+ signalling, an additive biological response was not observed.
As previously discussed(Reference Dinicola, Cucina and Pasqualato8, Reference Dinicola, Cucina and Pasqualato19), GSE contains several molecules with a pyrogallol-type structure that can exert anticancer activity. Palieri GSE showed the highest concentration of compounds provided by a pyrogallol-type structure(Reference Wilankar, Khan and Checker13), and, as expected, the highest apoptotic rate, as well as ROS production and mitochondrial membrane depolarisation, were recorded in the Palieri-treated cells. Therefore, we focused on the Palieri cultivar, investigating the signalling involved in Palieri GSE-induced cell death.
Stress conditions and extracellular Ca2+ are both known to activate by phosphorylation members of the MAPK family, namely ERK(Reference Martindale and Holbrook38, Reference Bhagavathula, Kelley and Reddy39). Promotion of survival through ERK phosphorylation has been documented by many studies. Data presented herein supported this assumption, given that ERK resulted in significant dephosphorylation, and hence inactivated in the presence of Palieri GSE. Interestingly, pretreatment with NAC almost completely reversed GSE-mediated ERK inactivation, hence showing that ROS induction is mandatory to activate ERK. Moreover, by adding NAC to Palieri-treated cancer cells, we demonstrated a significant apoptosis decrease. These results highlight the link among intracellular ROS increase and the subsequent induction of GSE-mediated apoptosis.
Changes in Ca2+ fluxes exert altogether a relevant contribution to GSE-mediated apoptosis, through the modulation of ERK activation. Addition of EGTA reduces Ca2+ influx, allowing ERK phosphorylation, and eventually contributes to the cell survival. Thus, both ROS induction and increased intracellular Ca2+ levels converge to foster ERK inactivation and programmed cell death after GSE treatment, as exemplified in Fig. 11.
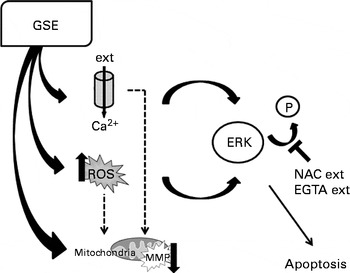
Fig. 11 Schematic representation of grape seed extract (GSE)-mediated effects on Caco-2 cells. ext, Extracellular; P, phosphate group; ERK, extracellular signal-regulated kinase; NAC, N-acetyl cysteine; EGTA, ethylene glycol tetraacetic acid; ROS, reactive oxygen species; MMP, mitochondrial membrane potential.
GSE-induced apoptosis has been reported not only for Caco-2 cells. As previously reported(Reference Dinicola, Cucina and Pasqualato19), GSE induced apoptosis in HCT-8 cells in a dose- and time-dependent manner. Herein, we demonstrated that GSE-induced HCT-8 apoptosis is a ROS-mediated process, considering the increase in ROS levels and the inhibition of apoptosis after NAC incubation. ROS are probably involved in ERK dephosphorylation and inactivation, as demonstrated by the increase in the phospho-ERK:ERK ratio after NAC incubation. Differently from Caco-2, in HCT-8 cells, GSE-induced apoptosis did not involve intracellular Ca2+ mobilisation, as no intracellular Ca2+ increase was recorded after GSE addition.
Interestingly, a significant increase neither in ROS levels nor in apoptotic rate was observed in normal primary human colon fibroblasts, to which GSE was added. These results indicated that the GSE effect is cell-specific, depending on the cell phenotype: normal or cancer cells. The partial difference in GSE-mediated apoptotic signalling could be probably due to the biologically different sensitivity of cell lines from the same cancer type, such as Caco-2 and HCT-8 cells.
In conclusion, the present results show that in Caco-2 human colon cancer cells, GSE generated ROS and promoted extracellular Ca2+ uptake, hence inducing mitochondrial membrane depolarisation and apoptosis. These effects involve at least an ERK-mediated pathway, leading to the inactivation of ERK and related survival processes. Relevance of such mechanism could easily explain the increased interest for GSE-related compounds in a clinical cancer setting.
Acknowledgements
No funding was received for the present study. All authors have no personal or financial conflicts of interest and they have not entered into any agreement that could interfere with our access to the data on the research or on our ability to analyse the data independently, to prepare manuscripts and to publish them. S. D. and M. A. M. designed and performed the experiments, analysed the data and wrote the manuscript. C. M. and S. G. performed some experiments and analysed the data. A. C. contributed to the design of the experiments and gave conceptual advice. A. P., F. D'A. and S. P. contributed to the performance of the experiments and the analysis of the data. P. C. performed the cytofluorimetric analysis. M. B. supervised the experiments and wrote the manuscript.


