


Glycaemic index (GI) values have been widely used and endorsed by the FAO and WHO for guiding food choices( 1 ). The GI metric was introduced to classify carbohydrate-containing foods systematically according to their ability to produce a postprandial glycaemic response( Reference Jenkins, Wolever and Taylor 2 , Reference Scazzina, Dall’Asta and Casiraghi 3 ). Carbohydrates in foods with lower GI values are digested and absorbed more slowly and consequently have a lower impact on blood glucose( Reference Brand-Miller, Hayne and Petocz 4 ). Low-GI foods increase insulin sensitivity( Reference Brand-Miller, Hayne and Petocz 4 ) and are the preferred choice for glycaemic control( Reference Frost, Leeds and Trew 5 ). High-GI diets are associated with higher insulin levels and increased risk of diabetes( Reference Brand-Miller, Hayne and Petocz 4 ). Mechanistically, high-GI foods may stimulate insulin secretion or induce pancreatic β-cell dysfunction, resulting in impaired glucose tolerance and type 2 diabetes( Reference Brand-Miller, Hayne and Petocz 4 ). GI has proven to be a useful nutritional concept, providing insight into the relationship between food and health( Reference Foster-Powell, Holt and Brand-Miller 6 ).
GI values of carbohydrate-rich foods vary widely due to physiological and nutritional factors including digestibility, nutrient composition, particle size and methods used for cooking and food processing. Dietary protein, fat and fibre can alter digestibility and gastrointestinal transit time and affect glucose absorption, and some fatty acids and amino acids cause insulin and glucagon secretion and thereby affect blood glucose level( Reference Meng, Matthan and Ausman 7 ). Different cooking or processing methods (boiling, roasting, baking and frying) also affect the properties of foods and their GI values( Reference Bahado-Singh, Wheatley and Ahmad 8 ). As a result, the GI values for a single food type can vary widely for different cooking or processing methods (e.g. different manufacturers).
GI values are evaluated based on glycaemic responses to isoglucidic amounts of foods (same amount of available carbohydrate), which often do not represent a typical serving size( Reference Foster-Powell, Holt and Brand-Miller 6 ). The concept of glycaemic load (GL) was introduced to address serving size. GL provides an estimate of the glycaemic effect of a standard portion of food, taking into account both GI and the amount of carbohydrate consumed( Reference Foster-Powell, Holt and Brand-Miller 6 ).
Previous studies on GI which are the basis of international GI tables have been conducted mainly in Western countries( Reference Scazzina, Dall’Asta and Casiraghi 3 , Reference Foster-Powell, Holt and Brand-Miller 6 , Reference Atkinson, Foster-Powell and Brand-Miller 9 ). There are only a few published databases listing GI and GL values for foods prepared and consumed in Asia( Reference Bahado-Singh, Wheatley and Ahmad 8 , Reference Sun, Lee and Tan 10 , Reference Yang, Wang and Cui 11 ), and these do not reflect the diversity of foods, ingredients and cooking methods used throughout Asia. Korean food occupies a prime position in Asian cuisine and is typified by a high-carbohydrate diet including cereal grains, noodles, bread and starchy vegetables prepared using a variety of methods. There is a need for information on GI values for foods, how these values vary with cooking method and how much of different foods are consumed by Koreans in practice (included in GL values). In this study, we provide a comprehensive list of GI and GL values for common Korean carbohydrate-rich foods according to the food type and cooking methods by healthy individuals.
Methods
Subjects
A total of 195 healthy male volunteers were recruited through open recruitment, and a total of 152 subjects were enrolled in the study. Before inclusion, potential participants were briefed on all aspects of the experiments. Following subjects’ consent, health examinations were performed, which included anthropometric measurements and health questionnaires addressing foods allergies or intolerances, metabolic disease, smoking habits and exercise. Participants who met the following inclusion criteria were enrolled: age 19–40 years; stable body weight; BMI ≥18·5 and <23·0 kg/m2; systolic blood pressure 110–120 mmHg; diastolic blood pressure 75–85 mmHg; fasting blood glucose <5·5 mmol/l; no known food allergy or intolerance; no medications known to affect glucose tolerance; no history of diabetes mellitus or use of antihyperglycaemic drugs or insulin injection to treat diabetes or related conditions; no major medical or surgical event requiring hospitalisation within the preceding 3 months; no diseases or drug(s) that influence digestion or nutrient absorption; and no use of steroids, protease inhibitors or antipsychotics (all of which have major effects on glucose metabolism and body fat distribution).
Anthropometric measurements were performed with subjects in a fasting state. BMI and percentage body fat were determined using a body composition analyser (Inbody 720; Biospace Co.).
The study was conducted according to the guidelines of the Declaration of Helsinki, and all procedures involving human subjects were approved by the ethical research board of Kyung Hee University Hospital (no. KMC IRB 1306-01).
All analyses were performed at the Kyung Hee University in Seoul, South Korea. The protocol was adapted from the FAO/WHO( 1 ) and International Standards Organization (ISO) 2010( 12 ) and from other GI evaluation methodology( Reference Brouns, Brouns and Bjorck 13 ).
Study protocol
In accordance with ISO 2010 guidelines( 12 ), tests of forty-nine food items in four categories (cereal grains, noodles and pasta, breads and other processed grains and starchy vegetables) were classified into twelve series of sets. One set consisted of test for reference food (glucose) twice and two to six different foods. For each set, fifteen subjects were recruited, and then tested reference food twice and two to six different foods. All subjects tested the reference food (glucose) twice, and then two to six different foods for total of four to eight tests on separate days in one set. To determine the GI of a food with sufficient power and precision, ISO 2010 recommends performing the test with a minimum of ten subjects( 12 ), thus, fifteen subjects were recruited for each set, twelve to fourteen subjects were enrolled, and a minimum of ten subjects were tested. Subjects were asked to consume no alcohol on the evening before the test, to perform no vigorous exercise the morning of the test and to avoid eating or drinking anything except water for 10 h before the test.
Test foods
A total of forty-nine carbohydrate-rich foods representing the diversity of foods commonly consumed in Korea were selected from the Korean National Health and Nutrition Examination Survey food database (Table 1)( 14 ). Foods were categorised as cereal grains (n 10; including white rice, glutinous white rice and barley), noodles and pasta (n 9; fine noodles, fresh wheat noodles, wheat dough pieces, udon noodles, spaghetti, rice noodles, ramyeon, buckwheat noodles and sweet potato starch vermicelli), breads and other processed grains (n 13; white bread, rye bread, rice bread, castella, bread rolls and bagels, pancakes, breakfast cereals and starch jellies) and starchy vegetables (n 17; maize, potatoes, sweet potatoes, chestnuts, red beans and sweet pumpkin). Foods were selected based on the market share of the producer and were obtained from representative producing areas. Foods were prepared without seasoning using conventional cooking methods such as boiling, steaming, baking, porridge-making, puffing and frying. Foods were cooked on the same day as they were consumed and were offered in a typical portion size and at moderate temperature (tepid) to avoid retrogradation of starch. All foods were tested in equivalent available carbohydrate amounts (50 g). Glucose was used as the reference food( 12 ). Available carbohydrate values were determined from the Food Composition Table from the Rural Development Administration in Korea( 15 ) or from the manufacturer. Table 1 lists the test foods along with their ingredients and preparation methods. Subjects consumed test or reference foods at an even pace within a period of 15 min and were provided one cup (250 ml) of water. Subjects were encouraged to minimise physical activity during testing.
Table 1 Ingredients and preparation methods of Korean carbohydrate-rich foods

Blood glucose measurements
A qualified technician performed blood glucose measurements in venous blood. A fasting blood sample was taken at 0 min, and the reference or test food was consumed immediately. Further blood samples were collected at 15, 30, 60, 90 and 120 min and were assayed for glucose level. Blood glucose concentrations were measured using glucose-hexokinase method (Glu Reagent kit; Roche Diagnostics Ltd) by chemistry analyser (Modular PE, Modular Analytics; Roche Diagnostics Ltd).
Calculation of glycaemic index and glycaemic load
Mean blood glucose concentration of all subjects at each time point were calculated and used to plot average blood glucose response curves. The incremental area under the blood glucose curve (IAUC) was calculated using the trapezoid rule, and the area below the fasting baseline was ignored. Calculations were performed using GraphPad Prism (version 6, GraphPad Software).
GI for each test food eaten by each subject was calculated using the equation: GI = (IAUC test food/IAUC reference food) × 100. The GI of each food was calculated as the mean GI for all subjects consuming that food. Foods were classified into low (≤55), medium (56–69) or high (≥70) GI( Reference Atkinson, Foster-Powell and Brand-Miller 9 ).
GL was calculated using the equation: GL = (GI × available carbohydrate in a typical serving size (g))/100( Reference Atkinson, Foster-Powell and Brand-Miller 9 ). The serving size of each food was obtained from standard food portion size references( 16 – 18 ) or from the manufacturer’s information.
Statistical analyses
All statistical analyses were performed using SPSS (version 22.0; IBM Corporation). GI values are reported as means with their standard errors, as in the ISO methodology( 12 ). One-way ANOVA and Duncan’s multiple range test were used to compare the GI values within food categories. Statistical significance was set at P <0·05.
Results
The mean age of the 149 male participants was 23·3 (sem 1·9) years (range, 20–34 years). Mean BMI was 21·6 (sem 1·1) kg/m2 (range, 19·0–23·4 kg/m2) and mean body fat was 16·6 (sem 3·6) % (range, 7·6–24·7 %). The average fasting blood glucose concentration was 5·1 (sem 0·4) mmol/l (range, 4·6–5·4 mmol/l). Anthropometric characteristics are reported in Table 2. Based on ISO 2010, 0·8 % of individual GI measurements were excluded because they exceeded the mean by at least two standard deviations.
Table 2 Baseline characteristics of study subjects (n 152) (Mean values and standard deviations)
* Fasting blood glucose under 5·5 mmol/l measured in capillary whole blood obtained by a finger prick (Accu-check; Roche).
Table 3 lists the GI and GL values for all forty-nine tested foods. GI values for cereal grains ranged from low (35·4 for cooked barley) to high (96·9 for rice balls), and GL values for cereal grains ranged from medium (10·4 for barley powder) to high (71·6 for steamed glutinous rice). The GI of rice gruel was significantly higher than that of rice cakes (P <0·05). There was no difference in GI for different cooking methods of glutinous rice. In food made with barley, powdered barley had a significantly higher GI than steamed barley (P <0·05).
Table 3 Glycaemic index (GI) and glycaemic load (GL) values for Korean carbohydrate-rich foods (Mean values with their standard errors)

a,b Mean values in a column with unlike letters were significantly different between groups (P <0·05).
* Significantly different among same food category by ANOVA and Duncan’s multiple range test (P <0·05).
† Reproduced by permission of the Korean Society of Food Science and NutritionReference Kim, Lee and Choi (30) .
For noodles and pasta, GI showed a narrow low to medium range, from 48·2 for fresh wheat noodles to 60·0 for sweet potato starch vermicelli; noodles and pasta had GL values that ranged from medium to high (10·6 for sweet potato starch vermicelli to 44·6 for ramyeon).
For bread, the GI ranged from medium to high (56·2 for soft rolls to 77·4 for bagels) and GL ranged from medium to high (12·2 for soft rolls to 26·0 for bagels). GI of other processed grains ranged from low to high (49·9 for pan-fried buckwheat to 71·7 for acorn jelly) and GL values ranged from low to medium (1·9 for green bean jelly to 16·6 for wheat pancakes).
Starchy vegetables showed a range of GI values, from low for chestnuts, pumpkin and red beans, to medium to high for maize. The GI of potatoes and sweet potatoes differed according to the cooking method (P <0·05). The GL values ranged from low to high (1·8 for boiled red beans to 33·0 for maize gruel).
Fig. 1 shows the GI and GL values of grains and starchy vegetables by different cooking methods. GI values of foods varied widely by different cooking methods. For example, for steamed grains, glutinous rice had a high GI, white rice medium GI and barley low GI, and for gruel, rice and maize had high GI, and red beans and pumpkin low GI. For steamed vegetables, only sweet pumpkin had a low GI, and for baked vegetables, chestnuts had low GI, and for frying, potato had low GI.
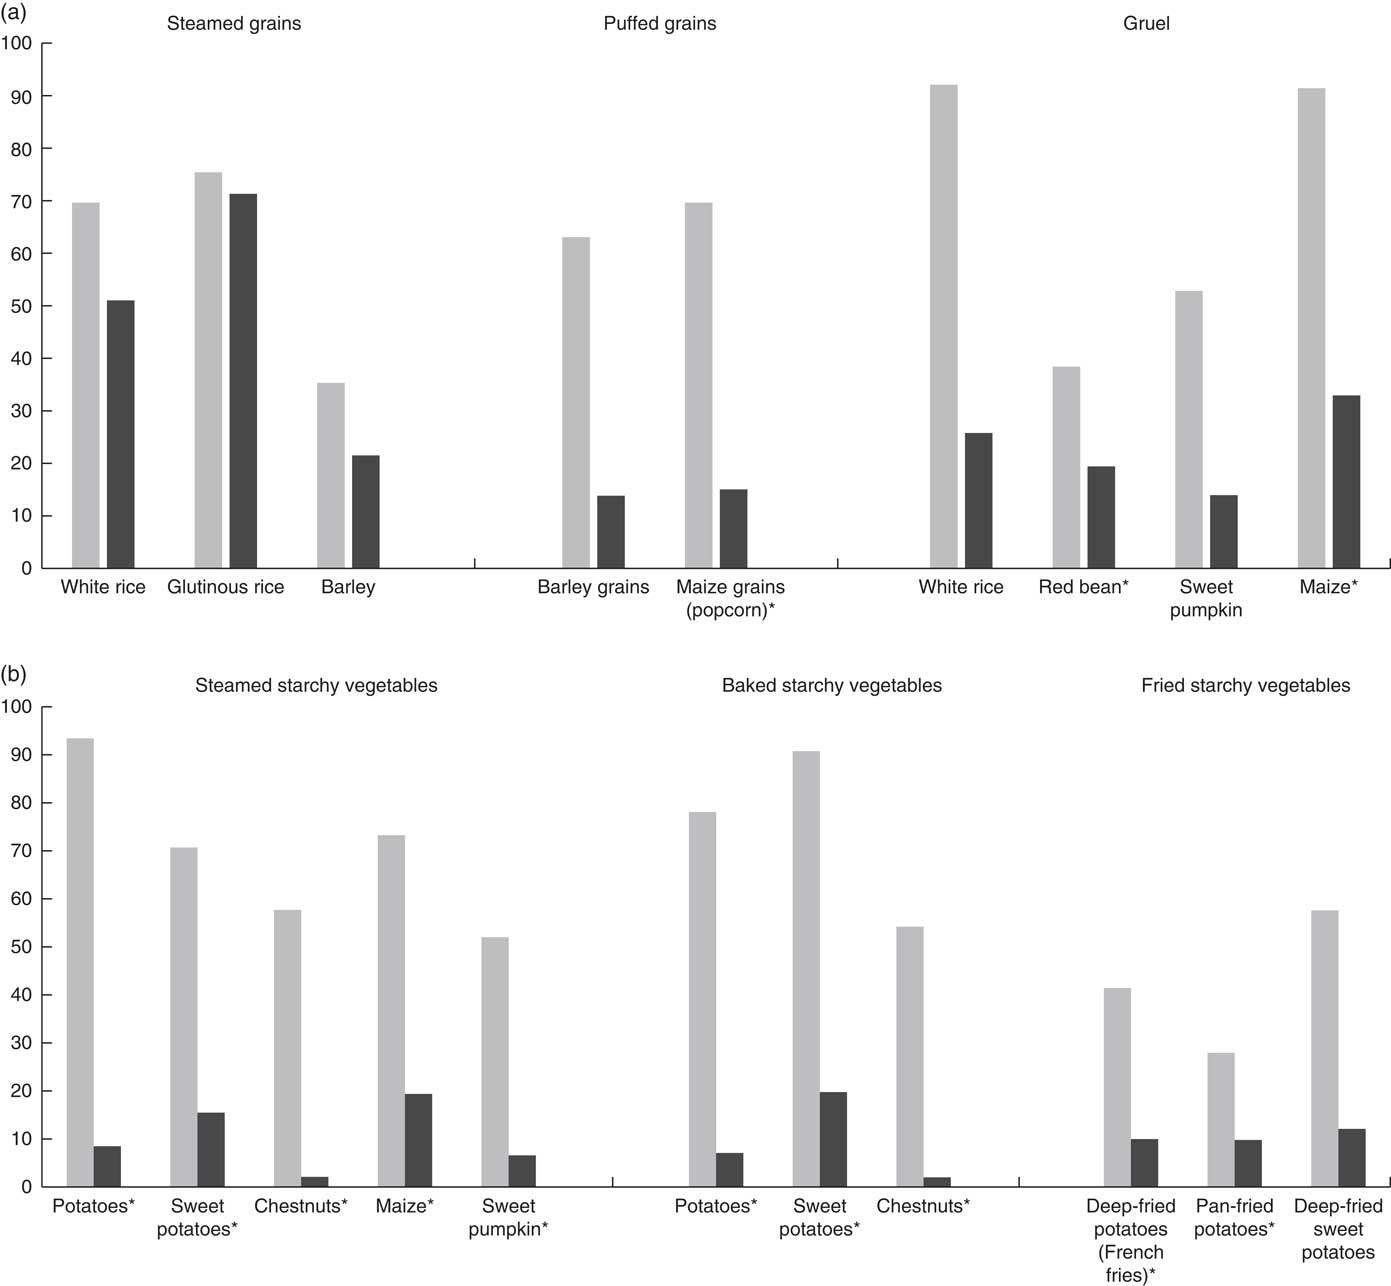
Fig. 1 Glycaemic index (![]() ) and glycaemic load (
) and glycaemic load (![]() ) of grains and starchy vegetables by different cooking methods. (a) Steamed grains, puffed grains and gruel; (b) steamed, baked and fried starchy vegetables. *Reproduced by permission of the Korean Society of Food Science and NutritionReference Kim, Lee and Choi
(30)
.
) of grains and starchy vegetables by different cooking methods. (a) Steamed grains, puffed grains and gruel; (b) steamed, baked and fried starchy vegetables. *Reproduced by permission of the Korean Society of Food Science and NutritionReference Kim, Lee and Choi
(30)
.
The GI and GL values of carbohydrate-rich foods are combined in a two-dimensional grid in Fig. 2. Cereal grains had GI values that vary widely from low to high and GL mainly from medium to high. Noodles and pasta had GI values ranging from low to medium (40–60; at the centre of the grid) but high GL values except for sweet potato starch vermicelli. Bread and other processed grains had medium GI and GL values. Starchy vegetables had a wide range of GI depending on the food type and cooking method but low GL values.
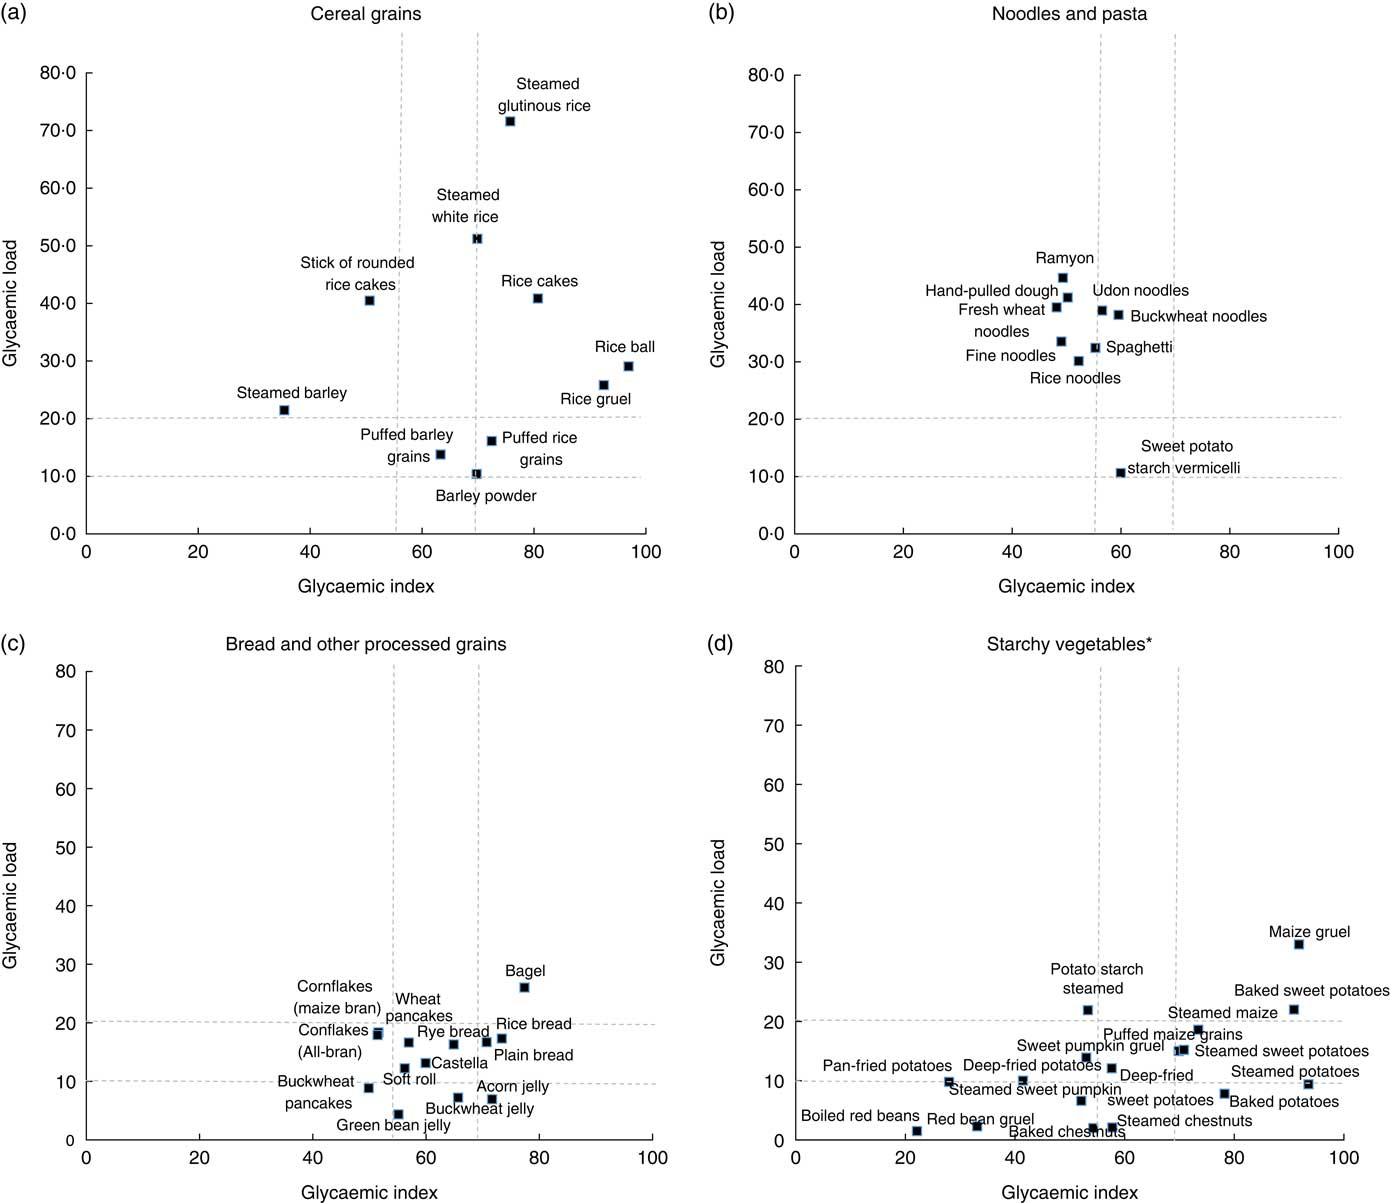
Fig. 2 The relation of glycaemic index and glycaemic load of carbohydrate-rich foods by food categories. (a) Cereal grains, (b) noodles and pasta, (c) bread and other processed grains and (d) starchy vegetables. *Reproduced by permission of the Korean Society of Food Science and NutritionReference Kim, Lee and Choi (30) .
Discussion
We found that the GI and GL values of forty-nine carbohydrate-rich foods varied between food type and between cooking methods for the same food type.
This data set provides a useful reference for guiding food choices and demonstrates that GI values are influenced not only by species( Reference Foster-Powell and Miller 19 ) but also by structural characteristics such as particle size and shape( Reference Foster-Powell and Miller 19 ), starch content (e.g. amylose v. amylopectin)( Reference Sugiyama, Tang and Wakaki 20 ), soluble fibre amount( Reference Chillo, Ranawana and Pratt 21 ) and cooking method( Reference Foster-Powell and Miller 19 , Reference Sugiyama, Tang and Wakaki 20 ). Cereal grains, which are a major source of energy in the Korean diet, tend to have high GL values and the widest range of GI values according to cooking method. Noodles are often used as the main meal ingredient instead of rice in Korea and were also found to have high GL despite a low to medium GI due to the large amount of carbohydrates in a typical serving. Bread and other carbohydrate products have intermediate GI and GL values because of their structural properties and portion size( Reference Sugiyama, Tang and Wakaki 20 ). The GI values for food made with starchy vegetables varied widely for different cooking but tended to have low GL values due to smaller amounts of carbohydrates in a typical portion.
Several characteristics of carbohydrate-rich foods can alter their GI values. First, they might be composed of different species of starches and have different fibre contents. For example, glutinous rice has a higher GI than white rice because of the relative percentages of amylopectin and amylose( Reference Sugiyama, Tang and Wakaki 20 ). Amylopectin has a high absorption rate and causes high blood glucose because digestive enzymes can easily access the structure of the starch chain; the opposite is true for amylose-containing starch( Reference Sugiyama, Tang and Wakaki 20 ). Barley, unlike rice, has a low GI, possibly due to the soluble dietary fibre β-glucan( Reference Chillo, Ranawana and Pratt 21 , Reference Thondre and Henry 22 ). Second, different processing methods can influence the GI of a particular food ( Reference Bahado-Singh, Wheatley and Ahmad 8 ). For example, compressed and steamed white rice cakes are both made from rice flour, but compressed cakes have a stronger and stickier structure from extrusion during manufacturing, resulting in less mastication, slower digestion and lower postprandial glucose response( Reference Kim, Kim and Kong 23 ). The results revealed marked variation in GI with different cooking methods for a single food type. For example, steamed rice, rice gruel, puffed rice, boiled rice cakes and boiled and pressed rice cakes showed a wide range of GI values because these cooking methods have different effects on gelatinisation and digestibility( Reference Kim, Kim and Kong 23 ). Avoiding rapid changes in blood glucose is important for healthy adults and diabetics. Eating low-GI foods results in a lower maximum postprandial glucose levels and a slower decrease in blood glucose than intake of high-GI foods( Reference Jenkins, Wolever and Taylor 2 ). High-GI rice foods in our study included porridge, puffed rice grains and steamed rice cakes (but not regular steamed rice); high-GI starchy vegetables included steamed and baked potatoes and sweet potatoes, steamed maize and maize gruel.
It has been reported that structural properties affect the glycaemic responses to carbohydrate-rich processed foods( Reference Sugiyama, Tang and Wakaki 20 ). Fine noodles and fresh wheat noodles might have similar GI values because of their similar structural properties. Differences in GI values among noodles and spaghetti products and among breads might be due to the differences in ingredients, starch structure and processing conditions( Reference Sugiyama, Tang and Wakaki 20 ). Buckwheat pancakes had a low GI, while wheat pancakes had a medium GI, possibly because buckwheat contains the iminosugar d-fagomine, which slows the postprandial release of glucose from carbohydrates by inhibiting intestinal disaccharidases( Reference Rokka, Ketoja and Järvenpää 24 ). Cornflakes were expected to have a higher GI than All-bran, but in our study these two breakfast cereals had similar GI values. Acorn, green bean and buckwheat jellies, resulting from the gelation of starch and protein from grains and nuts( Reference Shin 25 ), had medium to high GI. Proteins can affect GI, and the protein content of green beans (24·8 %) is higher than that of acorns (5·8–7·8 %) and buckwheat (10–15 %)( Reference Cha, Cha and Chung 26 ).
Interestingly, the GI of foods made from maize, potatoes and sweet potatoes tended to be higher than those of other starchy vegetables (e.g. chestnuts, red beans and sweet pumpkin) cooked using similar methods. In this case, food structure, starch content or soluble fibre amount might have influenced the GI values( Reference Foster-Powell and Miller 19 , Reference Sugiyama, Tang and Wakaki 20 ). Potatoes and sweet potatoes which were pan-fried or deep-fried using oil had lower GI values than similar foods not containing oil. Eating fat reduces the glycaemic response by increasing insulin secretion and slowing gastric emptying by inhibiting amylase( Reference Collier, McLean and O’Dea 27 ). However, despite lower GI values, fried food intake should be moderated to prevent chronic metabolic diseases( Reference Lutsey, Steffen and Stevens 28 ). With increasing consumption of meal replacements worldwide, the current GI table will enable consumers and researchers to select low-GI foods for their respective needs. The majority of foods used in meal replacements, such as steamed potatoes and sweet potatoes, produced high GI values; therefore, reducing the consumption of high-GI foods is advisable. Interestingly, low GI values were obtained for foods made of boiled red beans, red bean gruel, steamed sweet pumpkin and sweet pumpkin gruel. These foods may have low GI because of their soluble fibre and antinutrient contents( Reference Nara, Yamaguchi and Maeda 29 ).
As with the GI, high GL indicates the likelihood of a greater elevation in blood glucose. GL accounts for portion size and allows a more representative comparison of glycaemic responses after consumption of portions of food( Reference Foster-Powell, Holt and Brand-Miller 6 ). Foods with low GI but high GL included bar rice cakes, cooked barley, fine noodles and steamed potato starch. Even if a food has a low GI, consumers should be concerned about the food’s GL value, which predicts the glycaemic response.
Our study had several limitations. GI values of foods should be considered in the context of a mixed meal. One strength of our study is that we provide information for the GI and GL values for Asian foods which are only a few published databases available listing GI and GL values, although Asian foods are gaining in popularity in the world and carbohydrate-rich foods in this region are core foods. We used the protocols of the FAO/WHO (1997) and ISO (2010) to determine GI and GL values. Moreover, we provide GI and GL values for commonly consumed carbohydrate-rich foods processed using standard cooking methods. In conclusion, the present study provides reliable GI and GL values for carbohydrate-rich foods commonly consumed according to food type and cooking methods. The results indicate that cooking or processing methods affect the GI of a particular food. Further studies are needed to investigate how GI values of foods change when consumed in a mixed meal, to improve the information available to the general public and to health professionals on GI and GL. Such additional data will help consumers make better food choices for glycaemic control.
Acknowledgements
The authors thank Dr Hansongyi Lee for her continued support. The authors also thank Dr Ryowon Choue for her invaluable advice about the research.
This study was carried out with the support of the Cooperative Research Program for Agricultural Science and Technology Development (project no. PJ009445), Rural Development Administration, Republic of Korea.
The authors’ contributions were as follows: H. L. designed the research; D.-Y. K., Y. K. enrolled participants and conducted research; Y. K. analysed the data; D.-Y. K. wrote the first draft of the manuscript; H. L. had primary responsibility for final content and all authors read and approved its final contents.
No conflict of interest is declared by any of the authors.


