


Chronic kidney disease (CKD) has a high prevalence in domestic cats, with approximately 33 % of those over the age of 12 years being affected( Reference O’Brien and Osborne 1 ). CKD is defined as a sustained decrease in renal function over at least 3 months and is an important cause of morbidity and mortality in the cat population. Both congenital and acquired disorders can lead to the development of CKD and acute kidney damage owing to urinary obstruction, nephrotoxins and pyelonephritis, or ischaemic injury can also progress to chronic disease( Reference Elliott and Lefebvre 2 ). Although dietary P is essential for life, unrestricted P intake has been associated with the progression of existing renal disease( Reference Elliott and Lefebvre 2 , Reference Dibartola and Willard 3 ). There is, however, little evidence to indicate adverse effects of high P intake in healthy adult cats. For this reason, there is currently no safe upper limit for feline dietary P cited in nutritional guidelines set out by the US National Research Council (NRC), European Pet Food Industry Federation or Association of American Feed Control Officials (AAFCO)( 4 – 6 ).
The first study to suggest a link between high dietary P and reduced renal function in healthy adult cats was reported by Pastoor et al. ( Reference Pastoor, Klooster and Mathot 7 ). To evaluate the effects of high P intake, the authors fed a purified test diet containing 3·6 g P/1000 kcal (4184 kJ) with a Ca:P ratio of 0·3 for 4 weeks. A small, but significant, reduction in endogenous creatinine clearance and a slight decrease in plasma P were reported in cats offered the test diet compared with those offered P at a level of 2·3 g/1000 kcal (4184 kJ) or below( Reference Pastoor, Klooster and Mathot 7 ). A neutral P balance was observed owing to an increase in both urinary and faecal P excretion when higher levels were fed, suggesting that P levels were regulated and excess P excreted rather than retained. These authors recommended that high dietary P levels should be discouraged owing to the associated reduction in plasma P concentrations and creatinine clearance. Subsequently, Dobenecker et al. ( Reference Dobenecker, Webel and Reese 8 ) offered thirteen healthy adult cats a diet comparable to a home-prepared formulation with a total P of 3·0 g/1000 kcal (4184 kJ) with approximately 2·0 g/1000 kcal (4184 kJ) supplemented as calcium monophosphate and sodium dihydrogen phosphate (SDHP) with a Ca:P of 0·4. After 29 d of feeding, in agreement with the findings of Pastoor et al. ( Reference Pastoor, Klooster and Mathot 7 ), glucosuria and microalbuminuria were observed, creatinine clearance significantly decreased and blood urea nitrogen content increased( Reference Dobenecker, Webel and Reese 8 ).
It has been suggested previously in several species that P homoeostasis is not only influenced by total dietary P content and the Ca:P, but also by the source of P( Reference Siedler and Dobenecker 9 – Reference Matsuzaki, Kikuchi and Kajita 11 ). Dietary P provided by organic raw materials (e.g. poultry meal or meat and bone meal) has been shown to be less bioavailable than that arising from added inorganic sources (e.g. P containing mono and dibasic Na salts)( Reference Pastoor, Klooster and Mathot 7 , Reference Finco, Barsanti and Brown 12 ). P-based additives are widely used in commercial food manufacturing not only to supplement essential P but also to serve a number of processing functions including pH stabilisation, metal cation sequestration, emulsification, leavening, hydration and as antibacterials( Reference Gutiérrez 13 ). This difference in bioavailability is probably because of in vivo binding of organic P to proteins and intra-cellular signalling molecules, while inorganic P salts are readily disassociated and absorbed( Reference Noori, Sims and Kopple 10 ). Data from rats fed high-phosphate diets supplemented with monophosphate or polyphosphate salts has indicated that the development of nephrocalcinosis and diminished kidney function is more severe when polyphosphate salts as compared with monophosphate salts are fed( Reference Matsuzaki, Kikuchi and Kajita 11 ). In cats, Finco et al. ( Reference Finco, Barsanti and Brown 12 ) compared a diet with 100 % P from an organic source (total P content 2·7 g/1000 kcal (4184 kJ), Ca:P 1·6) with a diet containing a similar total P (3·3 g/1000 kcal (4184 kJ) and Ca:P 1·4), but with 63·5 % P from neutral monobasic/dibasic sodium phosphate. These authors noted a greater percentage recovery of P in the urine when the high-inorganic P diet was fed compared with the organic P diet (34·9 % compared with 14·7 %). However, these findings may have been influenced by the higher Na level present in the inorganic P diet, which is known to increase P absorption by stimulating Na+-dependent uptake of phosphate( Reference Marks, Lee and Nadaraja 14 ).
Together, these studies highlight a possible risk of changes in renal function when healthy adult cats are fed diets containing levels of P in excess of 3·0 g/1000 kcal (4184 kJ), or when high levels of P from inorganic sources are included in diets. However, the available evidence is not conclusive and the published data do not determine whether the reported changes exceeded normal reference ranges or have clinical relevance. The diets used in these studies do not represent commercially relevant formats being either purified( Reference Pastoor, Klooster and Mathot 7 ) or representative of ‘home-prepared’ diets( Reference Dobenecker, Webel and Reese 8 ). Therefore, to elucidate the effects of dietary P in cats, a long-term feeding study was initiated with the objective of evaluating the health effects of an extruded dry format diet containing total and inorganic P (in the form of SDHP), at levels higher than previously reported, but possible in some commercial pet foods( Reference Davies, Alborough and Jones 15 ). This study observed adverse changes in markers of renal health after 4 weeks of feeding and was terminated at this stage. We hypothesised that the adverse effects may have been due to the inclusion of highly available inorganic SDHP. Subsequently, a second 29-week study was initiated in which an extruded dry format diet with a lower inclusion of inorganic SDHP and a total P level equivalent to that previously reported by Pastoor et al. ( Reference Pastoor, Klooster and Mathot 7 ) was fed, in an attempt to identify a level of dietary P inclusion resulting in no observed adverse effects level (NOAEL) in adult cats.
Methods
Study design
This work was approved by the WALTHAM Animal Welfare and Ethical Review Body and conducted under the authority of the Animals (Scientific Procedures) Act 1986.
Study 1
In a parallel design, forty-eight healthy neutered adult cats (twenty-three males and twenty-five females) aged between 1·7 and 9·1 years at the start of the study were stratified into two study groups and offered one of two extruded dry format diets, differing in P content and Ca:P. Throughout an initial baseline period of 20 weeks, all cats were offered a control diet 74 % lower in P than the test (Table 1), and baseline measurements were made within the final 4 weeks. Subsequently, test cats were offered a high-P test diet (Table 1), whereas the control cats remained on the control diet. After 4 weeks, measurements were repeated for both groups. Following review of these data, the study was terminated and the test cats returned to the control diet in week 6.
Table 1 Diet composition*
PME, predicted metabolisable energy.
* Diet analysis g/1000 kcal (4184 kJ) or g/100 g DM.
† Value after supplementation of Ca at 200 mg/1000 kcal (4184 kJ).
‡ International units IU/1000 kcal (4184 kJ) or IU/100 g.
§ Calculated by proximate analysis to PME kcal/100 g according to LaFlammeReference Laflamme (75) .
Study 2
In a parallel design, fifty healthy neutered adult cats (twenty-nine males and twenty-one females) aged between 1·4 and 7·8 years at the start of the study were stratified into two study groups and offered one of two extruded diets, differing in P content and Ca:P. Throughout an initial baseline period of 10 weeks, all cats were offered a lower P control diet (Table 1) and baseline measurements were made towards the end of this phase. Subsequently, test cats were offered a moderate P test diet (Table 1), whereas the control cats remained on the lower P control diet. Measurements were repeated after 2, 4, 8, 12, 20 and 28 weeks.
Animals and housing
Study 1 included forty-eight healthy neutered adult cats stratified into two study groups balancing energy intake, body weight (BW) and age. The control group was made up of twelve males and twelve females with a median starting age of 4·7 (1·7–8·1) years and the test of eleven males and thirteen females with a median starting age of 4·3 (1·7–9·1) years. Before selection, cats were health-screened by assessment of plasma biochemistry, haematology, urinary health parameters and abdominal ultrasound. Those with findings outside of normal range or considered abnormal by the site veterinarian were excluded, as were cats identified as having crystalluria, pre-existing uroliths, renoliths or abnormal changes in renal size or echogenicity, as determined by a diplomate of the European College of Veterinary Diagnostic Imaging (H. R.). Study 2 included fifty healthy neutered adult cats stratified into two study groups balancing energy intake, BW and age. The control group consisted of thirteen males and twelve females with a median starting age of 5·4 (1·4–7·7) years, and the test group was made up of fifteen males and ten females with a mean starting age of 4·6 (1·4–7·7) years. Before selection, cats were health-screened by applying the same criteria as for study 1. All cats were housed at the WALTHAM Centre for Pet Nutrition in social rooms, except during feeding or urine and faecal collection periods; to facilitate sample collection, they were individually housed in lodges. Cats received two 30-min meals (50 % of maintenance energy requirement) per day, a pattern they were habituated to. Throughout the study, diets were offered in amounts to maintain an ideal body condition score according to the WALTHAM Size, Health and Physical Evaluation Guide( Reference German, Holden and Moxham 16 ). Deionised water was freely available at all times. Initial energy requirements were determined using observed energy intakes over the preceding 2 months.
Diets
In study 1, single batches of two extruded dry format experimental diets were specifically formulated for this study and manufactured (Royal Canin) using the same core recipe and raw materials, but with differing levels of P.
Both diets were composed of similar quantities of pork meal, pork fat and rind, poultry fat, soya and fish oils, yeast, beet pulp, ground rice, cellulose fibre, maize flour and gluten, potassium chloride, potassium citrate, sodium chloride, magnesium oxide, calcium bicarbonate (study 1), a vitamin premix, anticaking agent and flavourings. The control diet contained 1·2 g P/1000 kcal (4184 kJ) (all provided from organic raw materials) with 1·3 g Ca/1000 kcal (4184 kJ) (Ca:P 1·1) and the higher P test diet contained 4·8 g P/1000 kcal (4184 kJ) (approximately 3·6 g/1000 kcal (4184 kJ) from inorganic sources) with 2·8 g Ca/1000 kcal (4184 kJ) (Ca:P 0·6 (Table 1). The additional Ca and P in the test diet were provided by inorganic calcium carbonate (2·6 %) and SDHP (5·2 %). However, to achieve a Ca:P of 0·6, the test diet was supplemented before feeding with calcium citrate malate (Metabolics Ltd) at a dose of 200 mg Ca/1000 kcal (4184 kJ). Diet analysis confirmed that the nutritional composition of both diets met NRC (2006) adult cat recommendations for all nutrients except choline in the test diet, which was supplemented with 118 mg/1000 kcal (4184 kJ) choline chloride (Metabolics Ltd) to ensure compliance (online Supplementary Table S1).
In study 2, single batches of two extruded dry format experimental diets were specifically formulated for this study and manufactured (Royal Canin) using the same core recipe used in study 1 and the same raw materials for both diets with additional pork meal added to the test diet. Control diet contained 1·3 g P/1000 kcal (4184 kJ) (all provided from organic raw materials) with 1·6 g Ca/1000 kcal (4184 kJ) (Ca:P 1·2) and the moderate P test diet contained 3·6 g P/1000 kcal (4184 kJ) (approximately 1·5 g/1000 kcal (4184 kJ) from inorganic sources) with 3·3 g Ca/1000 kcal (4184 kJ) (Ca:P 0·9) (Table 1). The additional Ca and P in the test diet were provided through organic sources: bone ash from protein meal supplemented with inorganic calcium carbonate (1·5 %) and SDHP (2·2 %). Both diets met NRC (2006) recommendations for adult cats (online Supplementary Table S1).
All diets were produced through a standard extrusion process commonly used in the pet food industry( Reference Rokey 17 ). Diet ingredients were mixed before being extruded and kibbled under identical processing conditions in a single-screw extruder (Royal Canin). All nutritional chemical analyses were carried out using Association of Official Agricultural Chemists (AOAC) procedures at Eurofins Ltd.
Measures
Intake was recorded on an individual basis as mass (g) of diet offered minus mass (g) of diet refused. BW was recorded weekly (in kg) on a standard scale (FB 34 3DE P top-pan balance; Sartorius).
Mineral balance
At baseline and after 4, 12, 20 and 28 weeks of feeding, five day total faeces and urine collections were carried out to determine mineral apparent digestibility. Samples were analysed for Ca using flame photometry and P using spectrophotometry at the Royal Canin SAS European Regional Laboratory. Faeces were stored frozen at –20°C in a sealed container until processing. Each pooled 5-d faecal collection was weighed and then freeze-dried (VirTis Benchtop BTP9ES Freeze Dryer, Biopharma Process Systems). Once dried, the faeces was reweighed and manually homogenised in a mortar and pestle; any foreign material was removed and weighed separately. A 20-g aliquot of the homogenate was analysed for moisture, crude fibre and ash content, according to methods described in the Journal Official de l’Union Européenne procedures( 18 ); fat content was determined by acid hydrolysis followed by diethyl ether extraction and crude protein calculated from total N content by combustion using the Dumas principle according to Association Française de Normalisation (AFNOR ISO 16634-1:2008 November 2008). P content was determined via spectral photometry and Ca and Mg by flame photometry according to AFNOR methodology at Invivo Labs Chateau-Thierry. Apparent mineral digestibility (%) was calculated for Ca and P to represent the fraction of the minerals that were retained from the diet rather than being excreted in the faeces using the following formula:
 $$\eqalign {{\rm Apparent \ digestibility\,}\left( {\rm \%} \right) {\rm {\equals}((intake-faecal\ excretion)\,/\,intake)}\cr \quad{\times}{\rm 100}{\rm .}$$
Mineral balance (g) was also calculated for P and Ca as:
 $$\eqalign { {\rm Total\ mineral\ balance }\left( {\rm g} \right)\cr \quad\quad{\rm {\equals}intake-}\left( {{\rm faecal\ excretion{\plus}urinary\ excretion}} \right)$$
Urine mineral content and relative super saturation (RSS)
All urine excreted over a 3-d (study 1) or 5-d (study 2) period was collected and urine pH assessed twice daily. The method for urine RSS analysis has been previously described( Reference Robertson, Jones and Heaton 19 ). Samples were analysed for oxalate, citrate, pyrophosphate, K, Ca, Na, ammonium, chloride, sulphate and phosphate via HPLC. The concentrations of minerals were then analysed by SUPERSAT software( Reference Robertson, Jones and Heaton 19 ) to calculate the RSS (activity product/solubility product) for struvite (magnesium ammonium phosphate (MAP)), calcium oxalate (CaOx) and brushite (study 2 only). The urine P and Ca content were determined via spectral photometry and flame photometry, respectively, according to AFNOR methodology at Invivo Labs Chateau-Thierry and used for calculation of the urinary fractional excretion of these minerals.
Urinalysis
At baseline and after 4 weeks of feeding (study 1) or baseline and after 4, 12, 20 and 28 weeks of feeding (study 2), a 5-ml freshly voided urine sample was collected from each cat, and creatinine, microalbumin, pH, urine-specific gravity, glucose, pH and urine protein creatinine ratio were measured (InSight MS-11 and MS-2 Vet urine strips; Woodley Equipment Company Ltd) within 30 min. Specific gravity was also determined using a refractometer (Sinotech RHCN-200ATC; Sinotech) and urine albumin and creatinine measured using the Beckman Coulter microalbumin (OSR6167) and creatinine (OSR6178) assays for the Olympus AU480 biochemistry analyser (Olympus Europe GmbH). The urine albumin:creatinine ratio (UACR) was then calculated for each sample.
Blood-based measures
At baseline and every 2–8 weeks thereafter, morning fasted (>12 h) blood samples were collected for the measurement of standard biochemistry and haematology, ionised Ca (iCa), vitamin D metabolites, TAG, markers of bone turn-over, serum crosslaps (CTx) and bone-specific alkaline phosphatase (BAP), parathyroid hormone (PTH) and fibroblast growth factor 23 (FGF23). EDTA-treated blood was used to measure standard haematology parameters (leucocyte and erythrocyte counts, Hb concentration, haematocrit, platelet count, mean corpuscular volume, mean corpuscular Hb, number and percentage of lymphocytes, monocytes and granulocytes) via a Mythic 18 cell counter (Orphee).
Lithium-heparinised plasma was analysed to quantify standard biochemistry parameters (total protein, albumin, phosphate, alkaline phosphatase (ALP), alanine transaminase, aspartate aminotransferase, Ca, cholesterol, urea, creatinine, TAG and glucose). In study 1, this was carried out in-house using an AU480 (Olympus) analyser. In study 2, heparinised serum was sent to an external laboratory (IDEXX Laboratories) for biochemical analysis as in study 1 with the addition of symmetric dimethylarginine (SDMA) measurement. Serum was collected for the measurement of markers of bone turnover: BAP and CTx using the BAP MicroVue™ Quidel ELISA (TECO Medical Group) and CartiLaps® ELISA (Immunodiagnostic Systems Ltd), both according to the manufacturer’s instructions. In the Department of Comparative and Biomedical Sciences, Royal Veterinary College, London, EDTA plasma was analysed to quantify intact plasma FGF23 concentrations using a sandwich ELISA (Kainos Laboratories Inc.) as detailed by Geddes et al. ( Reference Geddes, Finch and Elliott 20 ) and PTH concentrations by a total intact PTH immunoradiometric assay (Scantibodies Laboratory, Inc.) previously validated for use with feline samples( Reference Williams, Elliott and Syme 21 ). Serum was also collected for the measurement of the vitamin D metabolites 25-hydroxyvitamin D (25(OH)D) and 24,25-dihydroxyvitamin D (24,25(OH)2D) by liquid chromatography (LC)/MS–MS (Agilent) using a modified method described by Aronov et al. ( Reference Aronov, Hall and Dettmer 22 ). Serum was also collected for the measurement of the vitamin D metabolites at the Bioanalytical Facility at the University of East Anglia, Norwich, UK. Total 25(OH)D, total 24,25(OH)2D and the epimer C3-Epi-25(OH)D3 were measured by LC/MS–MS (performed using a Micromass Quattro Ultima Pt Mass Spectrometer (Waters Corp.). Total serum 1,25-dihydroxyvitamin D (1,25(OH)2D) levels were measured using an EIA Kit (IDS Ltd). iCa analysis was conducted using heparinised whole blood in a Stat Profile Prime Critical Care analyser (Nova Biomedical).
Plasma and serum calcium–phosphorus (CaP) product (mmol2/l2) was calculated by multiplying plasma total Ca and inorganic P concentrations in mmol/l.
Renal measures
In study 1, at baseline and 5 weeks after diet change, and in study 2 at baseline, 5, 13, 21 and 29 weeks after diet change, iohexol clearance tests were carried out as an estimate of glomerular filtration rate (GFR) using the method described by Finch et al. ( Reference Finch, Syme and Elliott 23 ). Briefly, for topical anaesthesia, 2 ml of EMLA cream (2·5 % lidocaine, 2·5 % prilocaine; AstraZeneca) was applied to the skin over the cephalic veins and covered for 1 h before removal and aseptic preparation of the area with chlorhexidine gluconate. The cephalic vein was raised by pressure to the dorsal aspect of the foreleg and a catheter was inserted into the vein before flushing with 0·5 ml of heparinised saline (100 IU/ml of heparin in 0·9 % saline; Wockhardt UK Ltd). A discard volume of 300 µl was removed from the catheter and 647 mg/kg iohexol (Omnipaque 300; Amersham Health) was administered over a 3-min period, followed by a heparinised saline flush. The completion of the injection represented time zero. Blood samples of 1 ml volume were collected via a cephalic catheter into serum tubes at 2, 3 and 4 h post infusion. Iohexol concentration in the serum of each cat at each time point was analysed using high-performance capillary electrophoresis (undertaken in the laboratories of deltaDOT Ltd and London BioScience Innovation Centre). Weight-adjusted clearance (in ml/kg per min) was calculated by the slope of the concentration gradient.
The fractional excretion of P (FEP) and Ca (FECa) was calculated as the percentage filtered by the glomerulus excreted into the urine, expressed as a ratio to creatinine clearance as below:
 $$\kern 0pt\eqalign {&\,\%\,\;{\rm FE}\cr&{\equals}{{{\rm urinary}\;{\rm concentration}\;{\rm of}\;[{\rm X}]{\times}{\rm circulating}\;{\rm creatinine}\;{\rm concentration}} \over {{\rm urinary}\;{\rm concentration}\;{\rm of}\;{\rm creatinine}{\times}{\rm circulating}\;[{\rm X}]\;{\rm concentration}}}\cr&\hskip11pt{\times}100$$
Imaging: at baseline and at the end of both studies, general physical health examinations, whole-body radiographs and abdominal ultrasound scans were carried out to detect soft tissue mineralisation, urolithiasis or other pathologies. Radiographs of the abdomen were taken in ventrodorsal and right lateral recumbency, those of the thorax were taken in right lateral recumbency (AGFA CR 30-X, exposure range 46–64 kV, 2·36–4·73 mAs) and full abdominal ultrasound scans (GE Logiq-E with a linear probe 307 12L-RS, 5–13 mHz, 47 mm footprint) were performed, with the cats under sedation (induced through administration of 0·3 mg/kg butorphanol 0·025 mg/kg dexmedetomidine and reversed with 0·075 mg/kg atipamazole). All scans and interpretation of the radiographs were carried out by a diplomate of the European College of Veterinary Diagnostic Imaging (H. R.) who was blinded to the dietary grouping.
Post-mortem and histological investigations
In study 2, one cat from the test group presenting at week 27 with acute renal failure did not respond to treatment and was euthanised following a pre-defined clinical management pathway. Post-mortem and histological investigations, including Von Kossa staining to visualise Ca mineralisation( Reference Von Kossa 24 ), were carried out by a diplomate of the European College of Veterinary Pathologists at the Animal Health Trust, Diagnostic Laboratory Services, Lanwades Park, Kentford, Newmarket, Suffolk, UK.
Statistical power
Both studies were powered according to the primary response variable GFR (iohexol clearance ml/min per kg), by simulation using baseline values from study 1 to estimate variance. To detect a change in distribution where 10 % of cats had values <0·92 ml/min per kg, with approximately 80 % power and using a test level of 5 %, twenty cats were required per diet group. An additional 4–5 cats/group were used in study 1 and an extra five in study 2, to allow for potential drop-out.
Statistical analysis
For each measure, linear mixed model, restricted maximum likelihood (REML) analyses were performed to estimate variance parameters allowing for repeated measures on each subject over time. Specifically, a random effect of cat and categorical fixed effects of diet, week and their interaction were used. For some measures, data were missing due to samples not taken or undue assay variability; however, the REML method of analysis was used to account for this and assumed these values were missing at random. The model made use of the incomplete data so that these did not bias the estimates. Distributional assumptions were checked to ensure robustness of the statistical models by performing residual checks (e.g. for randomness and constant variance). Residuals were found to have increasing variability for a number of measures, and these were log10 transformed before analyses.
GFR was the primary measure; however, an overall test level of 5 % was also applied for all other supportive measures regarded as secondary. Planned comparisons were calculated between diet groups at baseline and within and between each diet groups from baseline to subsequent time points. For each measure, family-wise adjustments were made for the number of comparisons to maintain an overall test level at 5 %. Accordingly, mean, difference in mean or fold change of mean (where log10 transformation was necessary) are reported with 95 % family wise CI. Analyses were performed in R version 3.3.3( 25 ) using libraries ‘lme4’ for linear mixed effects models( Reference Bates, Maechler and Bolker 26 ), ‘multcomp’ for simultaneous inference of planned contrasts( Reference Hothorn, Bretz and Westfall 27 ) and ‘ggplot’( Reference Wickham 28 ) for figures.
Results
For behavioural reasons, occasional missed or partial samples occurred and sample numbers are presented in the relevant figures and tables.
Study 1
Intake and body weight
Increased incidence of vomiting was noted in the test group from week 1 of feeding and average daily energy intake (per kg BW) reduced significantly (P <0·001) in the test group from 43·14 (95 % CI 39·23, 47·05) to 37·56 (95 % CI 33·65, 41·47) kcal/kg BW (180·5 (95% CI 164·1, 196·9) to 157·1 (95% CI 140·8, 173·5) kJ/kg BW) and this change was significantly (P <0·001) different from the control group, which remained stable at 42·87 (95 % CI 38·96, 46·78) kcal/kg baseline and 43·93 (95 % CI 40·02, 47·84) kcal/kg BW (179·4 (95% CI 163·0, 195·78) kJ/kg baseline and 183·8 (95% CI 167·4, 200·2) kJ/kg BW) at week 4 (online Supplementary Table S2). Correspondingly, the mean BW in the test group reduced significantly (P <0·001) from baseline, whereas that of the control group did not change (P >0·05) and this change was significantly (P <0·001) higher in the test group at week 4 (online Supplementary Table S2). When transferred to the test diet, mean P intake in the test group increased significantly (P <0·001) to 0·18 (0·17, 0·19) g/kg BW compared with 0·06 (0·04, 0·07) g/kg BW in the control (online Supplementary Table S2). Mean Ca intake was also observed to increase significantly (P <0·001) in the test group to 0·13 (0·12, 0·14) g/kg BW, compared with 0·06 (0·05, 0·07) g/kg BW in the control.
Mineral apparent digestibility and balance
Urinary and faecal P excretion in the test group increased significantly (P <0·001) from baseline and in comparison with the control group (Fig. 1(a)). Urinary excretion of Ca did not change from baseline in either group; however, faecal excretion increased significantly (P <0·001) in the test group and was significantly different (P <0·001) from the change in the control (Fig. 1(b)). Apparent digestibility (dietary intake minus faecal losses) of dietary P was not significantly (P >0·05) different between the control and test groups at baseline: 37·83 (32·34, 43·33) and 38·02 (32·41, 43·63) % respectively. After 4 weeks, P apparent digestibility in the test group increased by 11·28 (3·70, 18·86) % and this change was significantly (P = 0·003) different from that in the control. In the test group, Ca apparent digestibility reduced significantly (P = 0·001) from baseline over the feeding period, but this change was not significantly different (P = 0·139) from the change in the control group.
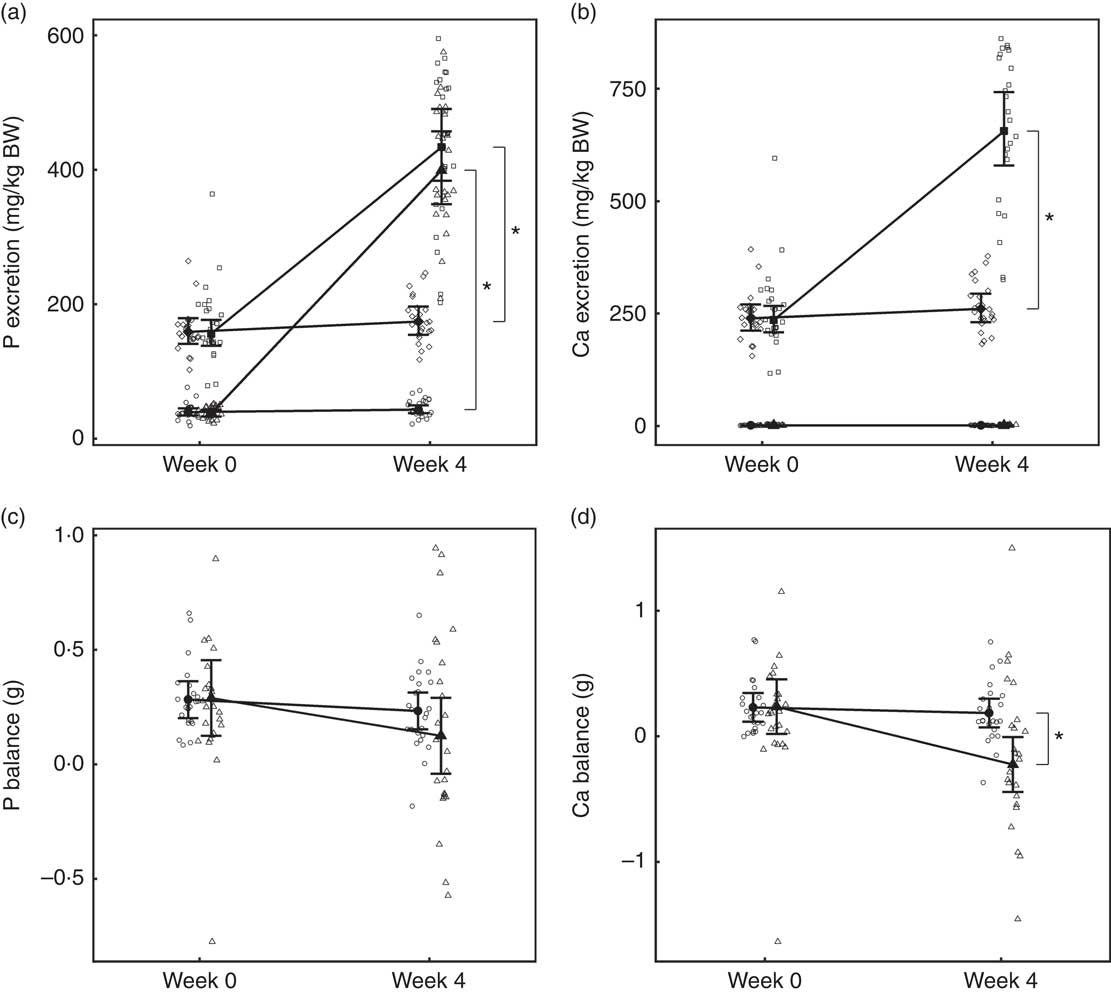
Fig. 1 Study 1, (a) daily faecal and urinary phosphorus excretion (g/kg) n 23–24, (b) daily faecal and urinary calcium excretion (g/kg) n 23–24, (c) phosphorus balance (daily intake minus total daily faecal and urinary excretion in g), n 24 and (d) calcium balance (g), n 24, by study week and diet. Individual cat data are shown as small symbols and means as large symbols with 95 % CI. * Significant between diet difference in change from baseline (P <0·05). Total mineral balance (g) calculated as intake–(faecal excretion + urinary excretion). (a, b) ![]() , Urine – control;
, Urine – control; ![]() , urine – test;
, urine – test; ![]() , faeces – control;
, faeces – control; ![]() , faeces – test. (c, d)
, faeces – test. (c, d) ![]() , Control;
, Control; ![]() , test.
, test.
Total P and Ca balance were not significantly different between diet groups at baseline (Fig. 1(a) and (b)). After the feeding period, P balance was not significantly different from baseline (P = 0·211) (Fig. 1(c)), whereas total Ca balance reduced (P <0·001) by 0·46 (0·16, 0·76) g to become negative in the test group at week 4 and this change was significantly different from that of the control group (Fig. 1(d)).
Glomerular filtration rate
No difference between groups in GFR was observed at baseline (Fig. 2). Although GFR reduced significantly (P <0·05) in both groups over the feeding period, a significantly greater reduction (P <0·001) was observed in the test group compared with the control by 0·26 (0·11, 0·41) ml/min per kg (Fig. 2).
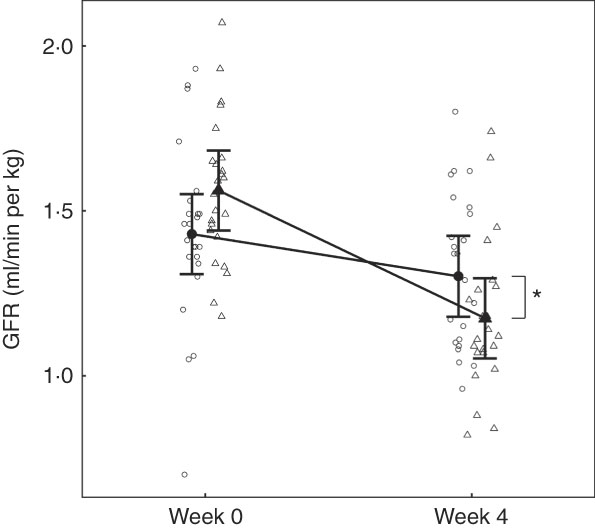
Fig. 2 Study 1, glomerular filtration rate (GFR) determined by iohexol clearance (ml/min per kg) by study week and diet. Individual cat data are shown as small symbols and means as large symbols with 95 % CI, n 23–24. * Significant difference in GFR relative to baseline between diets (P <0·05). ![]() , Control;
, Control; ![]() , test.
, test.
Blood biochemistry
At baseline, no significant differences were observed between diet groups in any parameter except iCa, which was significantly (P = 0·035) higher in the control group by 0·021 (0·001, 0·041) mmol/l (Table 2). However, over the feeding period, control group iCa levels reduced to those of the test group, which did not change (Table 2). After 4 weeks of feeding, significant changes were observed in a number of parameters (Table 2). Plasma creatinine increased significantly in the test group by 24·95 (24·38, 25·52) μmol/l (Fig. 3(a)). In the test group, plasma urea increased significantly (P <0·050) by 1·38 (1·33, 1·44) mmol/l, whereas albumin levels decreased significantly (P <0·050) by 2·08 (2·05, 2·11) g/l (Fig. 3(b)). Plasma ALP concentration also increased significantly in the test group by 0·10 (0·09, 0·12) µkat/l (Table 2). No significant between group difference was observed in plasma total Ca levels, although those of the control group reduced significantly (P = 0·020) (Fig. 3(c)). Plasma inorganic P concentration decreased significantly (P <0·001) in the test but not the control group over the feeding period by 0·40 (0·39, 0·41) mmol/l (Fig. 3(d)). The calculated plasma CaP product was not significantly different between groups at baseline (Table 2); however, after 4 weeks of feeding the test group CaP had reduced significantly (P <0·001) from 3·13 (2·88, 3·40) to 2·12 (1·97, 2·29) mmol2/l2, and this change was significantly (P <0·001) different from the control group, which remained unchanged (Table 2). Additional blood biochemistry values can be seen in online Supplementary Table S3.
Table 2 Study 1 selected blood biochemistry, markers of bone metabolism and vitamin D metabolites (Mean values and 95 % confidence intervals)

ALP, alkaline phosphatase; CaP, plasma Ca–P product; BAP, bone-specific alkaline phosphatase; CTx, serum crosslaps; 25(OH)D, 25-hydroxyvitamin D; 24,25(OH)2D, 24,25-dihydroxyvitamin D; 1,25(OH)2D, 1,25-dihydroxyvitamin D.
a,b Mean values within a row with unlike superscript letters were significantly different between test and control at baseline (P <0·05).
* A significant difference from baseline within group (P <0·05). P-value provides a comparison of the change from baseline at week 4, between test and control diet groups.
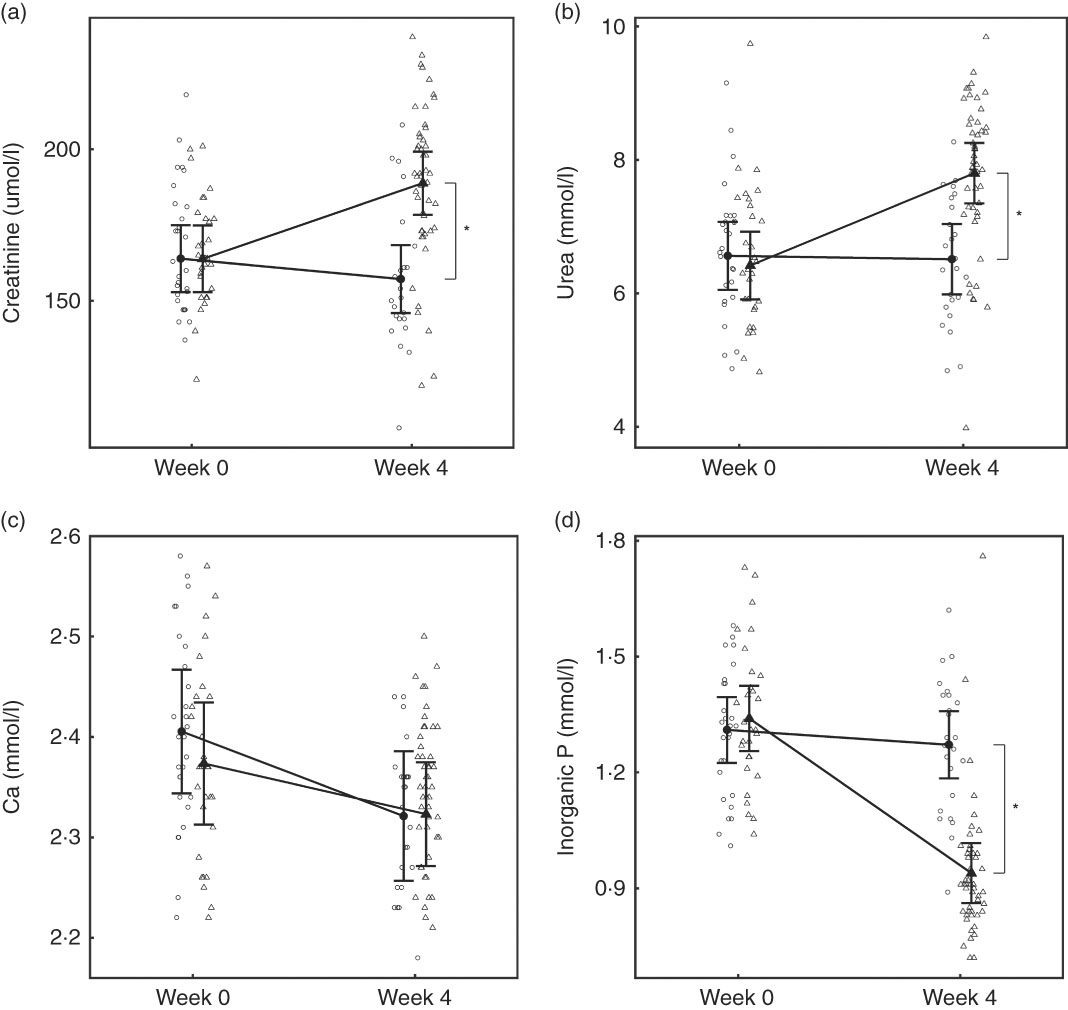
Fig. 3 Study 1, (a) serum creatinine (µmol/l) and (b) serum urea (mmol/l), (c) serum calcium (mmol/l), (d) serum inorganic phosphorus (mmol/l) by study week and diet. Individual cat data are shown as small symbols and means as large symbols with 95 % CI, n 24. * Significant between diet difference in change from baseline (P <0·05). ![]() , Control;
, Control; ![]() , test.
, test.
Vitamin D metabolites
In the test group, total 25(OH)D concentrations fell significantly (P <0·05) from 138·36 (122·47, 156·31) nmol/l at baseline to 115·36 (102·18, 130·24) nmol/l at week 4 (Table 2). No significant (P <0·05) changes were observed in levels of serum total 24,25(OH)2D over the 4-week feeding period (Table 2). Serum levels of C3-Epi-25(OH)D3 were not significantly different (P >0·05) between groups at baseline, but after 4 weeks of feeding had increased significantly (P = 0·01) in the control group, whereas no change was observed in the test group (Table 2). No significant changes in serum 1,25(OH)2D were observed over the 4-week feeding period (Table 2).
Regulatory hormones and markers of bone turnover
Over the 4-week feeding period, levels of FGF23 increased significantly (P <0·001) in the test group by 5·27 (4·14, 6·71)-fold (Fig. 4(a)). PTH also increased significantly in both diet groups; however, in the test group this increase was significantly (P = 0·01) greater by 4·15 (3·41, 5·06) pg/ml (Fig. 4(b)).
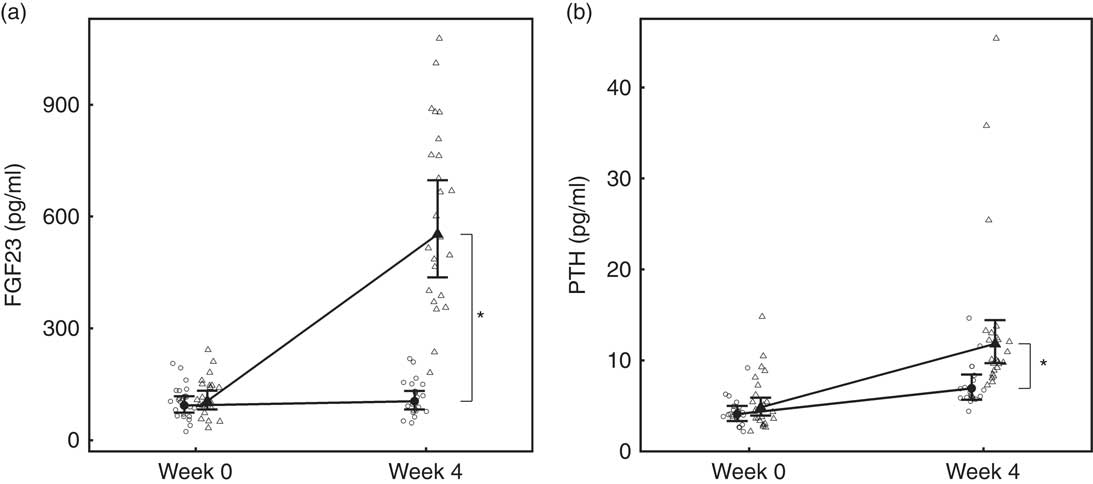
Fig. 4 Study 1, (a) serum fibroblast growth factor 23 (FGF23, pg/ml), n 23–24 and (b) parathyroid hormone (PTH, pg/ml), n 23–24, by study week and diet. Individual cat data are shown as small symbols and means as large symbols with 95 % CI. * Significant between diet difference in change from baseline (P <0·05). ![]() , Control;
, Control; ![]() , test.
, test.
BAP concentrations increased in the test group by 1·39 (1·29, 1·50)-fold, whereas those of the control group did not change (Table 2) and the difference in change from baseline between diets was significant (P <0·001). Serum levels of CTx increased in both the control and test groups by 1·11 (1·02, 1·19)-fold and 1·23 (1·14, 1·32)-fold, respectively; therefore, the difference in change between groups did not meet the level of significance (P >0·05) (Table 2).
Haematology
A total of five parameters were observed to change significantly over the feeding period. Mean corpuscular volume and mean corpuscular Hb reduced in both diet groups, although this was significantly greater (P <0·05) in the test group (online Supplementary Table S4). Red cell distribution width and mean platelet volume both increased significantly in the test group, but not in the control (online Supplementary Table S4), whereas platelet distribution width reduced significantly only in the test group (online Supplementary Table S4).
Urinalysis
Although total daily urine volume increased significantly (P = 0·007) in the test group over the feeding period, no significant between diet difference in change from baseline was observed (Table 3). Urine specific gravity was significantly lower in the test group compared with the control group at baseline (P = 0·04), but increased significantly (P <0·05) by week 4 and no significant between diet difference in change from baseline was observed (Table 3). However, urine relative supersaturation for CaOx and MAP decreased significantly in the test group by 1·73 (1·38, 2·17) and 2·26 (1·39, 3·69)-fold, respectively (Table 3). Urine microalbumin levels increased significantly (P <0·05) in the test cats (Table 3) as did UACR from 1·69 (1·07, 2·67) to 11·70 (7·41, 18·48) mg/g (Fig. 5).
Table 3 Study 1 urine analysis (Mean values and 95 % confidence intervals)
RSS CaOx, urine relative supersaturation for calcium oxalate; RSS MAP, urine relative supersaturation for magnesium ammonium phosphate (struvite); FE, fractional excretion of P or Ca.
a,b Mean values within a row with unlike superscript letters were significantly different between test and control at baseline (P <0·05).
* A significant difference from baseline within group (P <0·05). P-value provides a comparison of the change from baseline at week 4, between test and control diet groups.
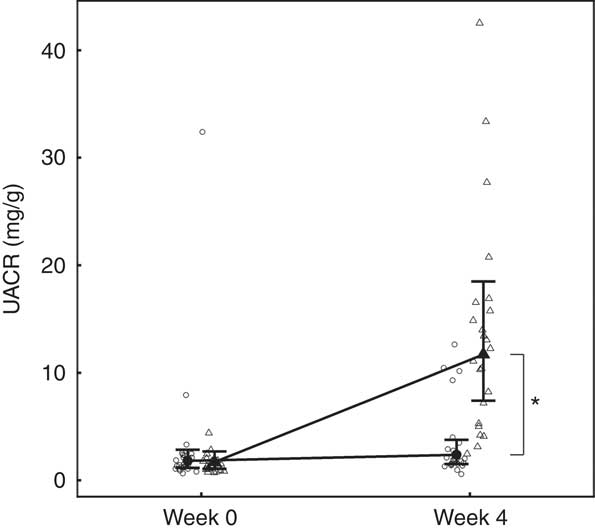
Fig. 5 Study 1, urine albumin creatinine ratio (UACR, mg/g) by week and diet. Individual cat data are shown as small symbols and means as large symbols with 95 % CI, n 24. * Significant between-diet difference in change from baseline (P <0·05). ![]() , Control;
, Control; ![]() , test.
, test.
Fractional excretion
Calculated FEP was not significantly different between groups at baseline (Table 3), but after 4 weeks of feeding increased significantly (P <0·001) in the test group from 11·02 (9·56, 12·71) to 183·05 (158·79, 211·02) % and this change was significantly (P <0·001) different from that in the control group (Table 3). Change in FECa from baseline over the feeding period was not significantly different between groups (P = 0·550), even though that of the test group did increased significantly (P = 0·039) by 1·23 (1·01, 1·50)-fold (Table 3).
Abdominal ultrasound and whole-body radiographs
A total of twenty-two cats (92 %) in the test group had changes in echogenicity indicative of altered renal morphology. Of these, three had subtle, seven narrow and seven broad renal cortical rim sign (RS) identified, whereas five had a broad renal cortical RS with parenchymal speckling and generalised increased echogenicity. In all, two test cats (8 %) had developed renoliths and one pyelctasia. In contrast, one cat in the control group was observed to have developed a narrow renal cortical RS. Examination of the whole-body radiographs did not indicate any evidence of mineralisation of soft tissues or skeletal changes.
Study 2
In all, three cats in the control group were removed from trial after the baseline sample owing to behavioural unsuitability for sample collection. Data from these cats are not included in the analysis. In all, four cats were removed from the study before 28 weeks; one in the control group was removed in week 19 for behavioural reasons and its data were not included after this time. In all, three test group cats were removed after the 21-week sample point revealed changes in serum biochemistry (creatinine and urea outside of normal range) consistent with an adverse effect on renal function and their data were included up to and including week 21. For behavioural reasons, occasional missed or partial samples occurred for other measures and sample numbers are presented in the relevant figures and tables.
Intake and body weight
No significant between-group differences in BW were observed with mean values at baseline of 4·26 (3·88, 4·64) and 4·52 (4·15, 4·89) kg for the control and test groups, respectively, and 4·27 (3·89, 4·66) and 4·49 (4·12, 4·86) kg at week 29 (online Supplementary Table S5). No significant (P >0·05) between-group differences in the change in energy intake were determined at any time (online Supplementary Table S5). After baseline, a significant increase (P <0·001) in mean P intake to 0·16 (0·15, 0·17) g/kg was observed in the test group compared with the control, which did not change from a baseline level of 0·06 (0·05, 0·07) g/kg (online Supplementary Table S5). Mean Ca intake was also observed to increase significantly (P <0·001) from baseline in the test group to a mean of 0·15 (0·14, 0·16) g/kg at week 28 from 0·07 (0·06, 0·08) g/kg.
Mineral apparent digestibility and balance
Urinary and faecal P excretion in the test group increased significantly (P <0·001) from baseline and in comparison with the control group (Fig. 6(a)). The change from baseline in urinary Ca excretion was only significantly (P = 0·036) different between groups at week 28 (Fig. 6(b)). Faecal Ca excretion increased significantly (P <0·001) in the test group compared with baseline and the control group. Apparent P digestibility at baseline was not significantly different (P = 0·996) between the control and test groups: 38·26 (32·14, 44·38) and 40·26 (34·27, 46·25) %, repectively. However, over the 29-week feeding period P apparent digestibility increased in both groups to 50·36 (43·8, 56·92) % in the control group and 51·53 (44·8, 58·25) % in the test group, and therefore no significant (P <0·05) difference between diet difference in change from baseline was observed. Apparent Ca digestibility did not change significantly (P <0·05) from baseline (14·33 (5·52, 23·13) %) in the test group. However, in the control group Ca retention increased significantly (P <0·001) from baseline by 23·05 (9·94, 36·15) to 37·37(27·93, 46·81) % at week 28, a change significantly (P = 0·015) greater than in the test group.
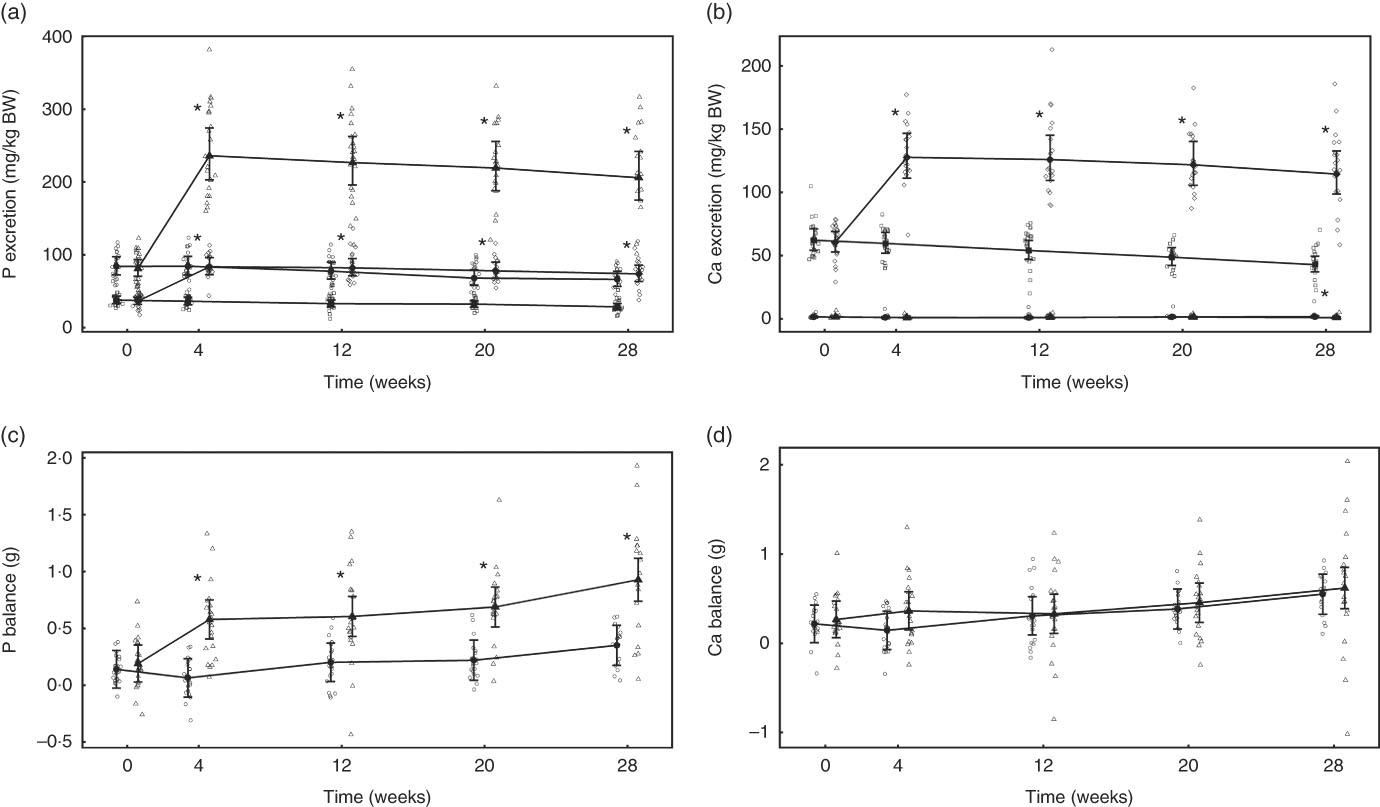
Fig. 6 Study 2, (a) daily faecal and urinary phosphorus excretion (g/kg), n 22–24, (b) daily faecal and urinary calcium excretion (g/kg), n 22–24, (c) phosphorus balance (g), n 22–24, (d) calcium balance (g), n 22–24, by study week and by diet. Individual cat data are shown as small symbols and means as large symbols with 95 % CI. * Significant between-diet difference in change from baseline (P <0·05). Total mineral balance (g) calculated as intake–(faecal excretion + urinary excretion). (a, b) ![]() , Urinary – control;
, Urinary – control; ![]() , urinary – test;
, urinary – test; ![]() , faecal – control;
, faecal – control; ![]() , faecal – test. (c, d)
, faecal – test. (c, d) ![]() , Control;
, Control; ![]() , test. BW, body weight.
, test. BW, body weight.
Total P balance was not significantly different between the diet groups at baseline (P = 0·998) (Fig. 6(c)). From week 4 of the feeding period, total P balance increased significantly (P <0·001) in the test group from 0·39 (0·18, 0·59) to 0·74 (0·52, 0·96) g/d at week 28, whereas that of the control group was significantly (P = 0·047) higher than baseline only at the final time point (Fig. 6(c)). Total Ca balance change from baseline was not significantly different between the diet groups at any time point (Fig. 6(d)).
Glomerular filtration rate
In both diet groups, no significant (P >0·05) change from baseline was observed and no significant between-diet difference determined (Fig. 7).
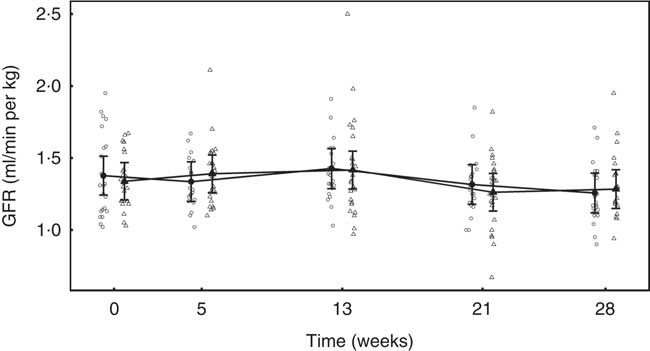
Fig. 7 Study 2, glomerular filtration rate (GFR, ml/min per kg) by study week and diet. Individual cat data are shown as small symbols and means are shown as large symbols with 95 % CI, n 22–25. No significant between diet difference in relative to baseline (P <0·05) was observed. ![]() , Control;
, Control; ![]() , test.
, test.
Blood biochemistry
After 13 weeks of feeding, serum creatinine levels in the control group had fallen significantly (P <0·001) and remained lower than at baseline for the rest of the feeding period. However, in the test group creatinine concentration did not change from baseline at any point (Fig. 8(a)). A significant (P <0·05) difference in change from baseline was observed between groups at weeks 13 and 21 (Fig. 8(a)), but not at week 28 (P = 0·064) (Fig. 8(a)). Of the three cats that developed kidney disease, one was removed after serum creatinine levels were observed to increase from 190 to 283 µmol/l between weeks 13 and 21. The other two individuals were observed to have serum creatinine levels of 192 and 186 µmol/l at week 21 and were removed before week 28. Over the feeding period, serum urea levels fell significantly (P <0·001) below baseline in the control group from 13 weeks onwards (Fig. 8(b)), whereas those in the test group remained unchanged (P >0·05). A significant between-group difference in change in serum urea (P <0·05) was observed at weeks 21 and 28 (Fig. 8(b)). The three cats that developed kidney disease were observed to have serum urea levels of 12·1, 9·5 and 9·0 mmol/l at week 21. In both diet groups serum albumin levels decreased significantly (P <0·001) from baseline, although no significant (P <0·05) between-group difference in was observed (Table 4). Conversely, serum globulin levels increased significantly (P <0·001) from baseline in both groups; no significant between diet differences in change from baseline were detected (Table 4). Serum levels of SDMA did not change from baseline in either diet group over the course of the study and no between-group differences were observed (Table 4). However, fifteen cats in the control group were observed to have SDMA levels of between 0·75 and 1·09 μmol/l (15 and 22 μg/dl) at one or more time point, whereas seventeen test cats were determined to have levels between 0·74 and 1·14 μmol/l (15 and 23 μg/dl) at least once. The three cats that developed kidney disease were observed to have SDMA levels of 1·14, 0·84 and 0·74 μmol/l (23, 17 and 15 μg/dl) at week 21. Serum inorganic P concentrations decreased significantly (P <0·001) from a baseline mean of 1·42 (1·34, 1·52) to 1·22 (1·14, 1·3) mmol/l at week 28, whereas those of the control group did not change (Fig. 8(c)). The change in serum inorganic P concentration was therefore significantly different (P <0·01) in the test group compared with the control group from week 13 onwards (Fig. 8(c)). Serum levels of Ca fell significantly (P <0·05) from baseline in both groups, but a significant between diet difference was only observed at week 28 (P = 0·002, Fig. 8(d)). Post-baseline changes in serum cholesterol levels were observed in both groups, with significant (P <0·05) between-group differences detected between weeks 8 and 21 (online Supplementary Table S6). ALP concentrations were observed to have increased (P = 0·009) from baseline in the test group at week 13, and this change was significantly different (P = 0·003) from that in the control group at this time and at week 21 (online Supplementary Table S6). A transient difference (P = 0·006) in change from baseline was detected in serum K and Na:K ratio at week 13, but no other significant between-diet differences were observed in the biochemical parameters measured (online Supplementary Table S6). Plasma CaP product was not significantly different between groups at baseline (Table 4); however, over the feeding period this reduced significantly (P <0·001) in the test group from 3·6 (3·3, 3·9) mmol2/l2 at baseline to 2·9 (2·7, 3·10) mmol2/l2 at week 28 and this change was significantly (P <0·001) different from the control group (Table 4). Additional blood biochemistry values can be seen in online Supplementary Table S6.
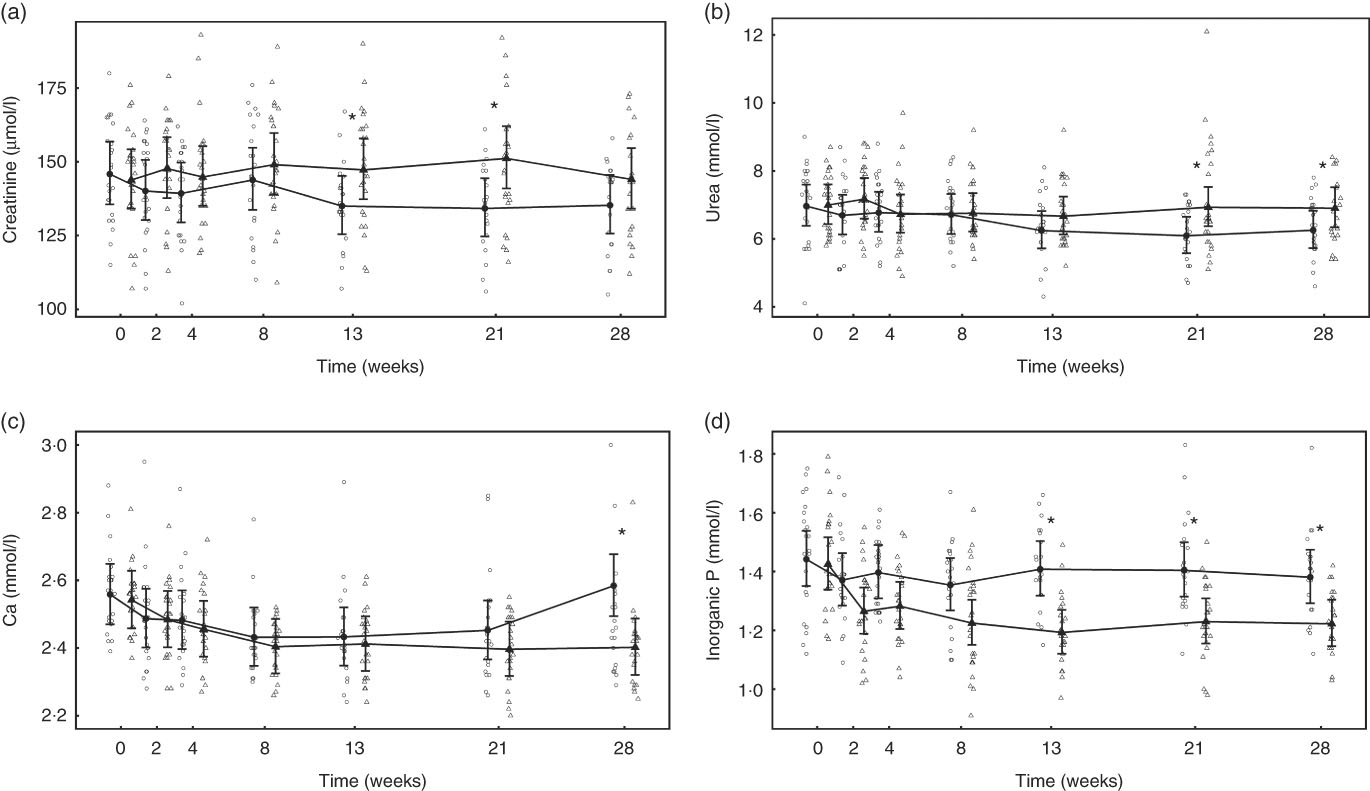
Fig. 8 Study 2, (a) serum creatinine (µmol/l), (b) urea (mmol/l), (c) inorganic P (mmol/l), (d) Ca (mmol/l) by study week and diet. Individual cat data are shown as small symbols and means as large symbols with 95 % CI, n 22–25. * Significant between diet difference in change from baseline (P <0·05). ![]() , Control;
, Control; ![]() , test.
, test.
Table 4 Study 2 selected blood biochemistry, markers of bone metabolism and vitamin D metabolites (Mean values and 95 % confidence intervals)
SDMA, symmetric dimethylarginine; ALP, alkaline phosphatase; CaP, serum Ca–P product; BAP, bone-specific alkaline phosphatase; CTx, serum cross laps; 25(OH)D, 25-hydroxyvitamin D; 24,25(OH)2D, 24,25-dihydroxyvitamin D; 1,25(OH)2D, 1,25-dihydroxyvitamin D.
a Mean values within a row with unlike superscript letters were significantly different between test and control at baseline (P <0·05).
* A significant difference from baseline within group (P <0·05). P-value provides a comparison of the change from baseline at week 4, between test and control diet groups.
Vitamin D metabolites
Serum total 25(OH)D concentrations in the test group fell significantly (P <0·05) from a baseline concentration of 137·89 (117·21, 162·22) to 123·58 (104·85, 145·66) nmol/l at week 28 (Table 4). However, this change was not significantly (P >0·05) different from that of the control group (Table 4). Total 24,25(OH)2D serum concentration increased significantly (P <0·05) from baseline in the test group from 24·52 (19·43, 30·95) to 30·87 (24·36, 39·12) nmol/l at week 28, and this change was significantly (P <0·05) different from the control group from week 13 (Table 4). Serum levels of C3-Epi-25(OH)D3 fell significantly from baseline in the test group from week 13 (P <0·05), although this change was not significantly different (P <0·05) from that in the control group at any point (Table 4). In the test group, other than a transient reduction (P = 0·012) in week 4, serum levels of 1,25(OH)2D did not change from baseline over the feeding period (Table 4). In the control group, serum levels of 1,25(OH)2D were significantly lower than at baseline at weeks 13 and 28 and this change was significantly different (P <0·05) from that in the test group (Table 4).
Regulatory hormones and markers of bone turnover
Over the feeding period, serum levels of FGF23 in the test group increased from baseline by up to 2·91 (1·92, 4·42)-fold and this change was significantly (P <0·05) different from that in the control group at weeks 2, 4, 13 and 21 (Fig. 9(a)). Serum levels of PTH increased above baseline in the test group, although when compared with the control this change did not reach the level of statistical significance at time points other than weeks 21 and 28 (Fig. 9(b)). No significant between-diet differences in change from baseline were observed in the serum levels of CTx, although those of the control group fell significantly (P <0·05) (Table 4). No sustained change in BAP levels were determined in the test group, although levels reduced significantly (P <0·05) compared with baseline from week 8 onwards in the control group and this change was significantly different (P <0·05) to that of the test group from week 4 (Table 4).
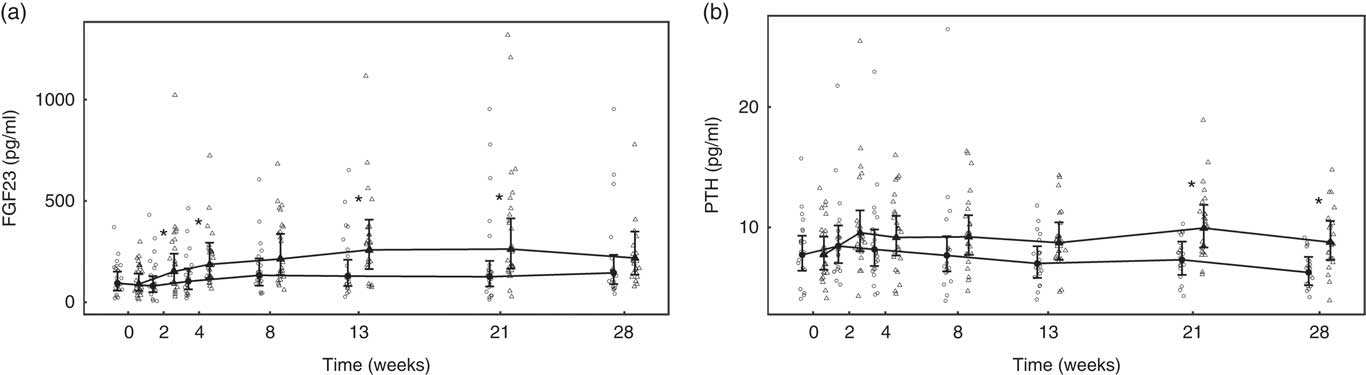
Fig. 9 Study 2, (a) serum fibroblast growth factor 23 (FGF23, pg/ml) and (b) serum parathyroid hormone (PTH, pg/ml), by study week and by diet. Individual cat data are shown as small symbols and means as large symbols with 95 % CI, n 21–25. * Significant between diet difference in change from baseline (P <0·05). ![]() , Control;
, Control; ![]() , test.
, test.
Haematology
Other than transient changes in granulocyte numbers, no significant between diet differences were observed in any of the haematological parameters measured (online Supplementary Table S7).
Urinalysis
No significant between-group differences in change in urine volume, specific gravity or urine pH was observed (Table 5). Urinary creatinine levels did not change from baseline in either group until week 28 when a reduction of 2·43 (2·16, 2·72) mmol/l was observed in the control group (Table 5). Urinary microalbumin levels in the test group increased significantly (P <0·001) from 8·14 (5·49, 12·07) to 48·15 (32·08, 72·26) mg/l, although no change was observed in the control group (Table 5). Consequently, UACR in the test group was observed to increase (P <0·001) from 2·37 (1·46, 3·84) to 14·38 (8·54, 24·21) mg/g at week 28, a change significantly (P <0·001) different from that in the control (Fig. 10). Changes from baseline in urinary Ca, citrate and sulphate were not significantly different between groups at any time point (Table 5). Changes in urinary Mg, Na, urate and ammonium concentrations were small, but at some time points were significantly (P <0·05) different between groups (Table 5). Urinary oxalate concentrations were higher in the test group than in the control by up to 0·64 (0·17, 1·12) mmol/l (Table 5) and the change from baseline in the test group was significantly (P <0·05) different from that of the control. However, changes in urinary RSS for CaOx and struvite were not significantly different between groups (Table 5). In contrast, brushite urinary RSS increased significantly (P <0·05) from baseline in the test group, and this change was significantly different (P <0·001) from the control at week 12 (Table 5).
Table 5 Study 2 urine analysis (Mean values and 95 % confidence intervals)
RSS CaOx, urine relative supersaturation for calcium oxalate; RSS MAP, urine relative supersaturation for magnesium ammonium phosphate (struvite); RSS BRU, urinary RSS for brushite (CaHPO4.2H2O); FE, fractional excretion of P or Ca; CI, CI.
a Mean values within a row with unlike superscript letters were significantly different between test and control at baseline (P <0·05).
* A significant difference from baseline within group (P <0·05). P-value provides a comparison of the change from baseline at week 4, between test and control diet groups.
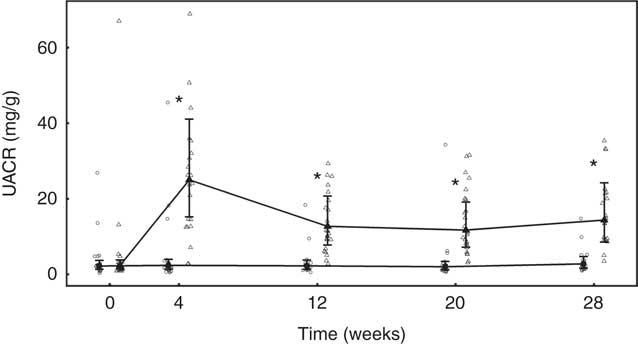
Fig. 10 Study 2, urinary albumin creatinine ratio (UACR, mg/g) by study week and diet. Individual cat data are shown as small symbols and means are shown as large symbols with 95 % CI, n 20–25. * Significant between diet difference in change from baseline (P <0·05). ![]() , Control;
, Control; ![]() , test.
, test.
Fractional excretion
Calculated FEP was not significantly different between groups at baseline, but after 4 weeks of feeding had increased significantly (P <0·001) in the test group from 23·34 (95 % CI 20·41, 26·69) to 75·22 (95 % CI 65·18, 86·80) % (Table 5). This increase was sustained for the rest of the feeding period and was significantly different (P <0·001) from that in the control group (Table 4). FECa was not significantly different between groups and did not change significantly in either group over the feeding period (Table 5).
Abdominal ultrasound, whole-body radiographs and post-mortem histology
At the end of the study, ultrasound examination revealed that fifteen cats (60 %) in the test group had developed renoliths compared with six cases in the control group (27 %). Evidence of changes in kidney echogenicity indicative of structural changes were not observed in the control group, but were observed in nine test cats (36 %). Of these, one test cat was observed to have developed narrow and four broad renal cortical RS, whereas three were observed to have parenchymal speckling, hyperechoic medullary radiating linear echoes or generalised increased echogenicity. In all, five test cats (20 %) were identified as having both changes in echogenicity with renoliths present, two of which had also developed pyelectasia. Examination of the whole-body radiographs did not indicate evidence of any soft tissue mineralisation outside of the kidney or skeletal changes.
Histology
In week 27, following a pre-defined clinical management pathway, one cat from the test group was euthanised after developing acute azotaemia that did not respond to treatment. Post-mortem and histological investigations were carried out. Macroscopically the kidney surface was observed to be irregular and within the cortex several white radial stripes were observed with chronic inflammation and fibrosis. Lesions were radially distributed supporting the presence of renal infarcts. Inflammatory cells, multifocal flattening of the tubule epithelial lining, accumulation of necrotic debris, dystrophic calcifications and crystals were observed under microscopic examination. The inflammatory infiltrate was noted to extend into the medulla, pelvis and renal capsule. Von Kossa staining gave a positive signal in the foci of tubular necrosis, although negative intratubular crystals were also observed.
Discussion
In study 1, feeding cats an extruded diet with a total P content of 4·8 g/1000 kcal (4184 kJ) and Ca:P of 0·6 led to a series of adverse health effects within 4 weeks, including reduced appetite, increased incidence of vomiting, weight loss and changes in renal echogenicity indicative of structural abnormalities. In agreement with findings of Pastoor et al. ( Reference Pastoor, Klooster and Mathot 7 ) and Dobenecker et al. ( Reference Dobenecker, Webel and Reese 8 ), elevated serum creatinine concentrations were observed and these were accompanied by a reduced GFR. A persistent reduction in GFR generally indicates direct damage to the renal tubular cells leading to loss of functioning nephrons( Reference Braun and Lefebvre 29 ). If the initial damage is to the tubular cells( Reference Braun and Lefebvre 29 ), the cells may desquamate into the tubular lumen causing obstruction and back flow of filtrate into the peritubular interstitium, thus increasing glomerular pressure and decreasing GFR( Reference Monaghan, Nolan and Labato 30 ). In turn this leads to a reduction in creatinine and urea clearance from the blood and serum levels increase as observed in study 1. A significant reduction in serum albumin levels was also observed in the test group, possibly indicating impairment in the kidney’s ability to retain this protein. However, as only a relatively small corresponding increase in urine microablumin was observed, this may have been because of losses due to blood sampling, as well as reduced production due to decreased food intake. Haematological changes observed in the study 1 test group were similar to those reported in cats suffering from hyperthyroidism( Reference Bucknell 31 ) – for example, erythrocyte poikilocytosis indicated by changes in mean corpuscular volume, mean corpuscular Hb, reduced erythrocyte distribution width and mean platelet volume. These changes may have been because of haemodynamic disturbance due to reduced GFR( Reference Pechereau, Martel and Braun 32 ). The observed alterations to serum and urinary biochemistry are indicative of stage 2 kidney disease classified using the International Renal Interest Society scale( Reference Lees, Brown and Elliott 33 ) and are supported by the changes in renal morphology identified by ultrasonography. Subsequent monitoring has indicated that these changes are persistent, but not progressive.
Subsequently, study 2 was undertaken with the aim of determining a NOAEL for dietary P. In this study, clinically relevant changes in markers of kidney function were not apparent in the majority of cats offered a test diet containing 3·6 g/1000 kcal (4184 kJ) of P and a Ca:P of 0·9. The mean GFR and circulating concentrations of serum creatinine, urea and SDMA did not change in the test group over the course of the feeding period. It is also of note that serum levels of creatinine and urea fell in the control group, possibly owing to differences between the control diet and the standard diets the cats were habituated to before the study, although it might be expected that adaptation would have taken place over a shorter time period. P regulatory factors, FGF23, PTH, iCa and vitamin D remained within published normal ranges in all but three cats throughout the second study( Reference Geddes, Finch and Elliott 20 , Reference Barber and Elliott 34 , Reference Barber and Elliott 35 ). However, in common with the first study, FGF23 and PTH levels increased significantly in response to the increased P intake, although the changes were less marked. Notwithstanding the lesser degree of adaptive changes observed in study 2 and the stability of mean GFR, the incidence of kidney stones and renal structural changes, as determined by ultrasound, were observed to be higher in the test group. In addition, three cats developed signs of renal dysfunction towards the end of the feeding period, with clinically relevant changes from week 21 of feeding. Taking these observations together, it was not possible to establish a NOAEL for dietary P.
The bioavailability of dietary P is not only influenced by the P content of the diet, but the ratio of Ca:P and source of P have also been demonstrated to play important roles in absorption( Reference Siedler and Dobenecker 9 – Reference Matsuzaki, Kikuchi and Kajita 11 ). Here, in study 1, extra Ca in both organic (bone and meal meal) and inorganic (calcium carbonate) forms was added to balance the P content of the test diets at the desired ratio. Dietary P provided by organic raw materials (e.g. bone meal, poultry meal or P bound by phytates) is less bioavailable than that arising from added inorganic sources (e.g. P containing mono and dibasic Na salts)( Reference Pastoor, Klooster and Mathot 7 , Reference Finco, Barsanti and Brown 12 ). Phosphates are widely used in commercial human and pet food manufacturing, where they serve a number of processing functions and as a source of required dietary P( Reference Gutiérrez 13 ). Such P salts easily disassociate, solubilise and are readily absorbed in the intestinal tract; hence, P absorption can be greatly influenced by the chemical form ingested, with both circulating P concentration and urinary P excretion influenced by differences in dietary P availability( Reference Finco, Barsanti and Brown 12 ). Evidence suggests that over 90 % of inorganic P may be bioavailable, compared with between 40 and 60 % for naturally occurring sources( Reference Noori, Sims and Kopple 10 ); the proportion of dietary P coming from inorganic sources probably contributed to the effects seen after consumption of high P diets in the present studies, as well as those reported by Pastoor et al. ( Reference Pastoor, Klooster and Mathot 7 ) and Dobenecker et al. ( Reference Dobenecker, Webel and Reese 8 ). The test diets used here were formulated using relatively high levels of inorganic SDHP, which has been reported to be highly bioavailable and to have a greater effect on renal parameters than calcium monophosphate( Reference Demmel 36 ). Inorganic neutral monobasic/dibasic sodium phosphates have been observed to increase urinary P concentration more than those originating from organic dietary P sources( Reference Finco, Barsanti and Brown 12 ), and the higher level of dietary Na associated with these salts may stimulate of Na+-dependent uptake of phosphate( Reference Marks, Lee and Nadaraja 14 ). This action could have exacerbated the adverse effects of P intake in the studies presented here and particularly in study 2 when total P level was moderate. However, it is unlikely that Na levels alone induced the renal changes observed here. A study on the effects of dietary salt intake on renal function in healthy aged cats using a test diet at a similar level of Na inclusion did not induce deleterious effects on renal function or changes in plasma P, creatinine and PTH over a 2-year feeding period( Reference Reynolds, Chetboul and Nguyen 37 ). In a recent study of the postprandial effects of dietary P in cats, Coltherd et al. ( Reference Coltherd, Staunton and Colyer 38 ) observed that plasma P profiles are responsive to changes in dietary P content and that inorganic P content drives this response in a dose-dependent manner. These authors report that feeding diets with a high inclusion of SDHP and a Ca:P <1·0 induced a significant increase in postprandial plasma P levels that was sustained for 6 h. Our findings therefore support other reports indicating that diets including high levels of P from inorganic salts may have adverse effects on renal health in healthy cats( Reference Finco, Barsanti and Brown 12 , Reference Demmel 36 , Reference Dobenecker, Webel and Hertel-Böhnke 39 , Reference Hertel-Böhnke and Dobenecker 40 ).
Circulating P levels are regulated by a number of hormones including FGF23 and PTH. In both studies, when high levels of P were ingested, levels of these hormones increased possibly in an attempt to maintain homoeostasis. PTH and FGF23 reduce reabsorption of phosphate in the proximal tubule, resulting in increased P concentration in the tubule, potentially leading to crystallisation( Reference Blaine, Chonchol and Levi 41 ). PTH acts by reducing sodium phosphate cotransporter expression on the apical membrane of the proximal tubule and induces increased urinary P excretion( Reference Levi, Kempson and Lötscher 42 ), as observed here. FGF23 and its cofactor, klotho, bind to FGF receptors type 1 in the proximal tubule and inhibit synthesis of the sodium phosphate cotransporter and 1α-hydroxylase, an enzyme involved in hydroxylation of 25(OH)D (calcifediol) to 1,25(OH)2D (calcitriol the bioactive form of vitamin D)( Reference Razzaque 43 ). As a result, more P would be expected to be excreted in urine and, owing to reduced levels of vitamin D, less P absorbed from the intestine, hence reducing the circulating P level. In the current studies, although urinary P concentration increased in the test groups as might be expected, there was no reduction in P apparent digestibility. While remaining within the normal range (0·8–1·9 mmol/l), circulating P concentrations in both studies were observed to reduce, possibly indicating an over-compensation in urinary excretion. In the first study, owing to the relatively low circulating P levels compared with the high urinary excretion observed, calculated FEP increased significantly over the feeding period to levels much higher than those reported as normal for cats (<73 %)( Reference Finco, Brown and Barsanti 44 , Reference Russo, Lees and Hightower 45 ) and considered physiologically impossible as net tubular secretion of phosphate does not occur. This may be because the fasting levels of circulating P measured in the study are not indicative of transient postprandial changes in concentration. It has been reported in dogs that FE of a number of minerals is significantly higher after feeding, and postprandial measurements may offer further information on adaptations made in response to dietary intake( Reference Lulich, Osborne and Polzin 46 ). In the second study, while FEP increased significantly in response to the more moderate levels of dietary P, although still likely to be an over-estimation owing to postprandial fluctuations in plasma P concentration, values were closer to the reported physiological maximum. Other minerals may also exert effects on P regulation – for example, Mg and P metabolism have previously been linked and hypomagnesaemia has been associated with raised FGF23 production and the progression of CKD in cats( Reference van den Broek, Chang and Elliott 47 ). However, here dietary Mg levels, while meeting nutritional requirements( 4 ), were not fixed and neither serum nor faecal Mg levels were assessed; hence, the contribution of this mineral cannot be interrogated.
P absorption in the gut is regulated by the effect of 1,25(OH)2D on intestinal NaPi-2b transporters( Reference Rizzoli, Fleisch and Bonjour 48 ). However, in both studies, the expected suppression of serum 1,25(OH)2D by FGF23 was not observed, although circulating levels of its precursor 25(OH)D did reduce significantly in the test groups. Increased PTH owing to ingestion of significant quantities of bioavailable P could counteract the effect of FGF23 by upregulating synthesis of 1,25(OH)2D in an attempt to increase Ca absorption. Although in the first study Ca balance became negative, no significant reduction in serum Ca or iCa was observed and FECa remained within reported normal range( Reference Finco, Brown and Barsanti 44 , Reference Lefebvre, Dossin and Trumel 49 ). In the absence of changes in iCa, it is, however, possible that PTH secretion could be increased owing to transient fluctuations in postprandial extracellular P concentration( Reference Nagode, Chew and Podell 50 , Reference Adler, Ferran and Berlyne 51 ). Such postprandial changes in circulating iCa or P, although sufficient to induce PTH, would not be detected in the fasted blood samples taken in the current study. Circadian patterns of serum P, which can be modified by intake, have been observed in humans and it has been suggested that studies targeting intestinal phosphate absorption should consider afternoon phosphate measurements( Reference Ix, Anderson and Smits 52 ). Coltherd et al. ( Reference Coltherd, Staunton and Colyer 38 ) have reported that feeding a diet with a high inclusion of SDHP decreased iCa and increased PTH postprandially. It has also been reported that stimulation of PTH by hypocalcaemia or hyperphosphataemia may be counteracted by balancing dietary Ca:P( Reference Lamberg-Allardt, Karp and Kemi 53 , Reference Ferrari, Bonjour and Rizzoli 54 ). This postulated protective effect of Ca:P is supported by Coltherd et al. ( Reference Coltherd, Staunton and Colyer 38 ), who observed altered iCa and PTH response when a diets of similar SDHP concentration but differing Ca:P was fed. PTH is also reported to increase the rate of bone resorption( Reference O’Brien, Jilka and Fu 55 , Reference Bellido, Ali and Plotkin 56 ), and remodelling, a recognised consequence of increased P load( Reference Dibartola and Willard 3 ). After ingestion of excess P, deposition of Ca and P in bone may increase hypocalcaemia and raise markers of bone turnover( Reference DiBartola 57 ). In study 1, cats offered the test diet were observed to have increased levels of ALP and BAP. ALP breaks down pyrophosphate or β-glycerophosphate into inorganic phosphate essential to osteoblast differentiation and mineralisation( Reference Gutiérrez 58 ) and may also play a role in the intestinal absorption of inorganic P to facilitate transport( Reference DiBartola 57 ). However, such changes were not observed in study 2, when a more moderate amount of P was fed( Reference Kemi, Rita and Kärkkäinen 59 ) and no skeletal mineralisation or demineralisation was observed in radiographs from either study. Despite this, Ca balance was observed to become negative in the first study, indicating increased secretion of Ca into the intestine – a phenomenon previously correlated with high P intake( Reference Heaney and Recker 60 ). This endogenous Ca is probably released from bone, which may be evidenced by the raised levels of ALP owing to increased bone remodelling( Reference Klein, Lafferty and Pearson 61 ).
Increased total P burden can induce soft tissue mineralisation in the kidneys and other organs and deleterious effects of phosphate accumulation can be a direct consequence of calcium phosphate precipitates in the tissues. However, in both studies reported here the fasting CaP product was observed to be well below the level at which mineralisation is reported to occur (70 mg2/dl2; 5·6 mmol2/l2)( Reference Landau, Krymko and Shalev 62 , Reference McLeland, Lunn and Duncan 63 ). The reduction in serum P concentration observed in the test groups actually lowered CaP, which would be expected to reduce the risk of mineralisation( Reference McLeland, Lunn and Duncan 63 ). In the urinary tract, calculi are the most common form of mineralisation and cortical nephrocalcinosis may appear as increased echogenicity in or around the cortex. In both of the current studies, changes in renal echogenicity consistent with mineralisation were observed and histological examination of renal tissue from one cat indicated the presence of crystals and Ca deposits. P intake in cats has previously been reported to play a role in urolithiasis( Reference Pastoor, Klooster and Mathot 7 ), and in study 2 a higher incidence of renolith formation was observed in the test group. P is a component of struvite (MAP) and diets with a high P content have been associated with increased risk of struvite stone formation( Reference Lekcharoensuk, Osborne and Lulich 64 ). However, no sustained increase in urinary struvite RSS was observed with mean levels remaining at less than that regarded as metastable (<2.5)( Reference Evason, Remillard and Bartges 65 ). Crystallisation required for struvite renolith formation only occurs when mineral concentrations are sufficiently high and the urine pH is neutral or alkaline. Here, mean urinary pH was between 6·3 and 6·6 –in the range recommended to reduce the risk of struvite crystal formation in cats( Reference Lulich, Berent and Adams 66 ). CaOx is reported as the most common mineral found in feline renoliths( Reference Osborne, Lulich and Kruger 67 ). In the second study, urine concentrations of oxalate were significantly increased in the test group, although mean urinary RSS for CaOx was similar between groups and below 10, a level reported to reduce the risk of stone formation( Reference Evason, Remillard and Bartges 65 ). In cats primary hyperoxaluria has been noted to result in the presence of birefringent crystals in the tubules and renal fibrosis; however, such cases are rare and linked to a genetic disease similar to human primary hyperoxaluria type 2( Reference McKerrell, Blakemore and Heath 68 ). In the current study, urinary RSS for brushite (CaHPO4.2H2O), another stone-forming mineral, was increased significantly in the test group compared with the control group. Although brushite stones are normally uncommon in cats( Reference Osborne, Lulich and Kruger 67 ), in humans metabolic abnormalities such as renal tubular acidosis and primary hyperparathyroidism are common in brushite stone disease( Reference Pak, Poindexter and Adams-Huet 69 ). Furthermore, humans who form brushite renoliths demonstrate renal cellular damage( Reference Krambeck, Handa and Evan 70 ) and kidney cell injury is associated with the presence of brushite crystals( Reference Evan, Lingeman and Coe 71 ). It has been proposed that a physiological change or insult causing loss of collecting duct cell pH regulation can trigger crystallisation resulting in cell injury and death. In alignment with the histological observations made in study 2, the crystallisation process in humans was observed to enlarge the collecting duct and to initiate interstitial inflammation( Reference Evan, Lingeman and Coe 71 ). It is possible that in the current studies the levels of P reaching the kidney could initiate a similar process, with length of exposure to the P a contributing factor as increased incidence of renolith formation was only observed in study 2. However, as renoliths were also identified in a number of control cats, the effects of other promoters of crystal precipitation and aggregation cannot be excluded. While little information is available on renolith incidence and development in the general cat population, the development of renoliths in the control group over the feeding period was surprising and higher than that observed in a comparable population of colony cats (approximately 11 % of cats)( Reference Hall, Yerramilli and Obare 72 ). The incidence of renolith formation could possibly have been influenced by the lower P content of the control diet as a study evaluating dietary risk factors for CaOx urolithiasis reported that cats consuming diets with lower P content had increased risk for CaOx urolithiasis( Reference Lekcharoensuk, Osborne and Lulich 64 ). However, the control diet was at a P level similar to commercial diets designed for senior cats and not reported to induce negative effects on renal function( Reference Plantinga, Everts and Kastelein 73 ). One shortcoming of the study is the lack of renolith analysis to confirm chemical composition and indicate mechanism of formation. However, surgical intervention to remove the stones was deemed not to be in the therapeutic interest of the cats by the attending veterinary team. It is possible that the moderate protein levels of the diets used could have also influenced the outcome of these studies. Although the formulations were based on standard extruded commercial products, protein inclusion was limited owing to the requirement to produce diets with similar nutrient levels other than P and Ca inclusion. Furthermore, if high-protein inclusion study diets had been used, this could have been a confounding factor in assessment of the impact of dietary P on renal health, as a recent retrospective study has identified a link between high protein intakes and CKD in cats( Reference Böswald, Kienzle and Dobenecker 74 ). Although the test diet offered in the first study and the control diet offered in the second study were, respectively, 1·3 and 0·4 % lower than the AAFCO minimum for adult maintenance (26 % of DM)( 6 ), all the diets used were at least 20 % above the NRC (2006) adult protein RA( 4 ). It would therefore seem unlikely that physiologically meaningful protein deficiency would have occurred over the course of these studies, although this may have resulted in lower circulating creatinine and albumin levels. The conclusions drawn from the studies presented here must, however, be considered in the context of a moderate dietary protein intake.
In conclusion, the results of the present studies suggest that 4-week feeding of a diet containing 4·8 g/1000 kcal (4184 kJ) total P, with a Ca:P of 0·6 and formulated to contain 5·2 % (3·6 g/1000 kcal (4184 kJ)) SDHP, causes renal dysfunction in healthy adult cats. In addition, in most cats prolonged feeding of a diet with a total dietary P content of 3·6 g/1000 kcal (4184 kJ), Ca:P 0·9, formulated to contain 2·2 % (1·5 g/1000 kcal (4184 kJ)) SDHP results in no change in renal function. However, sonographic changes to the kidneys were observed in some individuals, and although the clinical significance of these is not known in a small number renal dysfunction did occur. Multiple sources of evidence suggest that dietary P provided by organic raw materials is less bioavailable than that arising from added inorganic sources, including the SDHP used in the present study. Furthermore, recent studies by our group suggest that diets with a high inclusion of inorganic P and specifically SDHP, along with a Ca:P <1·0, induce a prolonged increase in serum concentration postprandially( Reference Coltherd, Staunton and Colyer 38 ) and that this may be an important factor in the adverse effects observed here. As a NOAEL for dietary P was not established, further work is required to determine both this and the effects dietary P source and Ca:P ratio have on renal health in healthy adult cats.
Acknowledgements
The authors acknowledge the skills and expertise of colleagues at WALTHAM in the care and training of the cats and for the analysis of samples collected throughout the study.
This work was funded by Mars Petcare. The WALTHAM® Centre for Pet Nutrition is a fundamental research centre for Mars Petcare.
J. S., J. Alexander, D. E., M. G., P. M., J. E., R. B. and P. W. conceived the project. J. S., J. Alexander, D. E., P. W. and M. G. developed the overall research plan and had study oversight. J. Alexander, J. S., M. G. and J. Atwal conducted the research and oversaw the analysis of the samples. H. R. carried out and assessed the abdominal ultrasounds and radiographs. R. S. and A. C. performed the statistical analysis. J. Alexander authored the paper with J. S., P. W., M. G., J. Atwal, P. M., J. E. and H. R.
J. Alexander, J. S., J. Atwal, R. B., A. C., D. E., M. G., P. M., R. S. and P. W. were employees of Mars Petcare during the study. J. E. and H. R. acted as paid independent consultants for Mars Petcare at the time of the study.
Supplementary material
For supplementary material/s referred to in this article, please visit https://doi.org/10.1017/S0007114518002751


 Open access