


The role of fish-oil supplementation in numerous diseases has been emphasised; these include coronary disease, rheumatoid arthritis, inflammatory diseases and cancer(Reference Ross, Moses and Fearon1–Reference Friesecke, Lotze and Kohler6).
Fish-oil supplementation has also been proposed for the treatment of cancer cachexia syndrome, an altered metabolic state characterised by anorexia, weight loss, asthenia, anaemia and alterations in carbohydrate, lipid and protein metabolism(Reference Colomer, Moreno-Nogueira and Garcia-Luna7, Reference Evans, Morley and Argiles8). This syndrome is the major cause of morbidity and mortality in patients with advanced cancer(Reference Fearon, Von Meyenfeldt and Moses9).
Previous studies(Reference Bruera, Strasser and Palmer10) using conventional nutrition have shown that it is impossible to increase the lean tissue in cachexia patients; therefore, it is important to use natural substances possessing both nutritional and anti-cachectic properties(Reference Calder11). In particular, EPA, an n-3 PUFA present in large amounts in fish oil, can be considered as a potential natural support: it has been shown to have anti-inflammatory properties, down-regulating both pro-inflammatory cytokine production and the acute-phase protein response in cancer patients(Reference Whitehouse and Tisdale12–Reference Jho, Cole and Lee14). Pro-inflammatory cytokines, IL-1, IL-6 and TNF-α, are recognised to play a central role in the pathogenesis of cancer-related cachexia(Reference Martin, Santolaria and Batista15, Reference Simons, Schols and Buurman16). Furthermore, EPA has also been shown to inhibit activation of the ubiquitin proteasome pathway, by the proteolysis-including factor, a cachectic factor produced by cancer tissue, which induces atrophy of skeletal muscle in animal models(Reference Fearon, Von Meyenfeldt and Moses9).
In 2006(Reference Fearon, Barber and Moses17), the administration of a dose of 2 g or 4 g of EPA was compared to placebo in 518 cancer patients (gastrointestinal and lung), over an 8-week period. The results indicated that there was no benefit with the 4 g dose, but there was a potentially clinically relevant treatment effect with 2 g EPA/d.
In recent years, many studies have addressed this subject, but without reaching any conclusions concerning survival improvement and weight increase. This failure might be attributed to sample heterogeneity, reduction of patient number at the end of studies, lack of patient compliance, or subclinical toxicity of the higher dose of EPA(Reference McLean, Newberry and Mojica18).
The Cochrane analysis published in 2009(Reference Dewey, Baughan and Dean19) concluded that there was insufficient evidence to draw any conclusions about EPA supplementation in cancer patients with cachexia. This systematic review also suggested that there is little evidence of harm in using EPA, especially when combined with Megestrol Acetate.
The anti-inflammatory properties of EPA might also be involved in reducing oxidative stress. The association between reactive oxygen species (ROS), carcinogenesis and progression of lung cancer has been widely demonstrated. The high percentage of oxidants in cigarette smoke contributes to smoking-associated carcinogenesis(Reference Prior20). Asbestos fibres alter the DNA of lung cells, with increased cell proliferation(Reference Mossman and Gee21), by changing the redox state of the cells. Several mechanisms are responsible for the development of oxidative stress in cancer patients: the altered energy metabolism caused by the impossibility of normal nutrition in patients with anorexia, nausea and vomiting results in a reduced availability of glucose, proteins and vitamins, leading to increased free radicals(Reference Hardman22–Reference Larsson, Kumlin and Ingelman-Sundberg24). Furthermore, chronic non-specific activation of the immune system, with excessive production of inflammatory cytokines, is responsible for the increased production of ROS(Reference Mantovani, Macciò and Lai25). An additional mechanism leading to oxidative stress derives from the use of anti-neoplastic therapy: many chemotherapics, and in particular alkylating agents and cisplatin, determine an increasing of ROS(Reference Weijl, Cleton and Osanto26).
The aim of the present study was to investigate the effect of fish-oil components, namely EPA plus DHA, v. placebo, on inflammatory condition, and oxidative and nutritional statuses, in patients with lung cancer.
Experimental methods and participants
Study design
The study was a multicentre, randomised, double-blind trial conducted between May 2007 and May 2008. This study was conducted according to the guidelines laid down in the Declaration of Helsinki and all procedures involving patients were approved by the Scientific Ethics Committee of the City of Turin, Italy (research protocol no. Eudra-CT 2006-002978-21). Written informed consent was obtained from all patients. Patients were randomised at enrolment using a sequential series of numbered, sealed envelopes containing computer-generated random assignments. A copy of the randomisation sequence was kept in a locked cabinet apart from the study personnel. Study products were packaged identically and were not distinguishable from one another.
Participants were randomly divided into two groups: the placebo group and the n-3 group (Fig. 1). The first group was provided with a daily dose of four capsules containing 850 mg of placebo (olive oil), the second with a daily dose of four capsules containing 510 mg of EPA and 340 mg of DHA, for 66 d (the entire period of chemotherapy).

Fig. 1 Study design.
Olive oil was selected as placebo because of evidence that ingestion of this oil was unlikely to change the fatty acid composition of either plasma or cellular phospholipids. Self-reported capsule intake was used to determine patient compliance.
Participants visited the research unit four times: at baseline (T0), after 8 d (T1), 22 d (T2) and 66 d (T3), at which times a blood sample was taken and measurements were made (Fig. 1). T0 coincided with the start of chemotherapy.
Eligibility criteria
Baseline characteristics of patients recruited into this study are shown in Table 1.
Table 1 Nutritional status and energy and protein intakes at baseline and at study end (T0 and T3)*
(Mean values and standard deviations)

* The weight loss percentage is related to the last 3 months, before the start of the study.
† Male, n 8; female, n 5.
‡ Male, n 11; female, n 3.
Patients were recruited with a clinical diagnosis of advanced inoperable non-small-cell lung cancer, in the 18–70-year age range, and with 10 % or less weight loss over the last 3 months, before the start of the study. Patients received three courses of chemotherapy with Cisplatin and Gemcitabine to the following schedule: baseline (T0), after 8 d (T1), 22 d (T2) and after 66 d (T3). Life expectancy was 2 months or longer; Karnofsky Performance Status was 80 or higher.
Exclusion criteria
Patients were excluded if they had undergone chemotherapy failure, if metastases were present, if they were diabetic, had CVD or infectious disease, previous cancer (less than 5 years before or with relapse signs) or inflammatory disease. Patients with neurological deficiency or psychiatric diseases were also excluded.
Nutritional status and dietary intake
Patients were weighed on spring-balance scales (Tanita Solar Powered Scale) without shoes and wearing light clothing. BMI was calculated as the ratio of body weight to the square of their height (kg/mReference De Leiris, De Lorgeril and Boucher2)(Reference Detsky, Smalley and Chang27).
In our study, we did not measure lean body mass with a bioelectrical impedance analyser.
At the start of the study, pre-illness weight, unintentional weight loss over the last 6 months, and height were recorded.
Both groups received the same dietary counselling with the aim to increase their energy and protein intake. A 3-d dietary recall was performed before assessment at baseline (week 0), and each week in the period of 66 d to assess the patients' dietary intakes. Patients completed a dietary diary, and were instructed by a dietitian on how to fill them out correctly. Data on the food intake reported by the dietary diaries were then translated into energy and protein intakes by means of specific tables validated for Italian foods(28). Patients were also requested to record the number of capsules of n-3 fatty acids or olive oil supplement taken each day.
Blood analysis
Plasma and erythrocytes were obtained by centrifuging venous blood (collected in tubes containing EDTA and kept on ice until separation) at 3000 g for 5 min at 4°C (centrifuge J6M, Beckman, Palo Alto, CA, USA), and stored at − 80°C until use. The percentage content of different fatty acids was determined in the total lipids extracted from plasma, and in the phospholipids extracted from erythrocyte membranes(Reference Trombetta, Maggiora and Martinasso29).
Albumin was analysed by an autoanalyser, whereas prealbumin (thyroxine-binding prealbumin) and transferrin were detected quantitatively by immunoturbidity assay. C-reactive protein, IL-6, TNFα and PGE2 production were evaluated in plasma by the ELISA method (R&D systems, Minneapolis, MN, USA). The levels of ROS were detected in the plasma using the probe 2′,7′-dichlorofluorescin diacetate and measured fluorimetrically(Reference Ravindranath30). Hydroxynonenal (HNE) concentration was determined on plasma by the method of Esterbauer et al. (Reference Esterbauer, Schaur and Zollner31).
Statistical analysis
Results are expressed as means and standard deviations. Significant differences between patients in the n-3 and placebo groups were assessed by the unpaired t-test, whereas significant differences within groups were assessed by the paired t test, all tests being two-sided. Statistical analyses were performed using the statistical software package SPSS for Windows version 17.0 (SPSS, Chicago, IL, USA) at baseline (T0), after 8 d (T1), 22 d (T2) and 66 d (T3).
Results
The series comprised thirty-three participants between 46 and 70 years of age; they were randomly assigned to the placebo or the n-3 group. Baseline characteristics (T0) of patients are shown in Table 1. A total of fourteen participants, aged 50–70 years (mean age 60·57 (sd 7·43) years), were allocated to the placebo group; nineteen participants, aged 46–69 years (mean age 58·10 (sd 6·72) years), were allocated to the n-3 group; six patients in the n-3 group (six out of nineteen: 31 %) dropped out during the double-blind phase (two patients changed department oncology, two refused treatment, two had diarrhoea with capsules). Thus thirteen participants in the n-3 group (age 46–66 years; mean 55·56 (sd 7·35) years) completed the study (Fig. 1).
Nutritional status
The patients' nutritional status was not severely compromised, partly because some patients were overweight at the start of chemotherapy. Mean weight of the n-3 group was 75·10 (sd 16·12) kg at baseline and 78·50 (sd 15·94) kg at T3: an increase of 3·4 kg occurred, which was statistically significant (Fig. 2). In the placebo group, there was no increase: mean weight was 68·00 (sd 12·85) kg at baseline and 68·92 (sd 13·44) at T3 (Fig. 2). There was no statistical significance between the two groups at T3.
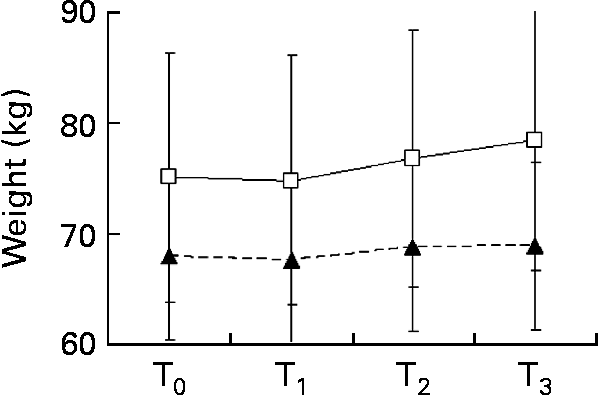
Fig. 2 Comparison of weight changes (kg) in the placebo (–▲–) and n-3 (–□–) groups during the experimental time. Values are means, with standard deviations represented by vertical bars. * Mean values of T3 were significantly different from those of T0 (P < 0·05; paired t test).
Both groups had a satisfying energy intake (1·02 g/kg in the n-3 group and 0·93 g/kg in the placebo group), but they took different amount of proteins daily. Data for BMI and dietary intake (energy and proteins) revealed no statistically significant differences between the two groups. There was a non-significant increase in daily energy and protein intake in the n-3 group (Table 1).
Nutritional blood parameters such as albumin, thyroxine-binding prealbumin and transferrin did not differ between the two groups (data not shown).
Percentage content of n-3 fatty acids in plasma and erythrocytes
The percentage content of EPA in total lipids from plasma and in phospholipids from erythrocyte membranes is reported in Fig. 3, which shows that EPA increased significantly in both plasma (Fig. 3(a)) and erythrocyte membranes (Fig. 3(b)) for the n-3 group, compared to the placebo group, at the two later experimental times.

Fig. 3 Comparison of changes in EPA and DHA in plasma and in erythrocyte membrane content in the placebo (–▲–) and n-3 (–□–) groups during the experimental time. Values are means, with standard deviations represented by vertical bars, and the (a) percentage content of EPA in plasma and (b) erythrocyte membranes, and the (c) percentage content of DHA in plasma and (d) erythrocyte membranes. * Mean values of T1, T2, T3 were significantly different from those of T0 (P < 0·05; paired t test). † Mean values of the n-3 group were significantly different from those of the placebo group (P < 0·05; unpaired t test).
No significant difference was evident in the percentage content of EPA in the placebo group at any of the experimental times, for either plasma or erythrocytes, whereas in the n-3 group there was a significant increase in EPA between the T1 and T0, T2 and T0, T3 and T0, confirming the consumption of supplementary capsules.
The percentage content of DHA, in total lipids from plasma and in phospholipids from erythrocyte membranes, is reported in Fig. 3(c) and (d), which shows that DHA increased significantly in the plasma (Fig. 3(c)), but not in the erythrocyte membranes (Fig. 3(d)) for the n-3 group, compared to the placebo group. Considering the percentage content of DHA in the placebo group throughout the experimental time, no variation was evident for either plasma or erythrocytes, whereas in the n-3 group, significant variations were detected, only for the plasma, between the T1 and T0, T2 and T0, T3 and T0.
The percentage content of docosapentaenoic acid, which is an intermediate between EPA and DHA, was also measured, showing no significant change in the plasma and in the erythrocyte membranes from the placebo and n-3 groups at all experimental times.
Inflammatory parameters
Fig. 4 shows the trends of C-reactive protein, IL-6, TNF-α and PGE2. In the n-3 group, C-reactive protein was not significantly changed between T0 and T3 (from 12·89 to 10·09 mg/l), while in the placebo group the increase, from 11·50 mg/l at T0 to 27·09 mg/l at T3, was significant. Comparing the two groups at T3, the difference was statistically significant (Fig. 4(a)).

Fig. 4 Comparison of changes in C-reactive protein (CRP), IL-6, PGE2 and TNF-α content in plasma in the placebo (–▲–) and n-3 (–□–) groups during the experimental time. Values are means, with standard deviations represented by vertical bars, and the plasma content of (a) CRP, (b) IL-6 and (c) PGE2. * Mean values of T2, T3 were significantly different from those of T0 (P < 0·05; paired t test). † Mean values of the n-3 group were significantly different from those of the placebo group (P < 0·05; unpaired t test).
IL-6 values decreased at T3 from their T0 values in the n-3 group, and increased in the placebo group. Comparing the two groups at T3, the difference was statistically significant (Fig. 4(b)). TNF-α were higher in the placebo group than in the n-3 group, although not significantly so, possibly due to subject variability (Fig. 4(c)). Since n-3 PUFA are able to inhibit the production of pro-inflammatory PGE2, this PG was evaluated in the plasma, using the ELISA test. A significant decrease in the n-3 group occurred during treatment, but there was no variation in the placebo group (Fig. 4(d)).
Oxidative status
Since n-3 PUFA could be damaged by ROS with the production of HNE, both HNE (Fig. 5(a)) and ROS (Fig. 5(b)) were evaluated in the plasma (Fig. 5). Both these parameters increased at the later experimental times in the placebo group, whereas they decreased in the n-3 group. The HNE decrease in the n-3 group was statistically significant between T0 and T3, and the difference between the two groups was statistically significant at T3. ROS values were significantly less in the n-3 group than in the placebo group, at the latter two experimental times.

Fig. 5 Comparison of changes in hydroxynonenal (HNE) and reactive oxygen species (ROS) content in plasma in the placebo (–▲–) and n-3 (–□–) groups during the experimental time. Values are means, with standard deviations represented by vertical bars, and the plasma content of (a) HNE and (b) ROS. * Mean values of T3 were sigificantly different from those of T0 (P < 0·05; paired t test). † Mean values of the n-3 group were significantly different from those of the placebo group (P < 0·05; unpaired t test). UF, unit FORT (0·26 mg/l H2O2).
Discussion
Several studies(Reference Ravasco, Monteiro-Grillo and Marques32–Reference Jatoi34) have emphasised that conventional nutritional support can only partially stop lean mass reduction in cancer patients: it is only possible to increase muscular mass by resolving metabolic alterations(Reference Staal-van den Brekel, Dentener and Schols35). Nutritional support is often wasted due to the hyper-metabolic state of the inflammatory pattern, and for this reason, in cancer patients, the first target of nutritional therapy should be to reduce the inflammatory state; n-3 PUFA could have this effect(Reference Moses, Slater and Preston36, Reference Brown, Zelnik and Dobs37). For this reason, our study looked at the effect of n-3 PUFA administration in patients with advanced lung cancer, in order to evidence the ability of these compounds to improve patients' nutritional status and reduce the inflammatory and oxidative pattern. In this trial, EPA and DHA, two PUFA present in fish oil, were administered in combination, rather than EPA alone, as in most studies. Administration was in capsules rather than supplements, as occurred in Fearons' trials(Reference Fearon, Von Meyenfeldt and Moses9, Reference Fearon, Barber and Moses17), and adherence to the study protocol was observed more closely. Detailed, consistent and persistent dietetic counselling, with assessment of any disorders connected with capsule assumption throughout the study, helped to obtain good compliance with the therapy and with the nutritional intake. Patients' observance of dietetic recommendations was confirmed by the increase, in the plasma of the n-3 group, of EPA and DHA percentage contents from T0 to T3, compared with the placebo group. Changes in DHA content were not due to variation in docosapentaenoic acid percentage content, since the percentage content of this fatty acid did not show significant differences at all experimental times and in both groups.
The patients did not take dietetic supplements other than n-3 fatty acids or olive oil capsules.
In regard to the nutritional status, we evidenced a slight increase, although not significant, of daily energy and protein intakes during the study in the n-3 group, from start to end of chemotherapy, while energy and protein intakes stabilised in the placebo group.
The differences between the two groups are random; in fact, already the n-3 fatty acid group at T0 took more energy and this trend continued throughout the time. Moreover, a statistically significant increase in body weight was achieved in the n-3 group at T3v. T0. It is not feasible that the slight increase of daily energy and protein intakes may influence the variation in body weight.
These data are particularly interesting compared to reports in the literature, which are not always univocal on this point: some studies(Reference Fearon, Von Meyenfeldt and Moses9, Reference Bruera, Strasser and Palmer10, Reference Guarcello, Riso and Buosi38, Reference Elia, Van Bokhorst-de van der Schueren and Garvey39) that have examined the effect of fish oil in cachectic patients expressed the opinion that valid conclusions are difficult to draw, for several reasons (short duration of trial, poor tolerability of supplementation, inability of patients to complete the study). Also, the recent Cochrane(Reference Dewey, Baughan and Dean19) review about EPA for treatment of cancer cachexia did not confirm or reject the use of EPA in clinical practice; the results of the systematic review suggest that there is little evidence of harm deriving from the use of EPA. On the contrary, other studies have reported that EPA+DHA, as in our research, or EPA alone, reduces weight loss in patients with advanced cancer(Reference Ross, Ashley and Norton33, Reference Barber, Ross and Voss40, Reference Barber, Mc Millan and Preston41). In the case of other studies(Reference Fearon, Von Meyenfeldt and Moses9, Reference Fearon, Barber and Moses17, Reference Barber, Ross and Voss40–Reference Wigmore, Barber and Ross42), a comparison with this research is difficult, because of methodological differences (lung, pancreatic or gastrointestinal cancer, treated with pure EPA).
A reduction of inflammatory parameter values found in the n-3 group v. the placebo group, although not always statistically significant, was observed. For example, C-reactive protein and IL-6 levels showed a significant difference between the n-3 and placebo groups at T3 (P < 0·05) and a progressive decrease during chemotherapy in the n-3 group, evidencing an anti-inflammatory action of n-3 PUFA. On the contrary, variations in TNFα were not significant, and those of PGE2 (expression of pro-inflammatory factors) were statistically significant (P < 0·05) from T0 to T2 and T3 in the n-3 group, but not between the two groups.
Some studies(Reference Bruera, Strasser and Palmer10, Reference Ross, Ashley and Norton33, Reference Van der Meij, Langius and Smit43) have reported that n-3 PUFA may suppress inflammatory cytokines in patients with advanced cancers; our data confirm this result. Van der Meij et al. (Reference Van der Meij, Langius and Smit43) recently published the results of a randomised, case–control, double-blind trial of forty patients with stage III NSCLC, who received chemotherapy and radiotherapy, together with either supplements containing 2 g of EPA or isoenergetic control supplements. After 5 weeks of treatment, they observed that the levels of inflammatory markers had decreased during chemotherapy and that IL-6 production was lower in the intervention group than in the control group.
To evaluate the oxidative status throughout the period of the trial reported here, ROS and HNE levels were determined. Plasma ROS levels were higher in the placebo group than in the n-3 group at the later treatment times (P < 0·05). HNE levels (expression of the injury from cellular oxidation) significantly (P < 0·05) increased in the placebo group during the study, while they stabilised in the n-3 group; this demonstrates the cellular oxidative effect of chemotherapy drugs, and the probable protective action of EPA+DHA. The difference between the two groups at the end of the study was also statistically significant.
Our data are encouraging with regard to the goals achieved, although the number of patients was limited: a statistically significant increase in body weight together with a reduction of inflammatory and oxidative parameters in the n-3 group confirm that the continual assumption of EPA+DHA showed an anti-inflammatory and anti-oxidative action, which might be considered a preliminary goal in anti-cachectic therapy.
Conclusions
Although numerous studies have addressed this subject and there is great interest in scientific research concerning n-3 fatty acids, there is as yet little clinical proof to justify applying the results to cancer patients.
In our randomised, double-blind study, despite the small number of patients, we analysed the clinical, inflammatory and oxidative statuses during a period of 66 d, until the end of chemotherapy.
From this we may conclude that: fewer patients dropped out than had been the case with other studies; compliance with the dietitians' recommendations, and with the EPA and DHA assumption, were good; body weight increased significantly in the n-3 group; a significant reduction in inflammatory indexes and in oxidative status was observed.
Acknowledgements
The present study was supported by Sigma-Tau S.p.a. and grants from Piedmont Region and University of Turin, Italy. All authors read and agreed to the editorial policies, and declare that there are no financial or other conflicts of interest that might be construed to influence the results or interpretation of their manuscript. The contributions of the authors are as follows: C. F. designed the research; T. M., M. S., M. T. and E. T. conducted the research; M. A., M. M., M. O. and M. S. provided the essential reagents and patients; M. P. performed TNFα analysis; M. G. C. and N. F. analysed the data; M. F. and G. M. analysed the data and performed the statistical analysis; O. S. wrote the paper; M. C. and C. F. had primary responsibility for the final content. All authors read and approved the final manuscript.


