Concurrent with the prevalence of obesity worldwide, incidences of type 2 diabetes and the metabolic syndrome have been rising. Many of these patients fail therapeutic lifestyle changes and must be treated with lifelong pharmacotherapy, which may be associated with side effects and poor tolerance. Therefore, there is a need to find safe and effective alternatives to help prevent or delay the development of type 2 diabetes and CVD.
Polyphenols are natural phytochemicals found in plant-based foods, such as fruits and vegetables that protect plants against UV radiation, oxidants and pathogens(Reference Bahadoran, Mirmiran and Azizi1). Epidemiological data have shown that diets rich in polyphenols may lower the risk factors for diabetes and other CVD(Reference Bahadoran, Mirmiran and Azizi1). Cranberries are rich in polyphenols and thus have a high antioxidant capacity, potentially providing health benefits to humans(Reference Skrovankova, Sumczynski and Mlcek2). Studies with cranberry consumption over 2–12 weeks in healthy adults have demonstrated improvement in lipids, blood pressure and biomarkers of oxidative stress(Reference Ruel, Pomerleau and Couture3–Reference Valentova, Stejskal and Bednar8).
However, following the use of cranberries, benefits in people with prediabetes or diabetes are still uncertain. Some studies have shown an improvement in fasting and postprandial blood glucose(Reference Shidfar, Heydari and Hajimiresmaiel9,Reference Schell, Betts and Foster10) . Others have not found significant changes in glucose tolerance or insulin sensitivity. In the study performed by Lee et al. (Reference Lee, Chan and Lin11), people with type 2 diabetes were instructed to consume 500 mg of cranberry powder or placebo three times daily for 12 weeks, and no difference in fasting glucose or insulin was observed between treatments. In another study, Basu et al. (Reference Basu, Betts and Ortiz12) found that consuming light cranberry juice twice daily for 8 weeks did not significantly change blood glucose in women with the metabolic syndrome. While previous studies have used surrogate markers of insulin resistance like homeostatic model assessment of insulin resistance, no studies have used the gold standard methodology, that is, hyperinsulinaemic–euglycaemic clamp, to determine insulin sensitivity in humans following consumption of cranberries. Examination of endothelial function via vascular reactivity and biomarkers of oxidative stress would also provide a clinically useful assessment of risk factors that contribute to the development of diabetes and CVD. The goal of the study was to determine if cranberry beverage consumption would improve insulin sensitivity and other cardiovascular risk factors in an obese, free-living population.
Experimental methods
Regulatory approval
The present study was conducted according to the guidelines set forth by the Declaration of Helsinki, and all procedures involving human participants were approved locally by the Pennington Biomedical Research Center Institutional Review Board and registered on www.clinicaltrials.gov (NCT02068144). Written informed consent was obtained from all participants. Study procedures were performed in the Pennington Biomedical Research Center Clinical Trials Units.
Study population
From March 2014 to March 2017, a total of 325 volunteers were screened to enrol thirty-five participants. Individuals were evaluated for initial eligibility through an Institutional Review Board-approved web screener or over the telephone. Potentially eligible people were scheduled for a screening visit where the following inclusion and exclusion criteria were reviewed, and an informed consent form was signed. Participants were allowed to participate in the study if all inclusion and exclusion criteria were met (see Fig. 1).
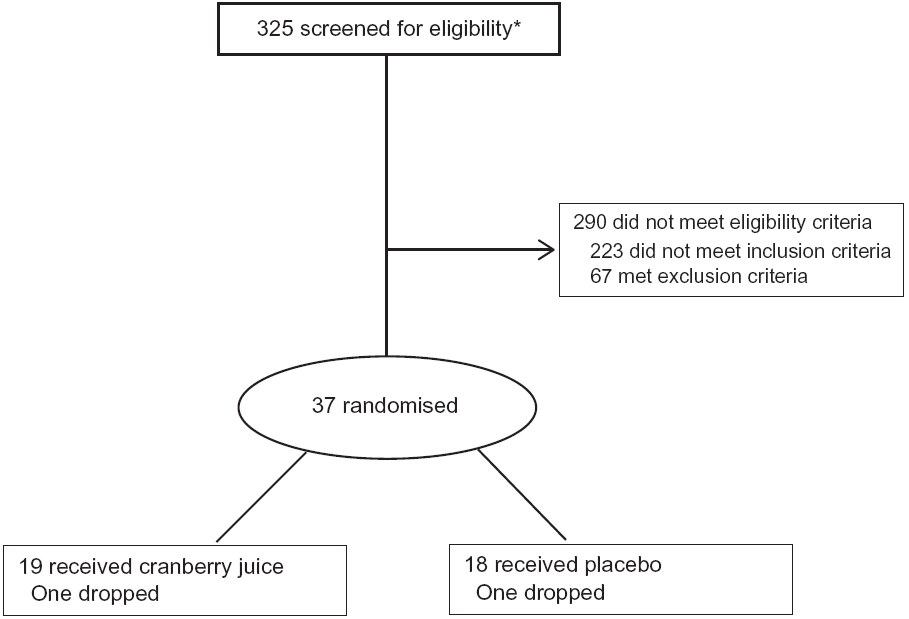
Fig. 1. CONSORT diagram of participants. * Includes ten participants who were screened twice.
Inclusion and exclusion criteria
Men and women aged 20 years and older with obesity as defined by a BMI ≥30 and ≤45 kg/m2 and not taking any medication that might affect blood glucose were considered for the study. In addition, participants were screened for elevated fasting glucose at the initial screening visit and had to demonstrate a value of 5·6–6·9 mmol/l (100–125 mg/dl) to be qualified for the study. If the fasting glucose was 5·3–5·5 mmol/l (95–99 mg/dl), participants had to demonstrate impaired glucose tolerance at the second screening visit based on an oral glucose tolerance test (OGTT) with a 2-h glucose of 7·8–11·1 mmol/l (140–199 mg/dl) inclusive in order to be qualified for the study. All participants also had to have a fasting insulin concentration of ≥5 µIU/ml. Volunteers had no dietary restriction other than those listed in the exclusion criteria.
Major exclusion criteria included the following: a prior history of diagnosed type 1 or type 2 diabetes; allergy to cranberries; use of herbal supplements; smoking within the previous 6 months; use of drugs for weight loss; regular use of anti-inflammatory medications (such as naproxen, aspirin and ibuprofen); pregnancy; concomitant therapy with glucocorticoids (except topical or inhaled glucocorticoids); significant cardiovascular dysfunction and/or hospitalisation within the preceding 6 months; significant gastrointestinal, renal and/or other systemic medical condition; history of malignancy within the past 5 years, other than excised basal cell carcinoma; history of substance abuse or alcoholism within the past 5 years, or significant psychiatric disorder that would interfere with the participant’s ability to complete the study.
Pilot clinical study design
The study employed a randomised, double-blind, placebo-controlled, parallel design. The screening process occurred over two visits within 2 weeks as described above. If qualified, participants underwent a hyperinsulinaemic–euglycaemic clamp test at the baseline randomisation visit. Measurement of vascular reactivity by EndoPAT as well as an OGTT was performed at the second screening visit. EndoPAT was not used to determine eligibility but was performed at the second screening visit for convenience due to the time-consuming nature of the hyperinsulinaemic–euglycaemic clamp at the baseline randomisation visit. A participant was then randomly assigned to one of the beverage groups via a randomisation schedule generated by a biostatistician after the baseline clamp test. Participants returned every 2 weeks for redistribution of beverages, compliance check and anthropometrics assessment. Follow-up phone calls to the participant at weeks 1, 3 and 5 were used to check on adverse events and to ensure compliance. At week 7, OGTT and EndoPAT tests were repeated. The final visit occurred at week 8 with another hyperinsulinaemic–euglycaemic clamp test.
Study intervention
Food-grade ingredients were used to produce the test beverages under carefully controlled quality control and quality assurance programmes by Ocean Spray Cranberries, Inc. The cranberry beverage was made from cranberry extract powder that was reconstituted in water. The composition of bioactive components in the extract powder (see online Supplementary Table S1) was analysed according to methods described in the ‘Analytical measurement’ section. A projected complete profile of bioactive compounds in the final product was estimated based on the use of 0·062 g of cranberry powder per 100 ml of beverage (see online Supplementary Table S1). Both test beverages were isoenergetic (41·84 kJ/450 ml), and the key active compounds in the cranberry test beverage were quantified and found to be at similar levels as those in the commercial cranberry juice cocktail sold in stores (see Table 1). The colour-, taste- and flavour-matched cranberry and placebo beverages came in pre-packaged sealed bottles from the sponsor, labelled with only study codes. Participants were randomised to either beverage group via a blinded randomisation number scheme provided by the Pennington Biomedical Biostatistics Core and were instructed to drink one 450 ml bottle per d for 8 weeks. The beverage could be consumed all at once or the total volume could be spread throughout the day.
Table 1. Composition of study beverages*
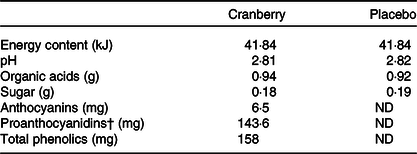
ND, non-detectable.
* All values above are expressed based on 450 ml serving size.
† Quantified by modified Brunswick Laboratories 4-dimethylaminocinnamaldehyde method with cranberry proanthocyanidins as standard.
Outcome measurements
Hyperinsulinaemic–euglycaemic clamp
Clamps were performed to assess insulin sensitivity after a 10-h fast. Participants were admitted to the inpatient research unit the evening prior to their clamp testing day and consumed a euenergetic standardised meal (50 % carbohydrates, 35 % fat and 15 % protein). The next morning, an intravenous catheter was placed in an antecubital vein for infusion of insulin and glucose. A second catheter was inserted in a vein of the contralateral arm to draw blood. During 45 min prior to the clamp, blood samples were collected every 15 min for glucose and insulin. Then insulin was administered at a primed continuous infusion rate of 120 mU (720 pmol) × 1/m2 × 1/min for 2 h, and blood samples were collected every 5 min for glucose and every 15 min for insulin during this period. Serum insulin was measured by a Siemens Immulite 2000 using an immunoassay with chemiluminescence. A variable infusion of dextrose (20 % solution) was given to maintain serum glucose concentrations at approximately 5·6 mmol/l (100 mg/dl). Arterialised serum glucose was measured using a YSI 2300 Stat Plus glucose analyzer (model no. 2300 STAT Plus D) and Beckman Coulter DXC600. During the steady state (last 30 min of clamp), the mean rate of exogenous glucose infusion was corrected for changes in glycaemia and divided by the participant’s weight to assess insulin sensitivity expressed as the glucose disposal rate. A higher glucose disposal rate indicates higher insulin sensitivity and lower insulin resistance.
Oral glucose tolerance test
OGTT was performed on a separate day from the clamp test before the initiation of the test beverage and repeated after the intervention. Each participant arrived in the morning after a 10-h fast (nothing consumed except water) since the evening before. An intravenous line was placed in the arm to draw a total of six blood samples. A fasting blood sample was drawn at –15 and 0 min. Participants then drank 75 g of glucose within 5 min. After the first sip of the glucose drink, blood samples were drawn at 30, 60, 90 and 120 min. Insulin (Siemens Immulite 2000) and glucose (Beckman Coulter DXC600) concentrations were evaluated at each time point.
EndoPAT
Assessment of resting endothelial function and vascular reactivity was done in a fasting state at the same fixed clock hour (range 08.00–10.00 hours) with an EndoPAT device (Itamar Medical Endo-PAT®). The participants, after having avoided stimulants for 12 h, were placed in a supine position for 20 min before the test. A finger sleeve placed on the index finger of each hand provided peripheral arterial tone data. A blood pressure cuff was used to occlude the brachial artery of the non-dominant arm for 5 min, followed by a release. The built-in software integrated data gathered from the finger sleeves of the control and the test arms during the baseline, occlusion and release phases, which provided a measure of endothelial function. Endothelial dysfunction, the first step in the process of atherosclerosis, is associated with increased adverse cardiovascular outcomes.
RMR
RMR was measured twice during the hyperinsulinaemic–euglycaemic clamp procedure using a DeltatracTM II Metabolic Cart (Sensormedics). A large plastic hood was placed over the participant’s head in order to measure gas exchange for 45 min before the start of the clamp and during the last 45 min of the clamp. Energy expenditure at both time points was calculated and compared between the two groups.
Laboratory assays
The following laboratory tests were conducted at screening and at week 8: complete blood count; comprehensive metabolic profile including electrolytes, lipids, liver enzymes and urinalysis to evaluate overall health. In addition, biomarkers of endothelial reactivity, endothelin 1 for vasoconstriction (Quantikine ELISA); nitrate for nitric oxide production (Parameter ELISA); biomarkers of oxidative stress status, oxidised LDL for lipid oxidation (Mercodia ELISA); lectin-like oxidised LDL receptor 1 (Abcam ELISA); 8-Isoprostane for fatty acid peroxidation (Cayman Chemical ELISA); malondialdehyde for fatty acid peroxidation (Cayman Chemical ELISA); advanced glycation end products for oxidative stress due to hyperglycaemia (Lifespan Biosciences ELISA) and paraoxonase-1 for anti-oxidant capability (AVIVA Systems Biology ELISA) were measured at baseline and week 8. Results falling beyond detection limits were excluded from the analyses.
Analytical measurement
Analytical measurement of anthocyanins in cranberry extract powder and beverage was analysed according to Brown & Shipley(Reference Brown and Shipley13) using a HPLC system (Agilent 1260 Infinity; Agilent Technologies, Inc.) equipped with a binary pump, autosampler and a diode array detector. The mobile phase consisted of solvent A (deionised water–85 % phosphoric acid, 99:1, v/v) and solvent B (deionised water–acetonitrile–85 % phosphoric acid, 50:49:1, by vol.). Flavonoid analyses were performed on an Agilent 1260 HPLC system (Agilent 1260 Infinity; Agilent Technologies, Inc.) equipped with a binary pump, autosampler and a diode array detector. Chromatographic separation was carried out with a Phenomenex Kinetex 2·6 µ F5, 100 Å 100 × 4·6 mm column. The mobile phase consisted of solvent A (deionised water–trifluoroacetic acid, 99·9:0·1, v/v) and solvent B (acetonitrile–methanol, 70:30, v/v). Peaks of individual anthocyanins and flavonols were compared with commercially available standards (ChromaDex). Total proanthocyanidin (PAC) content was determined in a 4-dimethylaminocinnamaldehyde colorimetric assay with an absorbance at 640 nm wavelength(Reference Prior, Fan and Ji14). The assay utilised a reference standard based on an isolated fraction of purified cranberry PAC(Reference Feliciano, Krueger and Shanmuganayagam15), which would represent more accurately the spectrum of the degree of polymerisation (DP) of PAC in the cranberries. DP profile of PAC was quantified by Agilent 1100/1200 HPLC system with fluorescence detection as described previously(Reference Robbins, Leonczak and Li16). Fluorescent detection was determined with an excitation and emission wavelength at 230 and 321 nm, respectively. Polyphenols were measured using an improved Folin–Ciocalteu method, and absorbance was measured at 765 nm wavelength(Reference Sanchez-Rangel, Benavides and Heredia17).
Statistical analysis
With thirty-five participants, our study was powered to detect a mean difference in insulin sensitivity of 22·6 % between cranberry and placebo arms with a power of 80 % and an α of 0·05. These estimates were based on between-group changes in a previous study of blueberry consumption and improvements in insulin sensitivity(Reference Stull, Cash and Johnson18).
The responses for the statistical models are expressed as mean changes from baseline with standard errors. Age, sex, BMI and baseline values were considered as the covariates while building the statistical model but did not significantly improve the model fit as compared with the model with no covariates. Statistical results are shown based on ANOVA tests. In a secondary analysis, all primary endpoints were also stratified by median C-reactive protein (CRP) level (>4 v. ≤4 mg/l). Categorical variables were compared using χ 2 tests. A P value ≤0·05 was considered statistically significant. Statistical calculations were performed using SAS® version 9.4.
Results
Baseline characteristics of the participants in the two groups are listed in Table 2. No significant differences were noted between the two randomly assigned groups. One participant dropped out in each group. Beverage consumption compliance was evaluated by calculating returned empty bottles divided by the number of bottles that should have been used. Based on this criterion, compliance rates were excellent at 99 and 98 % in the cranberry juice and the placebo groups, respectively.
Table 2. Baseline characteristics of participants*
(Mean values and standard deviations)
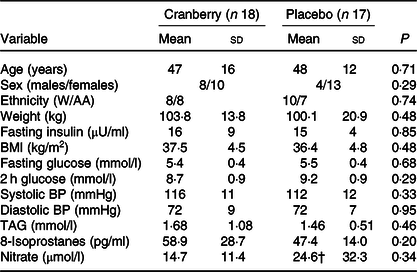
W/AA, White/African American; BP, blood pressure.
* P values are for comparisons between groups at baseline.
† Denotes n 16; value of one sample was below the limit of detection and was excluded from the analysis.
Insulin sensitivity via hyperinsulinaemic–euglycaemic clamp
The change in glucose disposal rate was not statistically different between the two groups after 8 weeks. The mean glucose disposal rate decreased by 0·10 in the cranberry group and increased by 0·21 in the placebo group.
Glucose tolerance testing
There was no difference in mean fasting or 2-h glucose between the two groups at baseline. In addition, the change in fasting glucose and 2-h glucose from baseline to the end of the study did not show statistically significant differences between the two groups.
Endothelial function/vascular reactivity
The change in the reactive hyperaemia index measured by EndoPAT was not different within each group nor was the change in reactive hyperaemia index between the two groups statistically significantly different. The mean change from baseline in the reactive hyperaemia index in the cranberry group was –0·16 v. –0·08 in the placebo group. It was noted that thirty-four of the thirty-five participants had normal reactive hyperaemia index (defined as >1·67) at baseline.
RMR
There was no difference in the initial energy expenditure measurement at baseline nor was there a significant change in initial energy expenditure from baseline to after 8 weeks between the two groups.
Body weight and blood pressure
Compared with the placebo group, the cranberry group did not show any significant differences in body weight or blood pressure from baseline to end of study.
Laboratory assays
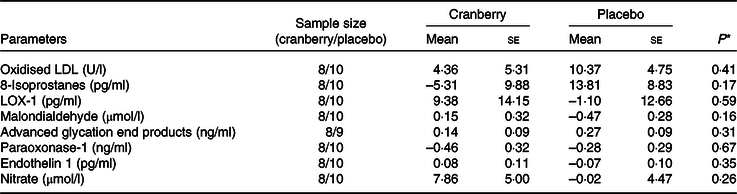
Overall, the percentage change in lipid profile from baseline to end of study was not significantly different between the two groups. Total cholesterol, LDL-cholesterol and HDL-cholesterol concentrations declined in both groups over time. However, as shown in Table 3, the mean percentage change in TAG concentration from baseline declined in the cranberry group and increased in the placebo group, P = 0·06. Among the biomarkers (Table 4), only 8-isoprostane concentrations were significantly different between the two groups (–2·18 pg/ml in the cranberry group v. +20·81 pg/ml in the placebo group; P = 0·02). When the data were further stratified by a baseline median CRP cut-off level of 4 mg/l (Tables 5–8), there was a significant difference in mean percentage change in TAG level from baseline between the two groups with a 13·75 % decrease in the cranberry group (n 10) and a 10·32 % increase in the placebo group (n 7) (P = 0·04) in high CRP sub-group. No difference in the percentage change in TAG level from baseline was seen in the low CRP sub-group (CRP ≤ 4 mg/l). In addition, there was a significant difference in the mean change in nitrate concentrations from baseline between the cranberry and placebo groups (+3·26 v. −6·28 µmol/l; P = 0·02), and 8-isoprostane levels (+0·32 v. +30·8 pg/ml; P = 0·05) in participants in high CRP sub-group (CRP level > 4 mg/l). These differences were not observed in the low CRP sub-group.
Table 3. Changes from baseline in cardiovascular risk factors
(Mean values with their standard errors)
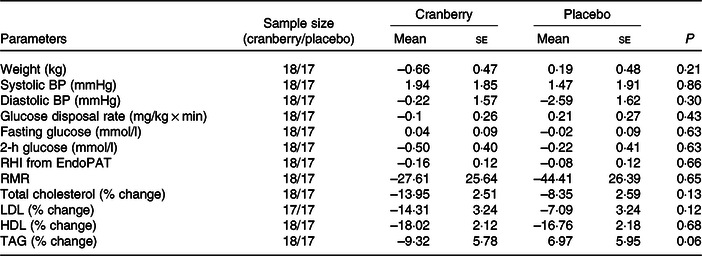
BP, blood pressure; RHI, reactive hyperaemia index.
Table 4. Changes from baseline in biomarkers of oxidative stress and endothelial reactivity
(Mean values with their standard errors)

LOX-1, lectin-like oxidised LDL receptor 1.
* P values are for between-group differences.
Table 5. Changes from baseline in cardiovascular risk factors for participants with baseline C-reactive protein > 4 mg/l
(Mean values with their standard errors)
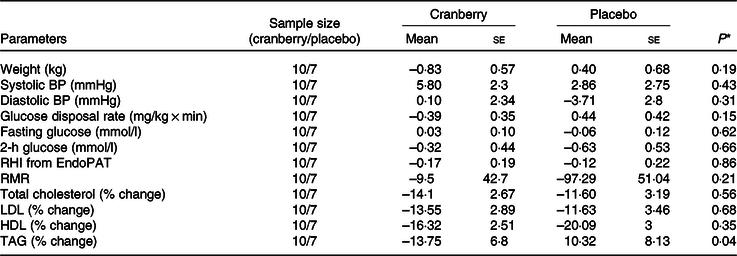
BP, blood pressure; RHI, reactive hyperaemia index.
* P values are for between-group differences.
Table 6. Changes from baseline in biomarkers of oxidative stress and endothelial reactivity for participants with baseline C-reactive protein > 4 mg/l
(Mean values with their standard errors)
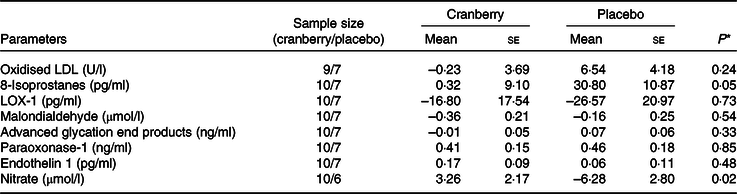
LOX-1, lectin-like oxidised LDL receptor 1.
* P values are for between-group differences.
Table 7. Changes from baseline in cardiovascular risk factors for participants with baseline C-reactive protein ≤ 4 mg/l
(Mean values with their standard errors)
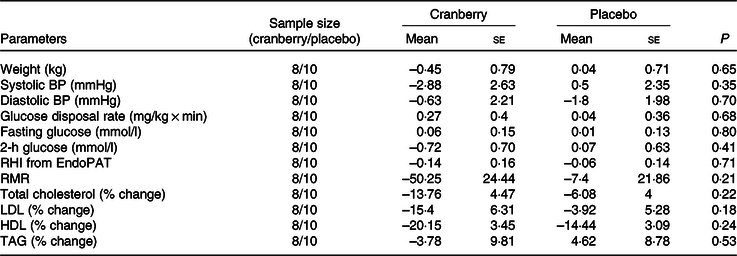
BP, blood pressure; RHI, reactive hyperaemia index.
Table 8. Changes from baseline in biomarkers of oxidative stress and endothelial reactivity for participants with baseline C-reactive protein ≤ 4 mg/l
(Mean values with their standard errors)
LOX-1, lectin-like oxidised LDL receptor 1.
* P values are for between-group differences.
Adverse events
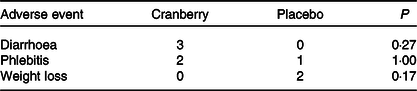
No serious adverse events occurred during the study. A total of fifty-eight adverse events were recorded in twenty-three participants with nineteen adverse events noted to be possibly related to the study intervention or the study procedures. Table 9 demonstrates three adverse events that occurred in more than 5 % of participants in either group. There was no significant difference in adverse events between the two groups.

Discussion
Previous publications have shown mixed results in terms of cranberry’s effect on insulin sensitivity and glucose metabolism. In a study performed by Chambers & Camire(Reference Chambers and Camire19), twenty-seven participants with type 2 diabetes took six cranberry capsules (equivalent to one 240-ml serving of cranberry juice cocktail) per d for 12 weeks. Compared with placebo, cranberry capsules did not change fasting serum glucose, HbA1c, fructosamine, TAG or HDL and LDL levels after 6 and 12 weeks(Reference Chambers and Camire19). This was in line with null findings of another study by Lee et al. (Reference Lee, Chan and Lin11). However, null findings from these two studies were in contrast to other cranberry studies(Reference Chew, Mathison and Kimble6,Reference Novotny, Baer and Khoo7,Reference Shidfar, Heydari and Hajimiresmaiel9) . In a study conducted by Shidfar et al. (Reference Shidfar, Heydari and Hajimiresmaiel9), drinking one cup of cranberry juice daily for 12 weeks lowered fasting glucose by approximately 1·1 mmol/l (20 mg/dl) among fifty-eight men with type 2 diabetes. Novotny et al. (Reference Novotny, Baer and Khoo7) demonstrated that low-energy cranberry juice (240 ml twice daily) improved fasting glucose and insulin resistance via homeostatic model assessment of insulin resistance. Chew et al. (Reference Chew, Mathison and Kimble6) found that participants consuming 450 ml daily of a cranberry extract beverage had significantly lower blood insulin levels compared with those in a placebo beverage group after consumption for 8 weeks. Furthermore, several other studies with polyphenol-rich fruit extract interventions showed an improvement in insulin sensitivity. Hokayem et al. (Reference Hokayem, Blond and Vidal20) found a 20 % decrease in hepatic insulin sensitivity index and an 11 % decrease in glucose infusion rate in response to a 6 d high fructose challenge in the placebo group compared with a grape polyphenol supplementation 2 g daily for 8 weeks. In the study performed by Stull et al. (Reference Stull, Cash and Johnson18), a 6-week intake of a smoothie with 45 g of blueberry extract powder increased insulin sensitivity by 22 %. As recently reported by Paquette et al. (Reference Paquette, Medina Larque and Weisnagel21), intake of 1·84 g daily of a strawberry–cranberry powder blend for 6 weeks resulted in a lower first-phase insulin secretion response as measured by C-peptide levels during the first 30 min of the OGTT.
In our study, we examined whether a cranberry beverage could improve insulin resistance, which is a risk factor for the development of diabetes. The polyphenol content in one 450 ml serving is equivalent to that of juice from 50 g of fresh cranberries. However, the hyperinsulinaemic–euglycaemic clamp results did not show a significant improvement in insulin sensitivity compared with the placebo group. There was also no difference in fasting glucose or 2-h glucose during an OGTT between two groups. This could be partially due to the challenges of performing a dietary intervention among a free-living population, which might increase the variation of outcome measurement between groups. In the present study, daily routine activities such as habitual diets and physical activities were not modified over the course of study. This could have affected the variation between the groups and thus might have compromised the potential benefit from consumption of cranberry products. It should be noted that studies with polyphenols from grape(Reference Hokayem, Blond and Vidal20), blueberry(Reference Stull, Cash and Johnson18) and strawberry(Reference Paquette, Medina Larque and Weisnagel21) did suggest an improvement of insulin sensitivity following the aforementioned supplementation as measured by hyperinsulinaemic–euglycaemic clamp. However, the dosage of polyphenols in those supplements would be equivalent to 250–300 g of fresh fruits, which is very challenging to achieve as part of a healthy dietary pattern, and suggests that a higher level of polyphenols is needed to see an effect in the present study.
Many risk factors are associated with diabetes and CVD, such as low-grade inflammation, oxidative stress and dyslipidaemia. CRP, a serum biomarker for inflammation, is strongly positively associated with higher risk of the development of type 2 diabetes(Reference Liu, Feng and Li22). Elevated baseline CRP level is independently associated with future cardiovascular and all-cause mortality in type 2 diabetes patients(Reference Tian, Tian and Wang23). In the present study, consumption of cranberry beverage did not significantly alter CRP levels from baseline. However, when TAG concentrations of both groups were stratified based on baseline CRP level (high v. low; cut-off median CRP value of 4 mg/l), response to the treatment showed a significantly different result. TAG concentrations decreased following cranberry beverage intake while they increased following placebo beverage consumption among participants with high CRP level (P = 0·04). These findings suggest participants under a pro-inflammatory state may benefit more from consumption of cranberries. While cranberries have been touted as sources of polyphenols that may act directly in eliminating free radicals and/or influencing stronger expression and synthesis of natural antioxidant enzymes(Reference Rosa Cde, Dos Santos and Leite24), the mechanism of action in lowering lipids (and specifically TAG) is not entirely clear in humans and warrants further study. Among bioactive components in the cranberries, PAC (condensed tannins) might be one of the promising candidates eliciting the lipid lowering effect. Nie & Sturzenbaum(Reference Nie and Sturzenbaum25) reviewed the impact of PAC of natural origin on lipid metabolism in the literature. They indicated that PAC from different food sources could modulate blood lipids through a variety of molecular mechanisms, including restriction of lipid absorption, coordination of digestion of neutral lipids, inhibition of lipase, stimulation of β-oxidation and reduction of liver de novo lipogenesis. In vitro studies have also shown that the flavonoid quercetin, contained in cranberries, inhibited de novo TAG synthesis and intestinal apoB secretion, thus limiting lipid availability(Reference Casaschi, Wang and Dang26).
Reactive oxygen species and oxidative stress have long been considered underlying mechanisms for the pathogenesis of diabetes and its complications(Reference Park, Kang and Jeon27). Surrogate biomarkers were selected in the present study to represent changes in endothelial function and oxidative stress status. Among the biomarkers tested, only changes in nitrate and 8-isoprostane were significantly different from baseline to 8 weeks between the two beverage groups in the high CRP sub-group. However, biomarkers of oxidative stress could be affected by a variety of factors and may not adequately reflect the overall improvement in a person’s oxidative status. Although some trends were observed in the biomarkers, this pilot study may not be powered to detect differences in the biomarkers of oxidative stress. Despite the abundance of data showing the antioxidant potential of cranberries in vitro and in animal models(Reference Vattem, Ghaedian and Shetty28), it remains equivocal whether cranberry consumption increases antioxidant capacity and decreases biomarkers of oxidative stress in humans.
The strength of the present study is the application of ‘gold standard’ techniques to evaluate insulin sensitivity. However, there were several limitations to our study. We recruited participants with impaired glucose tolerance, elevated fasting glucose or both across a range of glycaemic status, which may have led to varying responses to the intervention. Another limitation of the study was evaluating the compliance of beverage intake by counting returned empty bottles without information about polyphenol metabolites in the blood. Production of metabolites requires a healthy gut ecosystem, especially after large molecular weight polyphenols flux into colon for faecal fermentation. Indeed, the DP of PAC in the cranberry extract powder was quantified via HPLC method with fluorescent detection. Monomers (DP1), dimers (DP2), trimers (DP3), oligomers (DP4-7) and polymers (DP ≥ 10) accounted for 1·6, 4·2, 3·8, 16·3 and 74 %, respectively, of total cranberry PAC. Polymeric PAC could be poorly absorbed in the upper intestinal tract and would be fermented in the colon by gut microbiome. A characteristic fingerprint of cranberry metabolites in the blood could have been helpful to not only ensure compliance but also to tease out the possibilities of non-responders and dysbiosis in the gut. Finally, there is no standard amount of cranberry extract that has been shown to have consistent health benefits in the literature. Future studies should examine the amount of cranberry extract in a dose-dependent manner that is necessary to yield health benefits in healthy or specific patient populations.
Conclusion
Cranberry beverage consumption over an 8-week period did not improve insulin sensitivity or glucose tolerance, endothelial function/vascular reactivity or RMR. However, the present study demonstrated that cranberry beverage consumption over an 8-week period can lead to a reduction in TAG concentrations and a reduction in oxidative stress levels in people with elevated CRP concentrations.
Acknowledgements
We would like to acknowledge all of the participants who made the present study possible. We would like to acknowledge the statistical support provided by Dr Jeffrey Burton and Sandra Larrivee. We would also like to acknowledge the logistic support from Fritz Maingrette, Derek Zhang and Christina Khoo of Ocean Spray Cranberries, Inc.
The present study was funded by a clinical trial agreement from Ocean Spray Cranberries, Inc. Study procedures were performed in the Pennington Biomedical Research Center Clinical Trials Units which are supported in part by 1 U54 GM104940 from the National Institute of General Medical Sciences of the National Institutes of Health, which funds the Louisiana Clinical and Translational Science Center and by a Nutrition Obesity Research Center grant no. P30DK072476 entitled ‘Nutrition and Metabolic Health Through the Lifespan’ sponsored by the National Institute of Diabetes and Digestive and Kidney Diseases. The content is solely the responsibility of the authors and does not necessarily represent the official views of the National Institutes of Health.
C. K. and D. S. H. designed the study. D. S. H. and F. L. G. conducted the research. R. S. B. and D. S. H. analysed data. D. S. H. and D. J. Z. wrote the initial draft of the manuscript. All authors read, provided input and approved the final manuscript.
D. J. Z. and C. K. are employees of Ocean Spray Cranberries. For the other authors, there are no conflicts of interest.
Supplementary material
For supplementary material referred to in this article, please visit https://doi.org/10.1017/S0007114520001336